. 2020 Nov 27;295(48):16342-16358.
doi: 10.1074/jbc.RA120.015132. Epub 2020 Sep 14.

The solution structure of the complement deregulator FHR5 reveals a compact dimer and provides new insights into CFHR5 nephropathy

Affiliations

The solution structure of the complement deregulator FHR5 reveals a compact dimer and provides new insights into CFHR5 nephropathy

Nilufar Kadkhodayi-Kholghi et al. J Biol Chem. .

Abstract

The human complement Factor H-related 5 protein (FHR5) antagonizes the main circulating complement regulator Factor H, resulting in the deregulation of complement activation. FHR5 normally contains nine short complement regulator (SCR) domains, but a FHR5 mutant has been identified with a duplicated N-terminal SCR-1/2 domain pair that causes CFHR5 nephropathy. To understand how this duplication causes disease, we characterized the solution structure of native FHR5 by analytical ultracentrifugation and small-angle X-ray scattering. Sedimentation velocity and X-ray scattering indicated that FHR5 was dimeric, with a radius of gyration (Rg ) of 5.5 ± 0.2 nm and a maximum protein length of 20 nm for its 18 domains. This result indicated that FHR5 was even more compact than the main regulator Factor H, which showed an overall length of 26-29 nm for its 20 SCR domains. Atomistic modeling for FHR5 generated a library of 250,000 physically realistic trial arrangements of SCR domains for scattering curve fits. Only compact domain structures in this library fit well to the scattering data, and these structures readily accommodated the extra SCR-1/2 domain pair present in CFHR5 nephropathy. This model indicated that mutant FHR5 can form oligomers that possess additional binding sites for C3b in FHR5. We conclude that the deregulation of complement regulation by the FHR5 mutant can be rationalized by the enhanced binding of FHR5 oligomers to C3b deposited on host cell surfaces. Our FHR5 structures thus explained key features of the mechanism and pathology of CFHR5 nephropathy.

Keywords: FHR5; Monte Carlo simulations; analytical ultracentrifugation; atomistic modeling; complement; molecular dynamics; molecular modeling; small-angle X-ray scattering (SAXS); small-angle X-ray scattering analytical ultracentrifugation.


Conflict of interest statement

Conflict of interest—The authors declare that they have no conflicts of interest with the contents of this article.

Figures
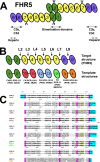
Figure 1.
Figure 1.
The human FHR5 SCR-1/9 domain structure. A, schematic representation of the domain structure of the human FHR5 dimer and its ligand binding sites. The two putative N-linked glycosylation sites (not modeled) on SCR-2 and SCR-7 are depicted as Y-shaped symbols. Domains SCR-1/2 (green) form a head-to-tail dimer. Domains SCR-3/7 (yellow) have high sequence identities to human Factor H SCR-10/14. The C3b/C3d- and heparin-binding sites are indicated as arrows on SCR-8 and SCR-9 (purple). B, summary of the templates used for the homology modeling of FHR5. Each FHR5 domain is aligned with the corresponding crystal/NMR structure denoted by its PDB code. C, the sequences of the nine FHR5 SCR domains are aligned with the template SCR sequences identified by their PDB codes. The conserved cysteine and tryptophan residues are highlighted in pink and yellow respectively, and the linkers in cyan. The residue numbering corresponds to the full FHR5 protein sequence (SWISSPROT accession code Q9BXR6) including the signal peptide, with +1 corresponding to the methionine start codon.
Figure 2.
Figure 2.
Purification of FHR5. A, gel-filtration profile showing the removal of aggregates from the FHR5 sample. The sample was loaded onto a SuperdexTM 200 gel-filtration column. Fractions containing homogeneous FHR5 from the large peak as indicated were pooled. Mass determinations are shown in Fig. 3. B, nonreducing (NR) and reducing (R) SDS-PAGE analyses of FHR5 (∼65 kDa monomeric). The molecular masses of the Mark 12TM protein standard (Invitrogen) in kDa are labeled.
Figure 3.
Figure 3.
SEC-MALLS analysis of FHR5. The elution profile (chromatogram) for FHR5 was analyzed using UV detection (blue), MALLS (light scattering), detector (red), and refractive index detector (green). Three successive prominent peaks (1–3 as indicated by the pairs of numbers below were examined for their molecular mass. The calculated molecular masses were >5,400, 162, and 27 kDa for peaks 1, 2, and 3, respectively. The refractive index peak above 8.0 min is attributed to the end of the gel-filtration step.
Figure 4.
Figure 4.
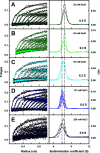
Size-distribution c(s) sedimentation velocity analysis of FHR5. Left, the experimentally observed sedimentation boundaries (black) by interference optics are shown for 0.16 mg/ml FHR5 SCR-1/9 based on the following PBS buffers: 20 mm NaCl (A), 50 mm NaCl (B), 90 mm NaCl (C), 137 mm NaCl (D), and 250 mm NaCl (E). In each case, 40–50 boundaries (colored lines) were fitted as shown. Right, the data fits corresponded to rotor speeds of 40,000 rpm (solid lines) and 50,000 rpm (dashed lines). The resulting size-distribution analyses c(s) revealed a major peak that shifted from 6.5 S in 20 mm NaCl to 5.9 S in 250 mm NaCl. The vertical dashed lines illustrate the shift in s20 values as the salt concentrations increased.
Figure 5.
Figure 5.
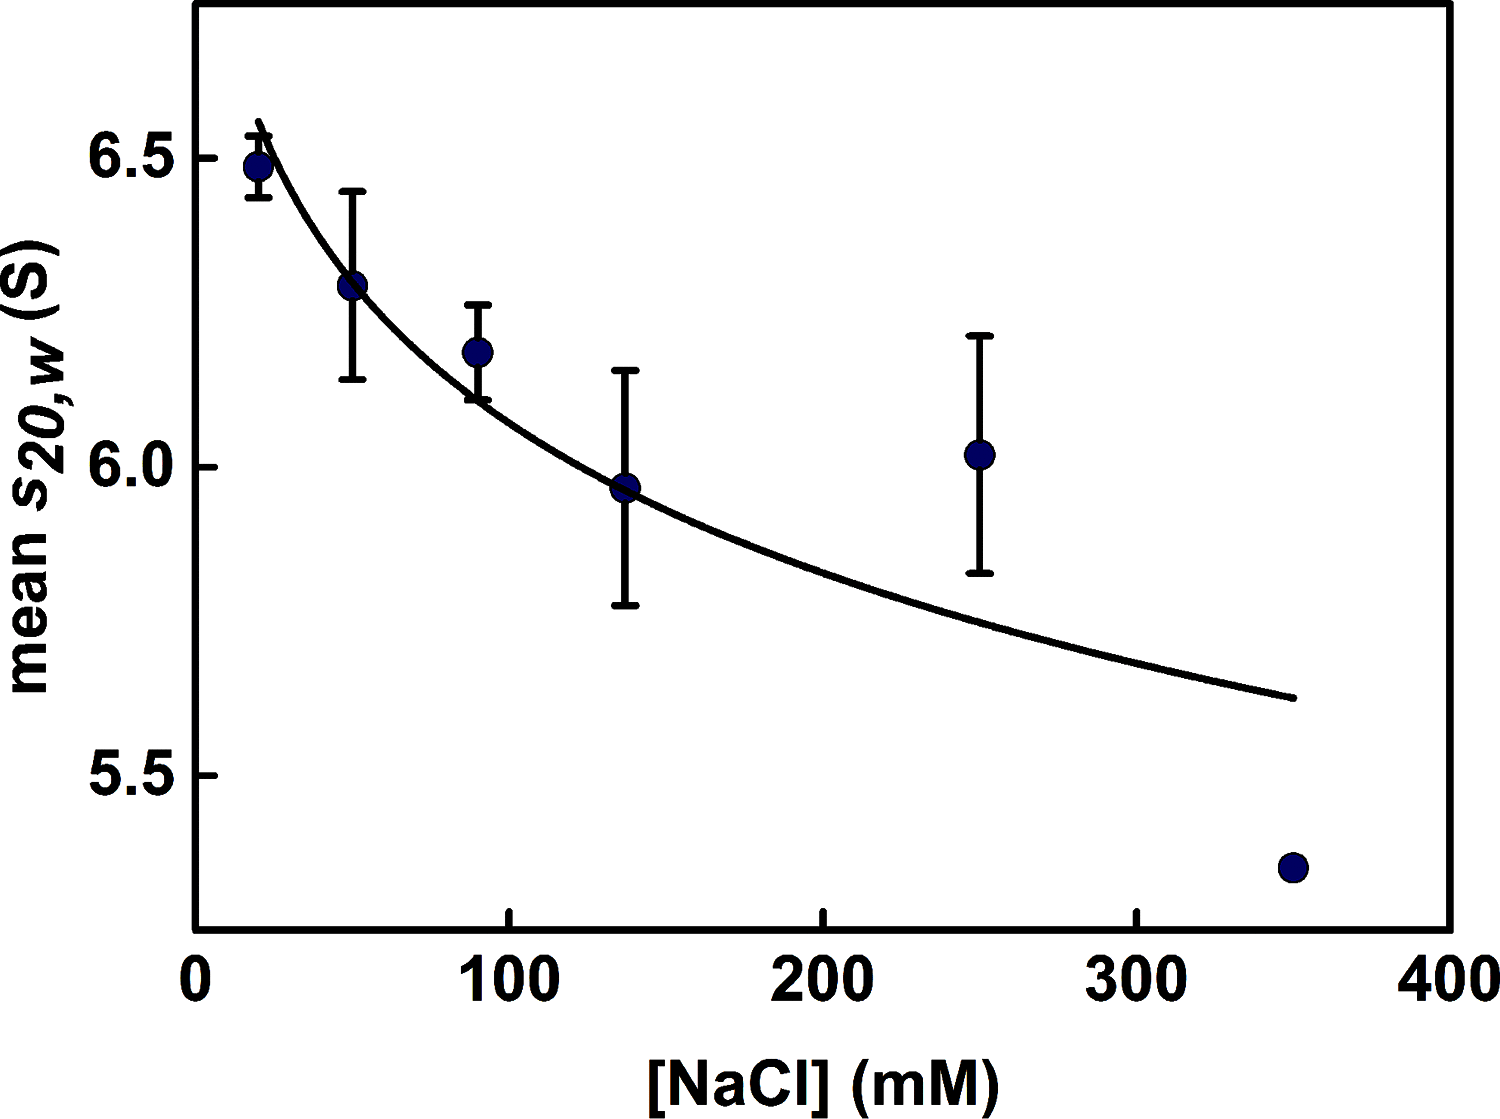
Relationship between sedimentation coefficient and the buffer salt concentration. The mean ± S.D. of the sedimentation coefficient (s20,w) data are shown as a function of the NaCl concentration in each buffer. For PBS-350, only a single data point was available.
Figure 6.
Figure 6.
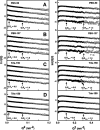
X-ray Guinier Rg and Rxs analyses for FHR5. In the Guinier analyses, plots of ln I(Q) against Q2 for the Rg analyses (left), and ln I(Q).Q against Q2 for the Rxs analyses (right) are shown. The straight lines indicate the slopes of each fit. The filled circles correspond to the Q.Rg and Q.Rxs ranges used for each fit, with the Q range used for the Rg values being 0.10–0.27 nm−1, and that for the Rxs values being 0.32–0.55 nm−1 (arrowed). In rows A, B¸ and C, the fits correspond to FHR5 concentrations of 0.17, 0.13, 0.09, and 0.04 mg/ml from top to bottom in each panel. A, the FHR5 fits correspond to PBS-50; B, the FHR5 fits correspond to PBS-137; C, the FHR5 fits correspond to Tris-150. D, the FHR5 fits correspond to 0.5, 0.4, 0.3, and 0.2 mg/ml from top to bottom in Tris-150.
Figure 7.
Figure 7.
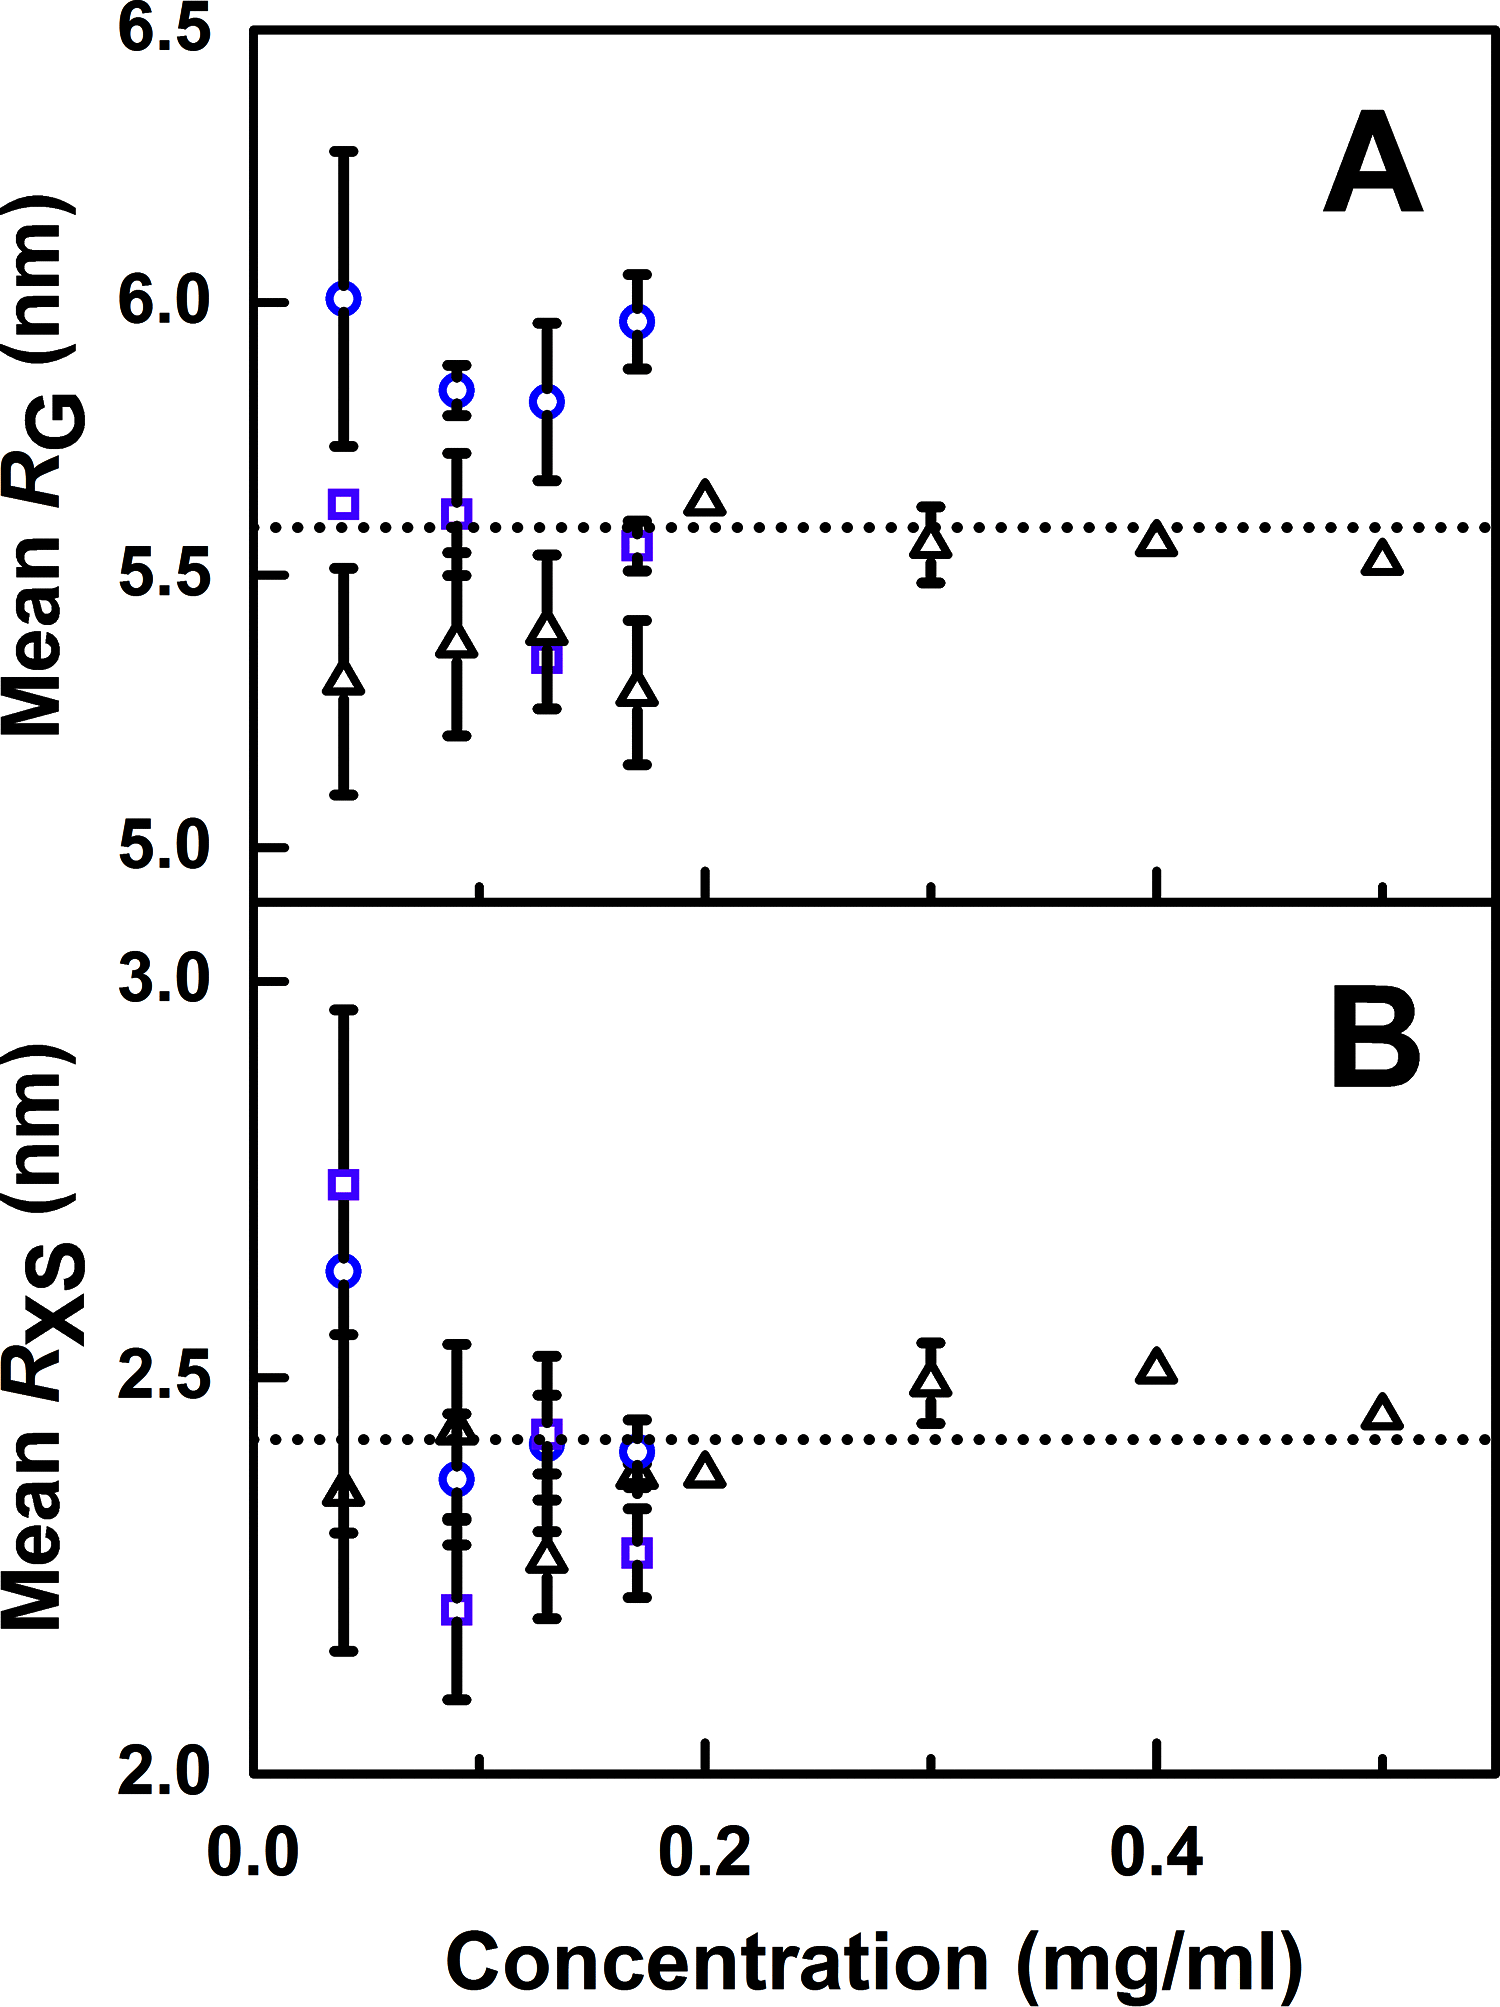
Concentration dependence of the X-ray Guinier Rg and Rxs values. Each value was measured in triplicate and shown as the mean ± S.D. at low concentrations, except for the data sets above 0.2 mg/ml, which were measured once. The Rg (A) and Rxs (B) values are shown for PBS-50 (blue, circles), PBS-137 (purple, squares), and Tris-150 (black, triangles) buffers. The dotted line in both panels represents the mean across all values.
Figure 8.
Figure 8.
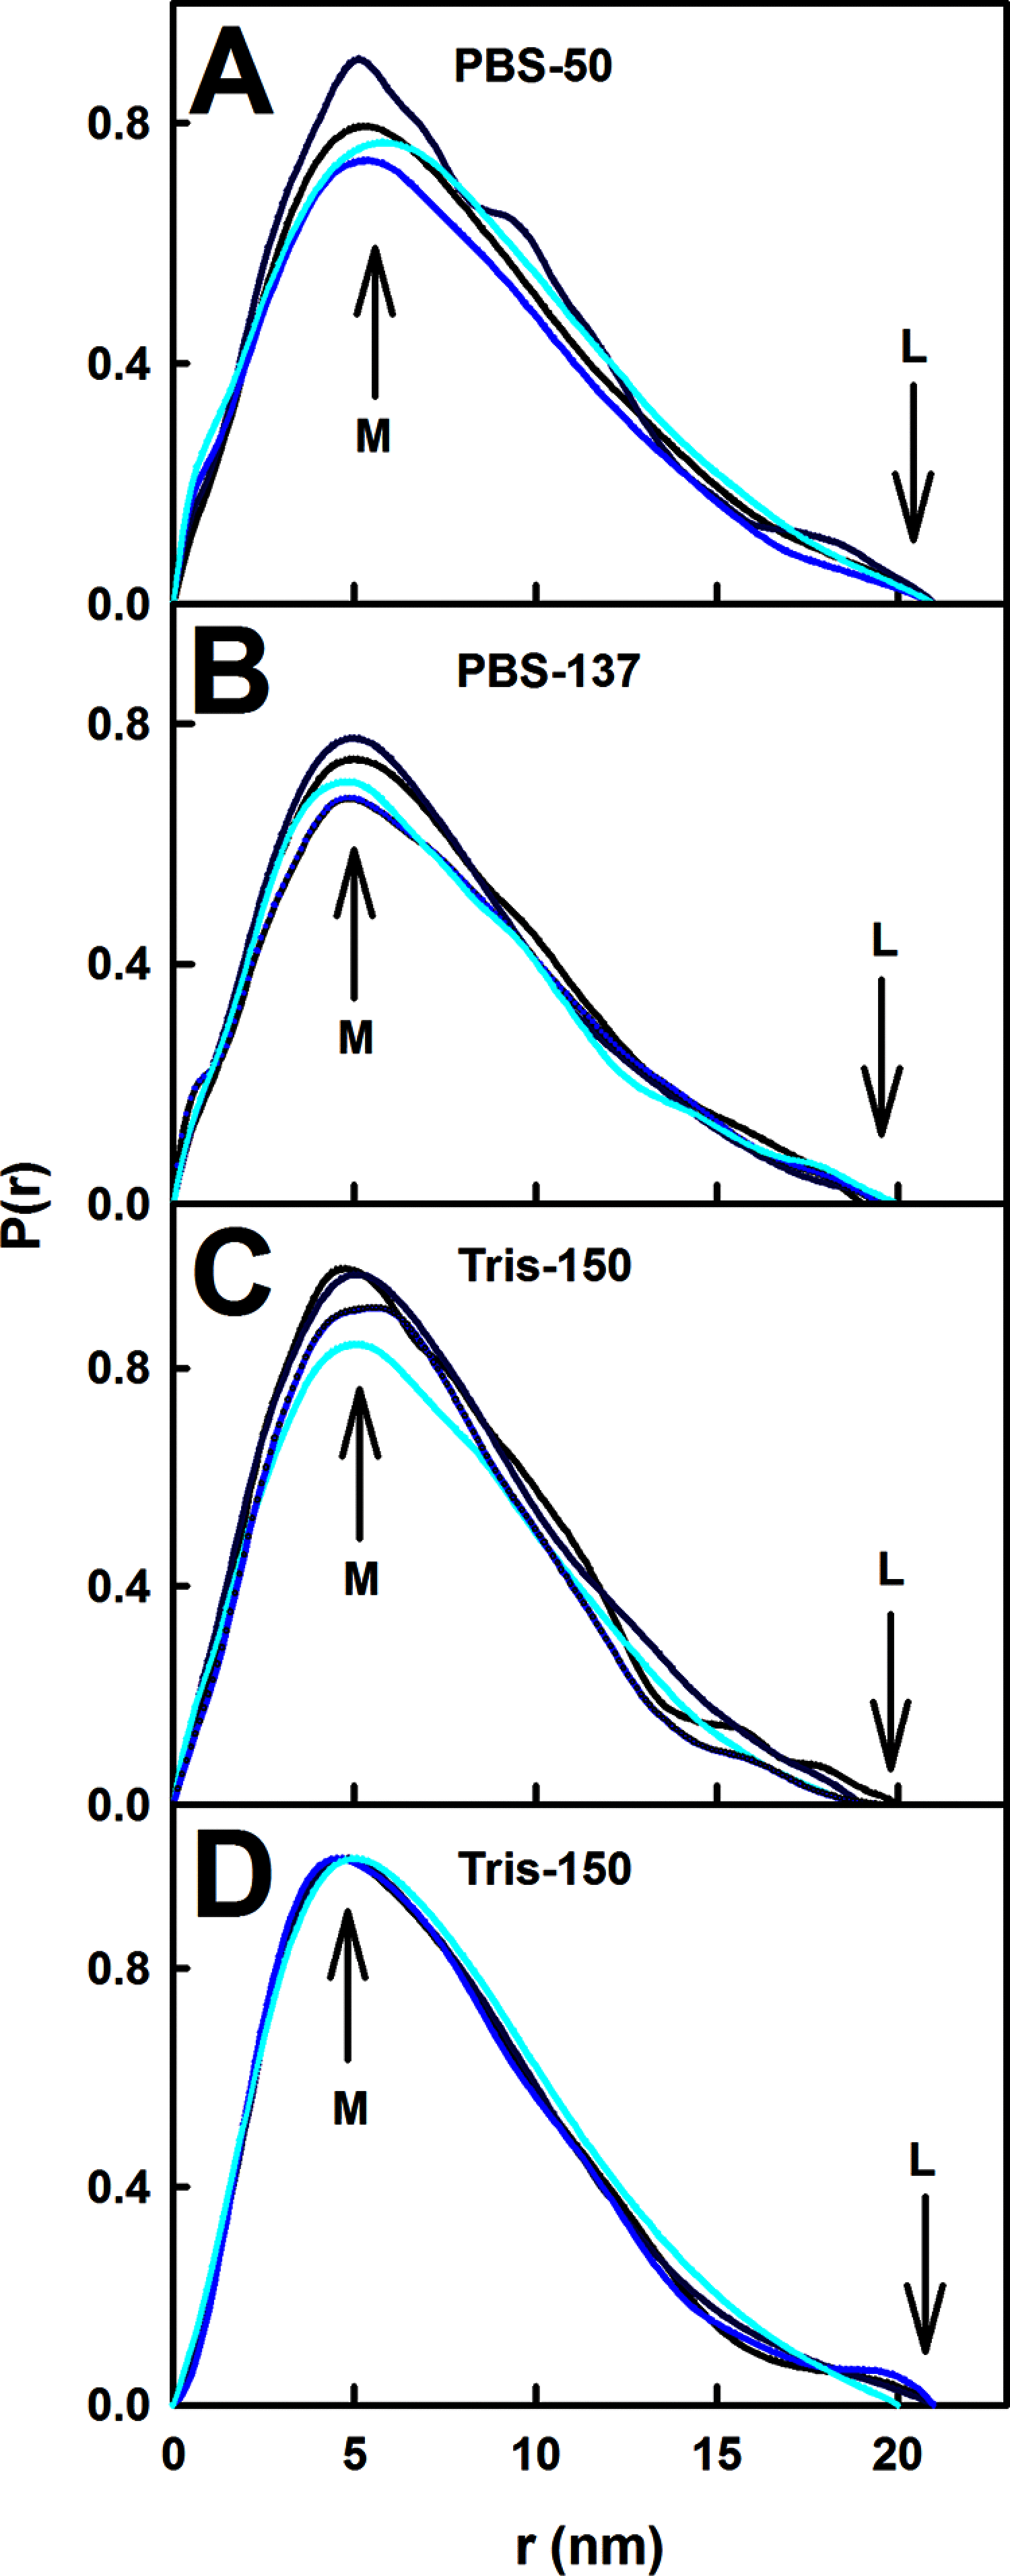
X-ray distance distribution P(r) analyses for FHR5. The P(r) curves for FHR5 in A–D correspond to those shown in Fig. 6. In each panel, the P(r) curves were normalized for concentration and colored according to the FHR5 concentration from light blue at the lowest concentration to dark blue at the highest concentration. The maximum M depicts the most commonly occurring distances within the FHR5 structure. The length of FHR5 is signified by L at the r value where P(r) reaches zero.
Figure 9.
Figure 9.
Density plot of the conformationally varied FHR5 structures. The linear dimeric FHR5 starting structure is shown at the center in blue and red for the two monomers, with the SCR-1/2 dimer at the center of this. The grid shows the complete spatial extent covered by the 72,755 modeled conformations of Search 2 for each FHR5 monomer (Table 3), shown in blue and red.
Figure 10.
Figure 10.
R-factor analyses for the atomistic modeling of FHR5 dimers. The goodness-of-fit R-factors are compared with the calculated Rg values for the 86,732, 72,755, and 123,776 conformationally randomized FHR5 dimer models from three different Monte Carlo searches. The yellow circles denote the models in each search. The experimental Rg values are shown by the solid vertical lines with Rg error ranges of ±5% represented by the dashed lines. The 28–749 best fit models for each search after filtering for the R-factor, Rg, and Rxs values are shown in green. The single best-fit model with the lowest R-factor at the minima (red arrow) is in red. A, the models were compared with data for 0.17 and 0.5 mg/ml FHR5 in Tris-150, varying linkers 2–8 (Search 1). B, the models were compared with the same two data sets, but varying linkers 2, 4, 6, and 7 (Search 2). C, the models were compared with the same two data sets, but varying linkers 3 and 6 (Search 3).
Figure 11.
Figure 11.
X-ray scattering curve fits for best-fit FHR5 models. The best fits correspond to the models with the lowest R-factor (red in Fig. 9). The experimental data at 0.17 mg/ml (top panels) and 0.50 mg/ml (bottom panels) are indicated by circles, overlaid with the modeled scattering curve (blue line). The insets show the experimental (black) and modeled (blue) P(r) curves. A, B, and C show the best fit from Search 1, 2, and 3, respectively (Table 3).
Figure 12.
Figure 12.
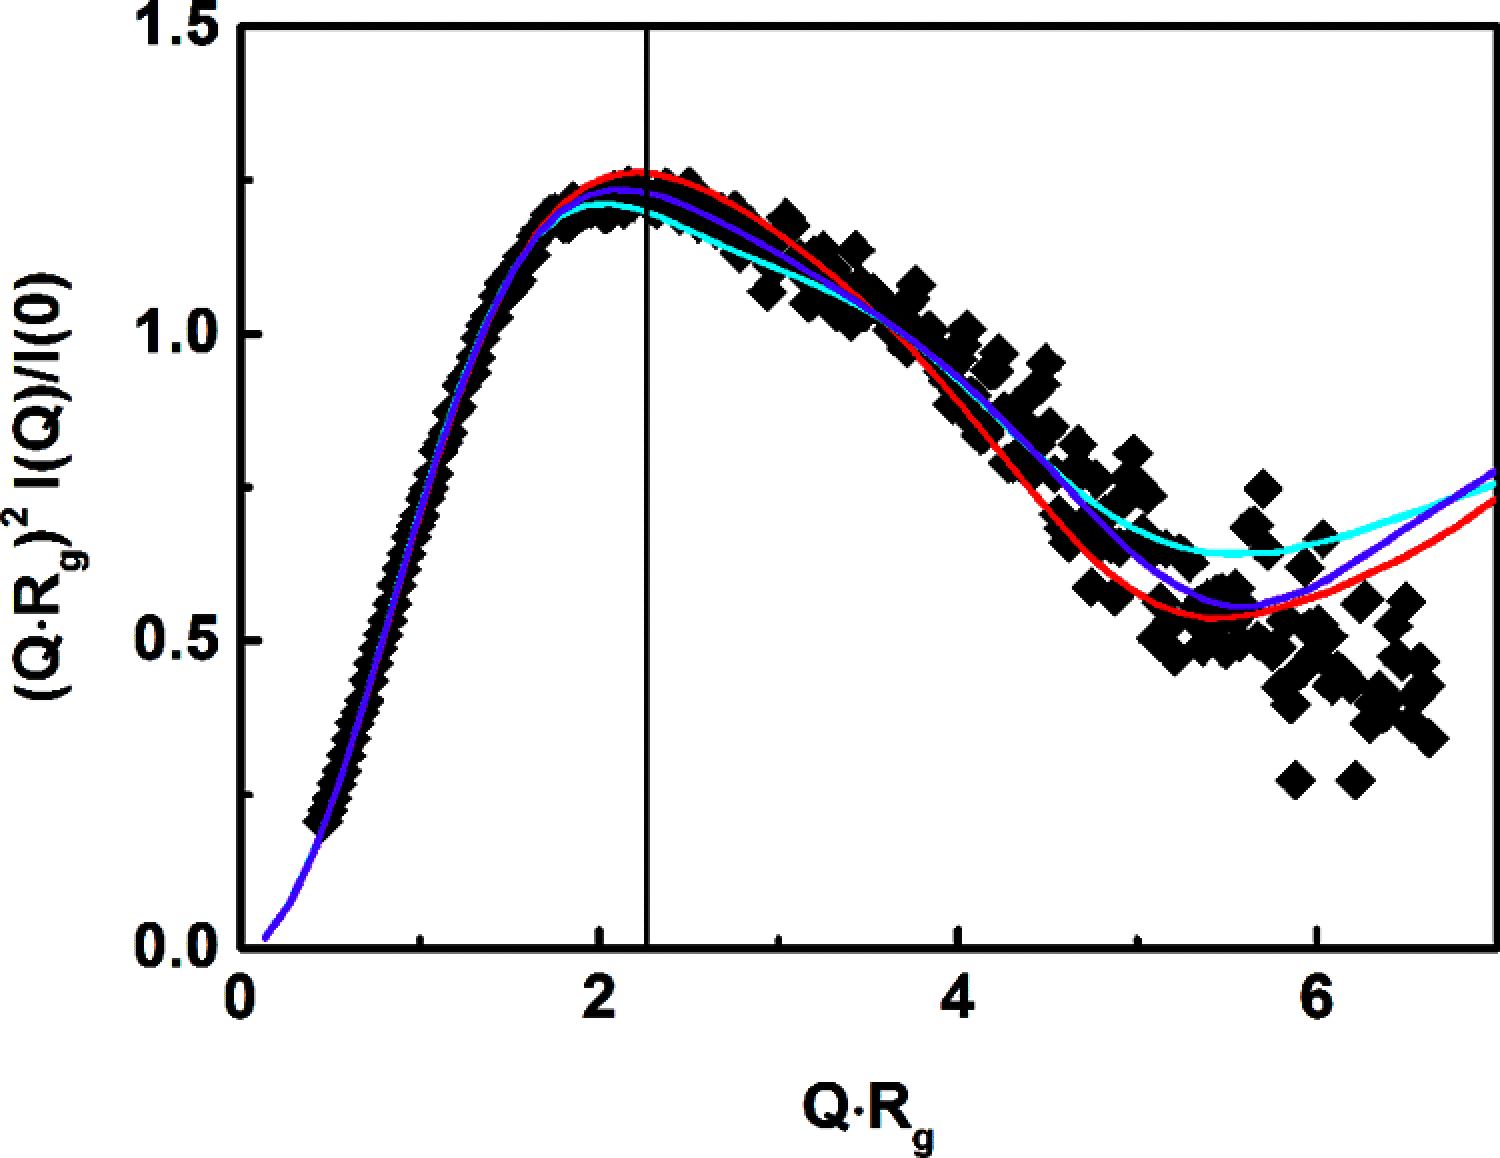
Normalized dimensionless Kratky plots of the best-fit curves of FHR5 models. The experimental data for 0.5 mg/ml FHR5 in Tris-150 are denoted by diamonds. The modeled curves for 0.5 mg/ml in Tris-150 according to Search 1, Search 2, and Search 3 are shown in red, cyan, and purple, respectively. The vertical solid line denotes the maximum of the Kratky plot.
Figure 13.
Figure 13.
Principal component analyses of the FHR5 best-fit models from Search 2. The 55 best-fit models (Table 3) were grouped by principal component analysis into five groups, of which three groups were predominant in terms of the number of 48 models they contained. These are shown as PC1, PC2, and PC3 (black, 19 models; red, 16 models; green, 13 models) and exemplified by the first three principal components (PC2 versus PC1 and PC3 versus PC2).
Figure 14.
Figure 14.
The three best-fit FHR5 models, their interaction with C3d, and mutant FHR5. A–C, ribbon views of single FHR5 models, these being representative of the three principal component analysis (PCA) groups determined from Search 2 (Table 3). The models correspond to the X-ray curve fits in Fig. 11B. The two monomers are shown in red and blue, with the N-terminal SCR-1/2 dimer pair denoted by N and shown in cyan and orange. The C-terminal SCR-9 domains are denoted by C. To their right are shown surface views of two C3d molecules bound to the two SCR-9 domains in the FHR5 dimer shown in the same orientation. If binding is sterically allowed, the C3d surface is shown in green; if this is sterically blocked, this is grayed out. D, the two best fit structures (to the same scale) of the X-ray scattering models of glycosylated Factor H are shown. Purple denotes the eight N-glycan chains in Factor H. E, the mutant FHR5 dimer structure was generated from the best-fit structure from Search 2 (Table 3) by the addition of two extra SCR domain pairs to represent the mutant. The native SCR-1/2 pair is shown in black and blue at the center, with the extra SCR-1/2 pair shown in red at the two N termini of the native SCR-1/2 pair. F, the putative daisy-chaining of mutant FHR5 dimers to form a tetramer. Pairs of mutant SCR-1/2 domains are formed based on the crystal structure of this dimer. Such a tetramer can be extended to form hexamers and larger oligomers, with chain extension limited by binding of a WT FHR5 molecule.

References

    1. Murphy B., Georgiou T., Machet D., Hill P., and McRae J. (2002) Factor H-related protein-5: a novel component of human glomerular immune deposits. Am. J. Kidney Dis. 39, 24–27 10.1053/ajkd.2002.29873 - DOI - PubMed
    1. McRae J. L., Duthy T. G., Griggs K. M., Ormsby R. J., Cowan P. J., Cromer B. A., McKinstry W. J., Parker M. W., Murphy B. F., and Gordon D. L. (2005) Human factor H-related protein 5 has cofactor activity, inhibits C3 convertase activity, binds heparin and C-reactive protein, and associates with lipoprotein. J. Immunol. 174, 6250–6256 10.4049/jimmunol.174.10.6250 - DOI - PubMed
    1. Soares D., and Barlow P. N. (2005) Complement control protein modules in the regulators of complement activators. In Structural Biology of the Complement System (Morikis D., and Lambris J. D., eds) pp. 19–62, Taylor & Francis, Boca Raton, FL
    1. Goicoechea de Jorge E., Caesar J. J., Malik T. H., Patel M., Colledge M., Johnson S., Hakobyan S., Morgan B. P., Harris C. L., Pickering M. C., and Lea S. M. (2013) Dimerization of complement factor H-related proteins modulates complement activation in vivo. Proc. Natl. Acad. Sci. U. S. A. 110, 4685–4690 10.1073/pnas.1219260110 - DOI - PMC - PubMed
    1. Jokiranta T. S., Jaakola V. P., Lehtinen M. J., Pärepalo M., Meri S., and Goldman A. (2006) Structure of complement factor H carboxyl-terminus reveals molecular basis of atypical haemolytic uremic syndrome. EMBO J., 25, 1784–1794 10.1038/sj.emboj.7601052 - DOI - PMC - PubMed

Publication types