. 2020 Sep 29;117(39):24061-24068.
doi: 10.1073/pnas.2000098117. Epub 2020 Sep 14.

Exploring the landscape of model representations

Affiliations

Exploring the landscape of model representations

Thomas T Foley et al. Proc Natl Acad Sci U S A. .

Abstract

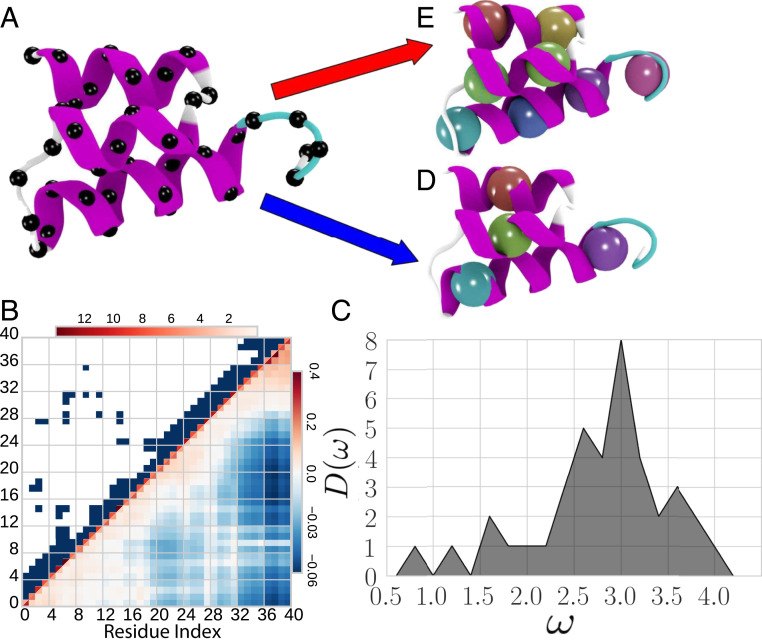
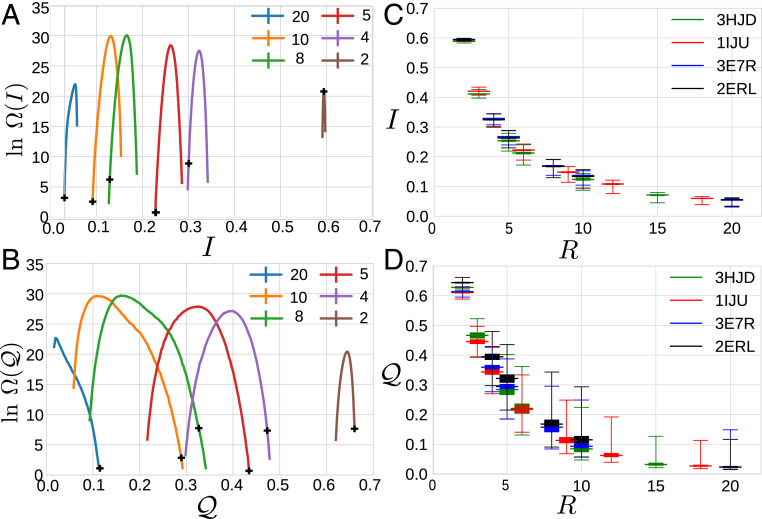
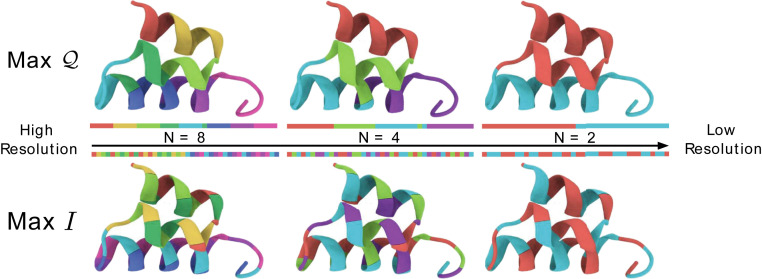
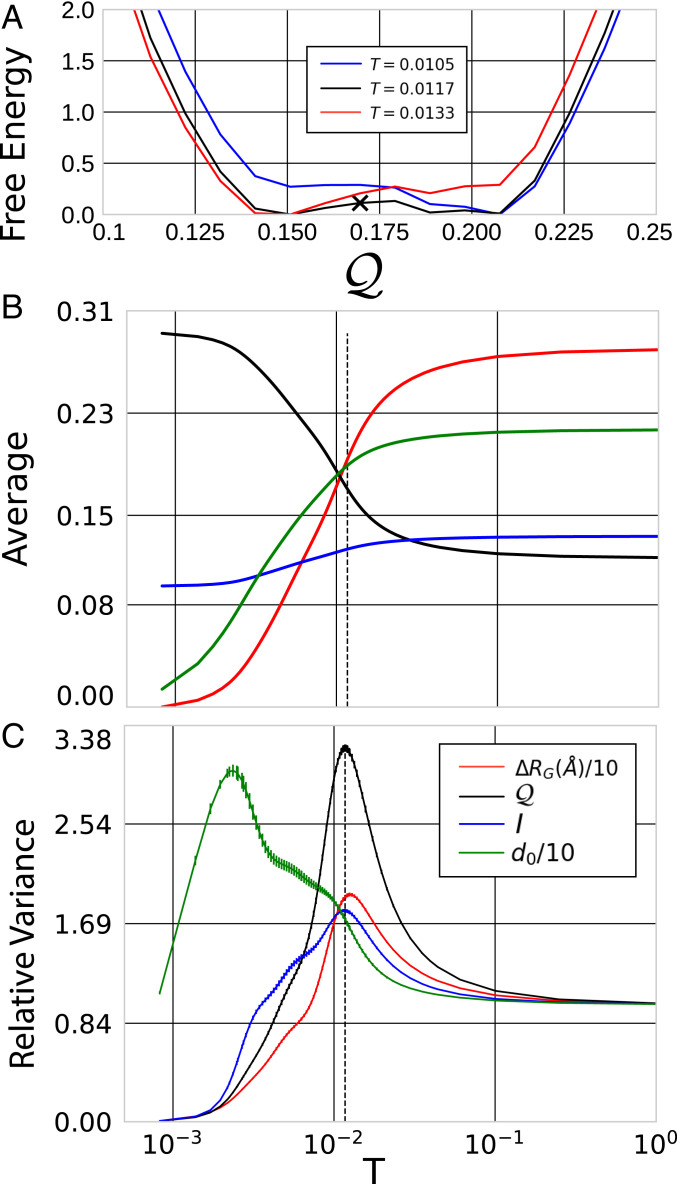
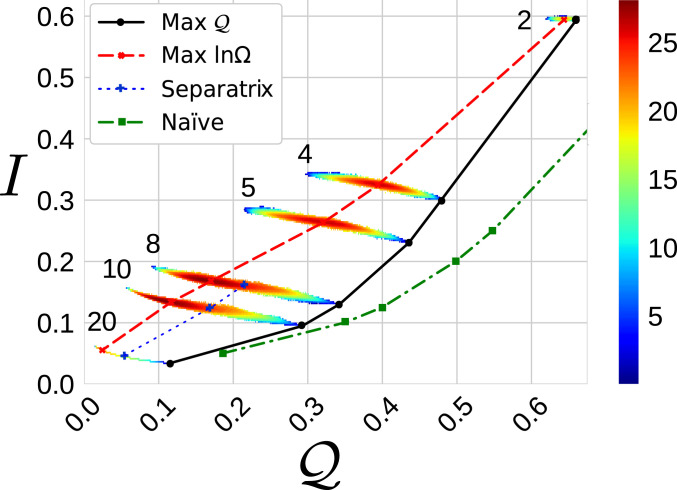
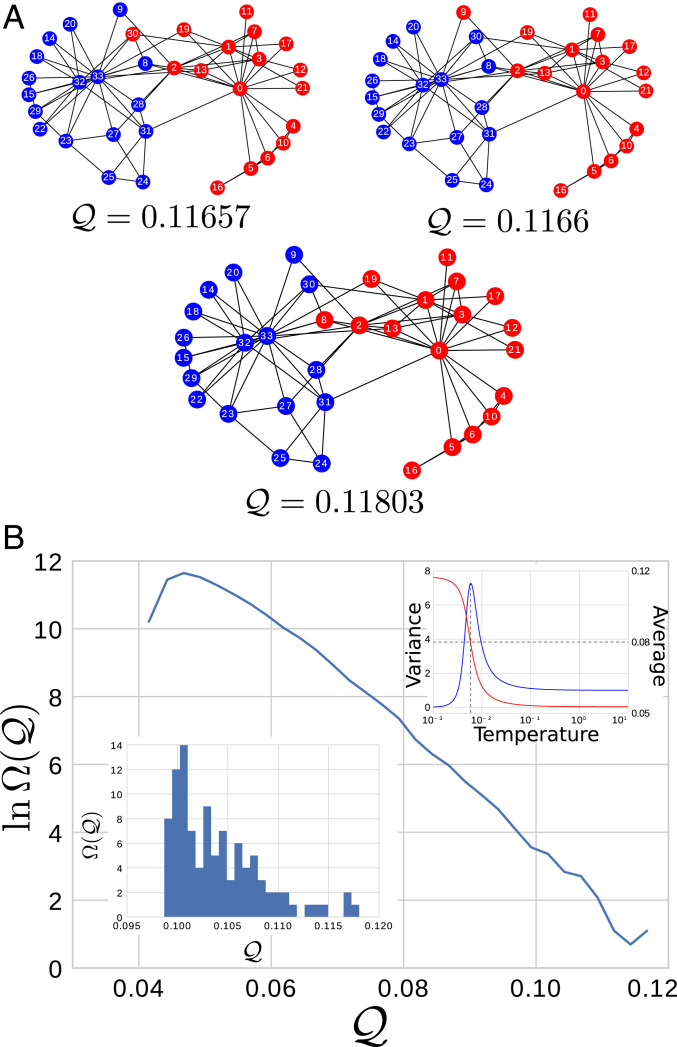
The success of any physical model critically depends upon adopting an appropriate representation for the phenomenon of interest. Unfortunately, it remains generally challenging to identify the essential degrees of freedom or, equivalently, the proper order parameters for describing complex phenomena. Here we develop a statistical physics framework for exploring and quantitatively characterizing the space of order parameters for representing physical systems. Specifically, we examine the space of low-resolution representations that correspond to particle-based coarse-grained (CG) models for a simple microscopic model of protein fluctuations. We employ Monte Carlo (MC) methods to sample this space and determine the density of states for CG representations as a function of their ability to preserve the configurational information, I, and large-scale fluctuations, Q, of the microscopic model. These two metrics are uncorrelated in high-resolution representations but become anticorrelated at lower resolutions. Moreover, our MC simulations suggest an emergent length scale for coarse-graining proteins, as well as a qualitative distinction between good and bad representations of proteins. Finally, we relate our work to recent approaches for clustering graphs and detecting communities in networks.

Keywords: entropy; information theory; multiscale modeling; networks; proteins.


Conflict of interest statement

The authors declare no competing interest.

Figures

Fig. 1.
Fig. 1.
Characterization of the model protein 2ERL. (A) Cartoon representation of the equilibrium folded structure with black spheres indicating α carbons. (B) Intensity plots of the upper and lower halves of the symmetric connectivity, κ, and covariance, cκ1, matrices. (C) Vibrational densities of states for the high resolution GNM of 2ERL. (D and E) CG representations with spheres representing the location of the CG sites for block maps with N = 4 and 8 sites, respectively. Figure employed VMD (66).
Fig. 2.
Fig. 2.
Statistical analysis of mapping space. (A and B) The natural logarithm of the density of states, lnΩ, quantifying the number of maps, M, with given information content, I, or spectral quality, Q, for 2ERL at varying degrees of coarsening, R=n/N, indicated by the colors of the legend. The black crosses indicate I and Q for the block map at each resolution. (C and D) Box plots indicating the mean (widest bar), extrema (top and bottom bars), and the 25 and 75% quantiles (shaded box) characterizing these densities of states for 2ERL (black) and for three other small proteins.
Fig. 3.
Fig. 3.
Maps that maximize Q (Top) and I (Bottom) among maps with N = 8, 4, or 2 sites. The ribbon and line diagrams are colored to indicate the atoms that are grouped together in the three-dimensional structure and in the one-dimensional amino acid sequence, respectively. Figure employed VMD (66).
Fig. 4.
Fig. 4.
Characterization of the apparent transition for N=4 site representations of 2ERL. (A) The dimensionless free energy, βQF, at the transition temperature (black) and at temperatures above (red) and below (blue) the transition. The black X indicates the separatrix, Q*, for which P(Q<Q*)=1/2 at the transition temperature. (B and C) The averages and variances, respectively, for several metrics. The metric d0(M) quantifies the difference in the atomic groups defined by the map, M, and the ground state map, M0, while RG(M) quantifies the compactness of the associated atomic groups. For convenience, we have shifted RG such that ΔRG(M) vanishes as TQ0 and have normalized variances relative to their TQ limit. Error bars estimate statistical uncertainty. The dashed vertical line indicates the transition temperature, which is defined by the variance peak in Q. T denotes the fictitious temperature, TQ, conjugate to E(M) = 1- Q(M).
Fig. 5.
Fig. 5.
Global perspective on mapping space for 2ERL. The heat map colors indicate the magnitude of the 2D ln densities of states, lnΩ(Q,I), for CG maps with resolutions R = 2, 4, 5, 8, 10, and 20. The dashed red and solid black curves indicate the maxima of lnΩ and Q, respectively, at each resolution. The dashed-dotted green curve presents a naïve estimate of the expected information content at each resolution, i.e., N/n, and the optimal spectral quality, QN;max, which corresponds to reproducing perfectly the N1 lowest vibrational frequencies of the high-resolution model. The dotted blue curve and crosses indicate the separatrices of transitions that are observed at sufficiently low resolutions.
Fig. 6.
Fig. 6.
Coarse-graining the GNM defined by Zachary’s karate club network. (A) The N=2 CG map with optimal spectral quality (Q2;max = 0.11803), as well as the first two excited states with slightly lower spectral quality. (B) lnΩ(Q). (Lower Left Inset) The spectra for the first 100 maps. (Upper Right Inset) As a function of conjugate temperature, the average spectral quality (red curve, right scale) and the corresponding variance (blue curve, left scale), which has been normalized relative to its βQ0 limit. The vertical line in Upper Right Inset indicates the transition temperature, while the horizontal line indicates the corresponding mean.

References

    1. Goldenfeld N., Kadanoff L. P., Simple lessons from complexity. Science 284, 87–89 (1999). - PubMed
    1. Callen H. B., Thermodynamics and an Introduction to Thermostatistics (Wiley, 1985).
    1. Levitt M., Warshel A., Computer simulation of protein folding. Nature 253, 694–698 (1975). - PubMed
    1. Peter C., Kremer K., Multiscale simulation of soft matter systems. Faraday Discuss. 144, 9–24 (2010). - PubMed
    1. Noid W. G., Perspective: Coarse-grained models for biomolecular systems. J. Chem. Phys. 139, 090901 (2013). - PubMed

Publication types