. 2020 Sep 29;117(39):24567-24574.
doi: 10.1073/pnas.2004468117. Epub 2020 Sep 14.

Estimation of Rift Valley fever virus spillover to humans during the Mayotte 2018-2019 epidemic

Affiliations

Estimation of Rift Valley fever virus spillover to humans during the Mayotte 2018-2019 epidemic

Raphaëlle Métras et al. Proc Natl Acad Sci U S A. .

Abstract

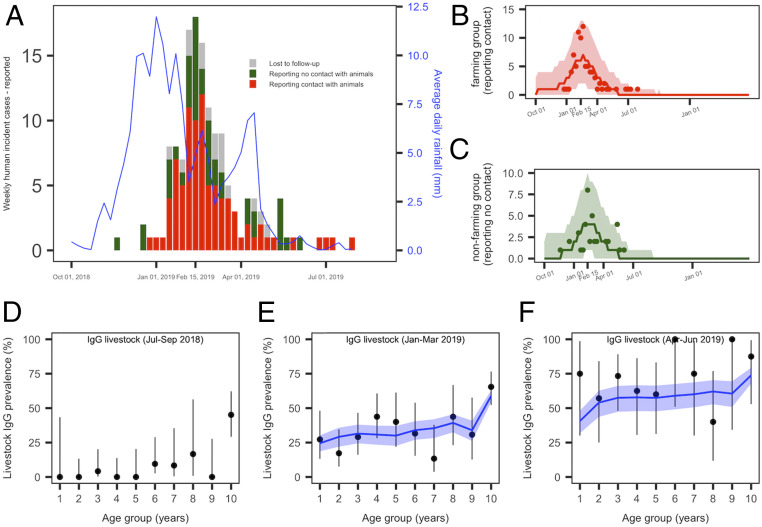
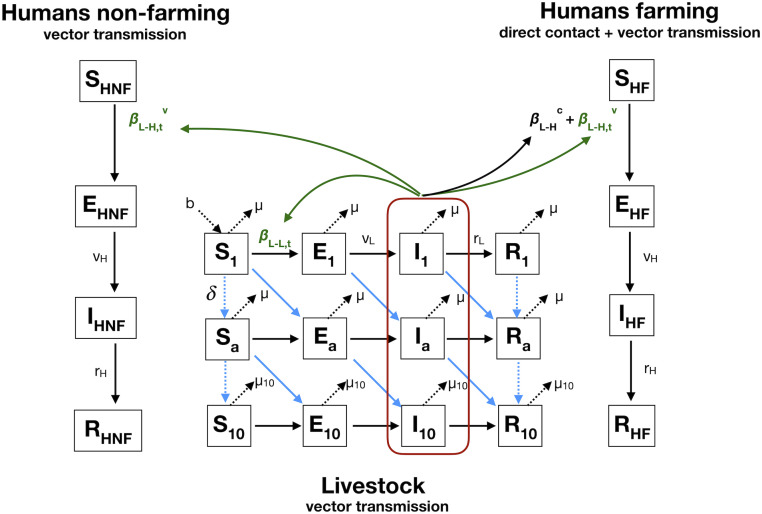
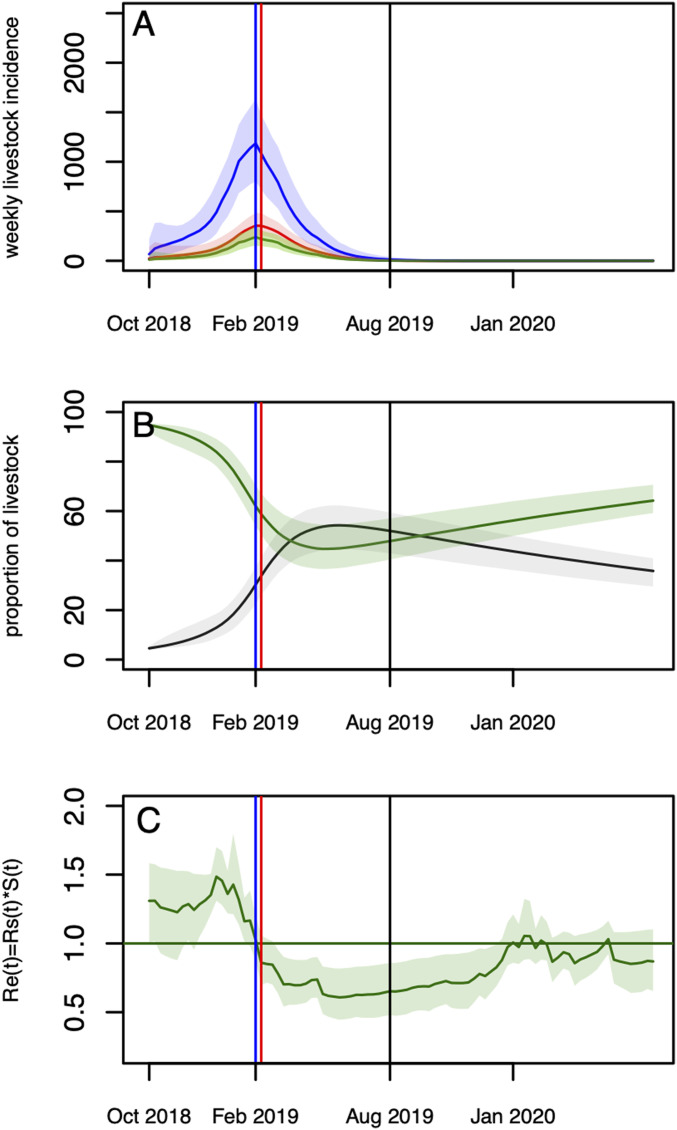
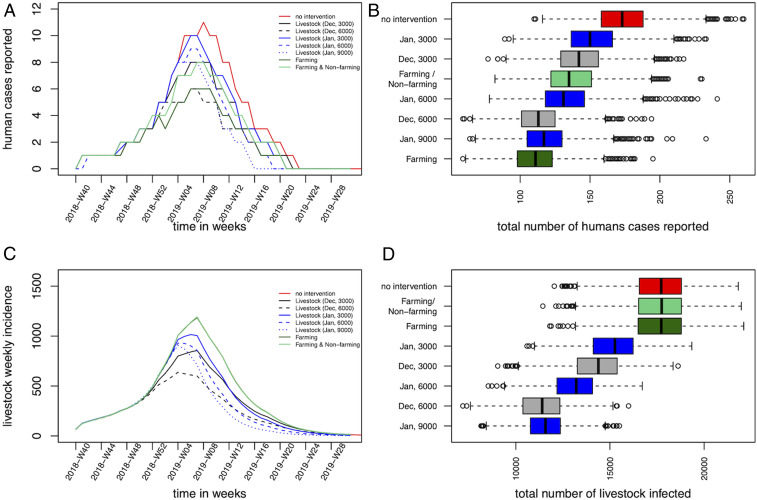
Rift Valley fever (RVF) is an emerging, zoonotic, arboviral hemorrhagic fever threatening livestock and humans mainly in Africa. RVF is of global concern, having expanded its geographical range over the last decades. The impact of control measures on epidemic dynamics using empirical data has not been assessed. Here, we fitted a mathematical model to seroprevalence livestock and human RVF case data from the 2018-2019 epidemic in Mayotte to estimate viral transmission among livestock, and spillover from livestock to humans through both direct contact and vector-mediated routes. Model simulations were used to assess the impact of vaccination on reducing the epidemic size. The rate of spillover by direct contact was about twice as high as vector transmission. Assuming 30% of the population were farmers, each transmission route contributed to 45% and 55% of the number of human infections, respectively. Reactive vaccination immunizing 20% of the livestock population reduced the number of human cases by 30%. Vaccinating 1 mo later required using 50% more vaccine doses for a similar reduction. Vaccinating only farmers required 10 times as more vaccine doses for a similar reduction in human cases. Finally, with 52.0% (95% credible interval [CrI] [42.9-59.4]) of livestock immune at the end of the epidemic wave, viral reemergence in the next rainy season (2019-2020) is unlikely. Coordinated human and animal health surveillance, and timely livestock vaccination appear to be key to controlling RVF in this setting. We furthermore demonstrate the value of a One Health quantitative approach to surveillance and control of zoonotic infectious diseases.

Keywords: One Health; Rift Valley fever; epidemics; modeling; spillover.


Conflict of interest statement

The authors declare no competing interest.

Figures

Fig. 1.
Fig. 1.
(A and F) RVF epidemic data in humans and livestock, and model fit (base case). (A) Weekly number of reported human cases and average daily rainfall pattern (solid blue line). Human cases reporting a direct contact with animals or their products are presented in red (86 cases), those reporting no prior contact with animals or their products are in green (41 cases), and lost to follow-up are in gray (16 cases). (B) Predicted median (red solid line) and 95% CrI (red envelope) of the number of weekly reported human cases in the farming group, and weekly incident observed cases (red dots). (C) Predicted median (green solid line) and 95% CrI (green envelope) of the number of weekly reported human cases in the nonfarming group, and weekly incident observed cases with no prior contact with animals (green dots). (D) Quarterly age-stratified RVF IgG seroprevalence in livestock for the trimesters July to September 2018 (n = 173), (E) January to March 2019 (n = 252), and (F) April to June 2019 (n = 67). In D–F, the black dots and vertical black lines represent the observed age-stratified average IgG seroprevalence and their 95% CI. The model predicted values are showed by the median (solid blue line) and 95% CrI (blue envelopes).
Fig. 2.
Fig. 2.
Model diagram. The livestock population is stratified in 10 yearly age groups. Humans are exposed to RVFV through infectious livestock. The farming population can get infected by direct contact or vector transmission, and the nonfarming population acquires infection only by vector-mediated transmission. Notations, equations, and assumptions on viral transmission are presented in SI Appendix, Methods and Tables S1 and S2.
Fig. 3.
Fig. 3.
(A and C) Model predictions over two rainy seasons (2018–2019 and 2019–2020). (A) Predicted (reported and unreported) number of infectious livestock (blue) and humans by direct contact (red), and vector-mediated route (green). (B) Predicted median (solid lines) and 95% CrI envelopes of the predicted proportion of susceptible (green) and immune (black) livestock over the course of the epidemic. (C) Values of Re,t = Rs,t*St over the course of the epidemic. In all panels, the vertical blue line corresponds to the predicted epidemic peak in livestock (1,186 infections) and nonfarmers (240 infections) (February 11–17). The highest incidence in the farming group is estimated to be February 11–17 and February 18–24 (354 and 353 infections, respectively); the second of these weeks is represented with the red line. The vertical black line corresponds to the end of the fitting period (August 2019).
Fig. 4.
Fig. 4.
(A and D) Impact of vaccination strategies on the epidemic size. (A) Median weekly number of predicted reported incident human cases, and corresponding (B) final human epidemic size (reported cases). (C) Median weekly number of predicted incident infected livestock, and corresponding (D) total livestock epidemic size. In A and C, the red solid line presents the scenario with no intervention (scenario 1); the black lines present vaccinations in December 2018 (black solid, 3,000 doses; dashed black, 6,000 doses) (scenarios 2 and 3); the blue lines present the vaccinations in January 2019 (blue solid, 3,000 doses; dashed blue, 6,000 doses; dotted blue, 9,000 doses) (scenarios 4–6); the dark green and the light green lines represent the vaccination of farmers (scenario 7), and the vaccination of the two groups (scenario 8), respectively. Note that, in C, the curves representing the incident livestock cases for no intervention and the vaccination scenarios targeting humans overlap.

References

    1. Woolhouse M. E. J., Dye C., Population biology of emerging and re-emerging pathogens—preface. Philos. Trans. R. Soc. Lond. Ser. B. 356, 981–982 (2001).
    1. Jones B. A. et al. ., Zoonosis emergence linked to agricultural intensification and environmental change. Proc. Natl. Acad. Sci. U.S.A. 110, 8399–8404 (2013). - PMC - PubMed
    1. Clark M. H. A., Warimwe G. M., Di Nardo A., Lyons N. A., Gubbins S., Systematic literature review of Rift Valley fever virus seroprevalence in livestock, wildlife and humans in Africa from 1968 to 2016. PLoS Negl. Trop. Dis. 12, e0006627 (2018). - PMC - PubMed
    1. Bird B. H., Ksiazek T. G., Nichol S. T., Maclachlan N. J., Rift Valley fever virus. J. Am. Vet. Med. Assoc. 234, 883–893 (2009). - PubMed
    1. Nanyingi M. O. et al. ., A systematic review of Rift Valley fever epidemiology 1931–2014. Infect. Ecol. Epidemiol. 5, 28024 (2015). - PMC - PubMed

Publication types

MeSH terms