

Thermodynamic and kinetic design principles for amyloid-aggregation inhibitors
- PMID: 32929030
- PMCID: PMC7533883
- DOI: 10.1073/pnas.2006684117
Thermodynamic and kinetic design principles for amyloid-aggregation inhibitors
Abstract
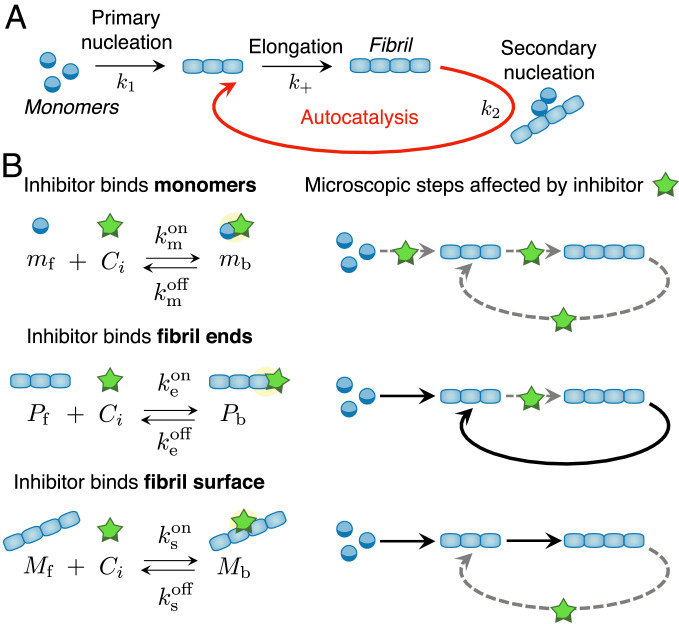
Understanding the mechanism of action of compounds capable of inhibiting amyloid-fibril formation is critical to the development of potential therapeutics against protein-misfolding diseases. A fundamental challenge for progress is the range of possible target species and the disparate timescales involved, since the aggregating proteins are simultaneously the reactants, products, intermediates, and catalysts of the reaction. It is a complex problem, therefore, to choose the states of the aggregating proteins that should be bound by the compounds to achieve the most potent inhibition. We present here a comprehensive kinetic theory of amyloid-aggregation inhibition that reveals the fundamental thermodynamic and kinetic signatures characterizing effective inhibitors by identifying quantitative relationships between the aggregation and binding rate constants. These results provide general physical laws to guide the design and optimization of inhibitors of amyloid-fibril formation, revealing in particular the important role of on-rates in the binding of the inhibitors.
Keywords: amyloid; drug discovery; inhibition; mathematical model; molecular mechanism.
Conflict of interest statement
The authors declare no competing interest.
Figures
Similar articles
-
Pathways of amyloid fibril formation and protein aggregation.Prog Mol Biol Transl Sci. 2024;206:11-54. doi: 10.1016/bs.pmbts.2024.03.010. Epub 2024 Apr 15. Prog Mol Biol Transl Sci. 2024. PMID: 38811078 Review.
-
Assembly Mechanism for Aggregation of Amyloid Fibrils.Int J Mol Sci. 2018 Jul 23;19(7):2141. doi: 10.3390/ijms19072141. Int J Mol Sci. 2018. PMID: 30041455 Free PMC article.
-
Structure and intermolecular dynamics of aggregates populated during amyloid fibril formation studied by hydrogen/deuterium exchange.Acc Chem Res. 2010 Aug 17;43(8):1072-9. doi: 10.1021/ar9002784. Acc Chem Res. 2010. PMID: 20557067
-
Structure and Aggregation Mechanisms in Amyloids.Molecules. 2020 Mar 6;25(5):1195. doi: 10.3390/molecules25051195. Molecules. 2020. PMID: 32155822 Free PMC article. Review.
-
Molecular Mechanisms of Inhibition of Protein Amyloid Fibril Formation: Evidence and Perspectives Based on Kinetic Models.Int J Mol Sci. 2022 Nov 3;23(21):13428. doi: 10.3390/ijms232113428. Int J Mol Sci. 2022. PMID: 36362217 Free PMC article. Review.
Cited by
-
Photocontrol of the β-Hairpin Polypeptide Structure through an Optimized Azobenzene-Based Amino Acid Analogue.J Am Chem Soc. 2024 Jan 24;146(3):2062-2071. doi: 10.1021/jacs.3c11155. Epub 2024 Jan 16. J Am Chem Soc. 2024. PMID: 38226790 Free PMC article.
-
Proteomic Evidence for Amyloidogenic Cross-Seeding in Fibrinaloid Microclots.Int J Mol Sci. 2024 Oct 8;25(19):10809. doi: 10.3390/ijms251910809. Int J Mol Sci. 2024. PMID: 39409138 Free PMC article.
-
O-GlcNAc Modification of α-Synuclein Can Alter Monomer Dynamics to Control Aggregation Kinetics.ACS Chem Neurosci. 2024 Aug 21;15(16):3044-3052. doi: 10.1021/acschemneuro.4c00301. Epub 2024 Jul 31. ACS Chem Neurosci. 2024. PMID: 39082221 Free PMC article.
-
Influence of Amino Acid Substitutions in ApoMb on Different Stages of Unfolding of Amyloids.Molecules. 2023 Nov 23;28(23):7736. doi: 10.3390/molecules28237736. Molecules. 2023. PMID: 38067466 Free PMC article.
-
COVID-19: insights into virus-receptor interactions.Mol Biomed. 2021;2(1):10. doi: 10.1186/s43556-021-00033-4. Epub 2021 Apr 10. Mol Biomed. 2021. PMID: 34766003 Free PMC article.
References
-
- Dobson C. M., Protein folding and misfolding. Nature 426, 884–890 (2003). - PubMed
-
- Knowles T. P. J., Vendruscolo M., Dobson C. M., The amyloid state and its association with protein misfolding diseases. Nat. Rev. Mol. Cell Biol. 15, 384–396 (2014). - PubMed
-
- Chiti F., Dobson C. M., Protein misfolding, amyloid formation, and human disease: A summary of progress over the last decade. Annu. Rev. Biochem. 86, 27–68 (2017). - PubMed
Publication types
MeSH terms
Substances
Grants and funding
LinkOut - more resources
Full Text Sources
Other Literature Sources
