. 2020 Sep 14;10(1):15057.
doi: 10.1038/s41598-020-71895-x.

Validation of reference genes for expression analysis in a murine trauma model combining traumatic brain injury and femoral fracture

Affiliations

Validation of reference genes for expression analysis in a murine trauma model combining traumatic brain injury and femoral fracture

Ellen Otto et al. Sci Rep. .

Abstract

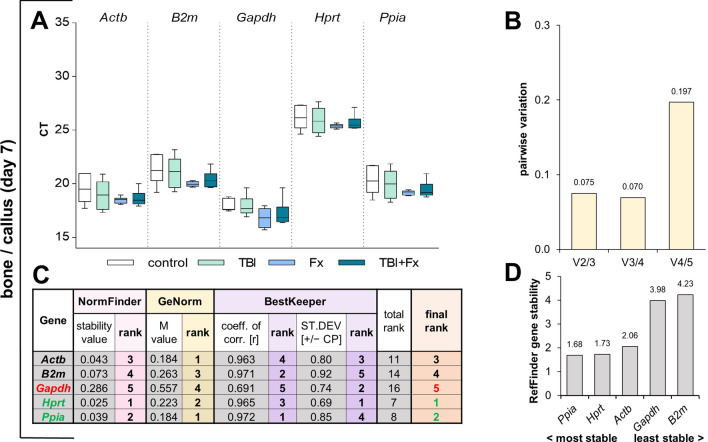
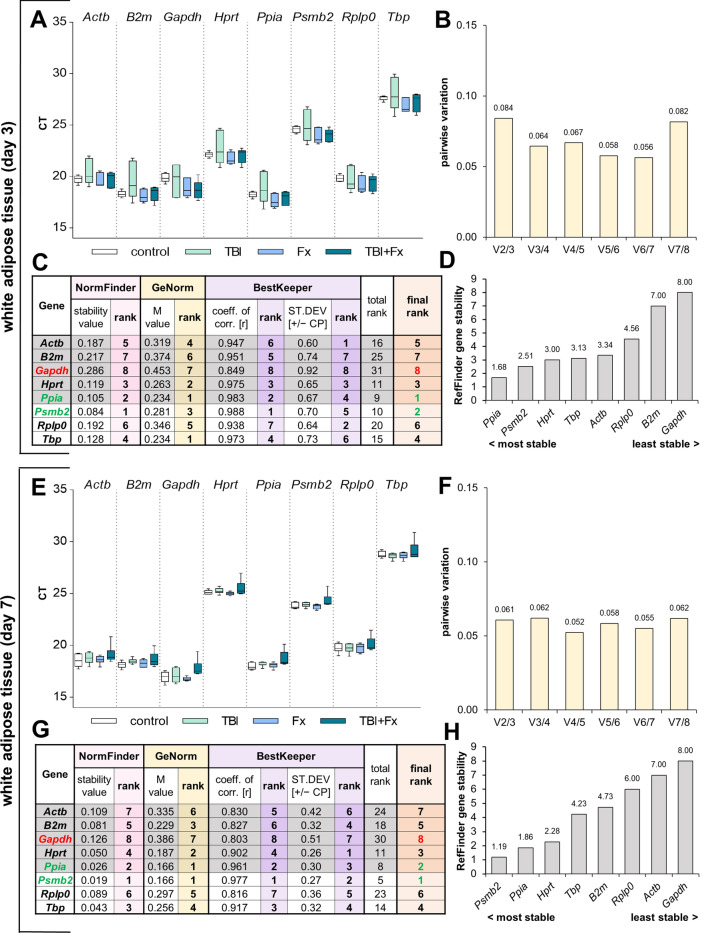
Systemic and local posttraumatic responses are often monitored on mRNA expression level using quantitative real-time PCR (qRT-PCR), which requires normalisation to adjust for confounding sources of variability. Normalisation requests reference (housekeeping) genes stable throughout time and divergent experimental conditions in the tissue of interest, which are crucial for a reliable and reproducible gene expression analysis. Although previous animal studies analysed reference genes following isolated trauma, this multiple-trauma gene expression analysis provides a notable study analysing reference genes in primarily affected (i.e. bone/fracture callus and hypothalamus) and secondarily affected organs (i.e. white adipose tissue, liver, muscle and spleen), following experimental long bone fracture and traumatic brain injury. We considered tissue-specific and commonly used top-ranked reference candidates from different functional groups that were evaluated applying the established expression stability analysis tools NormFinder, GeNorm, BestKeeper and RefFinder. In conclusion, reference gene expression in primary organs is highly time point as well as tissue-specific, and therefore requires careful evaluation for qRT-PCR analysis. Furthermore, the general application of Ppia, particularly in combination with a second reference gene, is strongly recommended for the analysis of systemic effects in the case of indirect trauma affecting secondary organs through local and systemic pathophysiological responses.


Conflict of interest statement

The authors declare no competing interests.

Figures

Figure 1
Figure 1
Reference gene expression stability analysis in bone/callus tissue at 3 days following surgery. (A) Distribution of threshold cycle (Ct) values for each group (Fx = fracture; TBI = traumatic brain injury; TBI + Fx = combined injury) of all candidate reference genes tested. (B) Pairwise variation (Vn/n+1) analysis by GeNorm, to determine the optimal number of reference genes for normalisation. (C) Stability analysis by NormFinder (stability value: sv), GeNorm (M value) and BestKeeper (coefficient of correlation: r, standard deviation: SD), with a sum displayed in the final rank (green = most stable, red = least stable). (D) Overall expression stability confirmation of RefFinder, which combines NormFinder, GeNorm, BestKeeper and the comparative delta-Ct method. (E) inter- and intra-group variation calculated with NormFinder. (F/G) expression stability confirmation of RefFinder for intact bone (F) or callus tissue (G).
Figure 2
Figure 2
Reference gene expression stability analysis in bone/callus tissue at seven days following surgery. (A) Distribution of threshold cycle (Ct) values for each group (Fx = fracture; TBI = traumatic brain injury; TBI + Fx = combined injury) of all candidate reference genes tested. (B) Pairwise variation (Vn/n+1) analysis by GeNorm, to determine the optimal number of reference genes for normalisation. (C) Stability analysis by NormFinder (stability value: sv), GeNorm (M value) and BestKeeper (coefficient of correlation: r, standard deviation: SD), with a sum displayed in the final rank (green = most stable, red = least stable). (D) Overall expression stability confirmation of RefFinder, which combines NormFinder, GeNorm, BestKeeper and the comparative delta-Ct method.
Figure 3
Figure 3
Reference gene expression stability analysis in hypothalamus tissue at three days following surgery. (A) Distribution of threshold cycle (Ct) values for each group (Fx = fracture; TBI = traumatic brain injury; TBI + Fx = combined injury) of all candidate reference genes tested. (B) Pairwise variation (Vn/n+1) analysis by GeNorm, to determine the optimal number of reference genes for normalisation. (C) Stability analysis by NormFinder (stability value: sv), GeNorm (M value) and BestKeeper (coefficient of correlation: r, standard deviation: SD), with a sum displayed in the final rank (green = most stable, red = least stable). (D) Overall expression stability confirmation of RefFinder, which combines NormFinder, GeNorm, BestKeeper and the comparative delta-Ct method. (E) inter- and intra-group variation calculated with NormFinder. (F/G) expression stability confirmation of RefFinder for intact hypothalamus (F) or injured hypothalamus (G).
Figure 4
Figure 4
Reference gene expression stability analysis in hypothalamus tissue at seven days following surgery. (A) Distribution of threshold cycle (Ct) values for each group (Fx = fracture; TBI = traumatic brain injury; TBI + Fx = combined injury) of all candidate reference genes tested. (B) Pairwise variation (Vn/n+1) analysis by GeNorm, to determine the optimal number of reference genes for normalisation. (C) Stability analysis by NormFinder (stability value: sv), GeNorm (M value) and BestKeeper (coefficient of correlation: r, standard deviation: SD), with a sum displayed in the final rank (green = most stable, red = least stable). (D) Overall expression stability confirmation of RefFinder, which combines NormFinder, GeNorm, BestKeeper and the comparative delta-Ct method.
Figure 5
Figure 5
Reference gene expression stability analysis in white adipose tissue (WAT) at three (AD) and seven days (EH) following surgery. (A/E) Distribution of threshold cycle (Ct) values for each group (Fx = fracture; TBI = traumatic brain injury; TBI + Fx = combined injury) of all candidate reference genes tested. (B/F) Pairwise variation (Vn/n+1) analysis by GeNorm, to determine the optimal number of reference genes for normalisation. (C/G) Stability analysis by NormFinder (stability value: sv), GeNorm (M value) and BestKeeper (coefficient of correlation: r, standard deviation: SD), with a sum displayed in the final rank (green = most stable, red = least stable). (D/H) Overall expression stability confirmation of RefFinder, which combines NormFinder, GeNorm, BestKeeper and the comparative delta-Ct method.
Figure 6
Figure 6
Reference gene expression stability analysis in liver tissue at three (AD) and seven days (EH) following surgery. (A/E) Distribution of threshold cycle (Ct) values for each group (Fx = fracture; TBI = traumatic brain injury; TBI + Fx = combined injury) of all candidate reference genes tested. (B/F) Pairwise variation (Vn/n+1) analysis by GeNorm, to determine the optimal number of reference genes for normalisation. (C/G) Stability analysis by NormFinder (stability value: sv), GeNorm (M value) and BestKeeper (coefficient of correlation: r, standard deviation: SD), with a sum displayed in the final rank (green = most stable, red = least stable). (D/H) Overall expression stability confirmation of RefFinder, which combines NormFinder, GeNorm, BestKeeper and the comparative delta-Ct method.
Figure 7
Figure 7
Target genes normalised to strongly regulated (left graph) as well as the most suitable reference genes (right graph) in (A) bone/callus, (B) hypothalamus, (C) white adipose tissue and (D) liver at three days (d3) following surgery (Fx = fracture; TBI = traumatic brain injury; TBI + Fx = combined injury). *p < 0.05 Mann–Whitney U test vs. control.

References

    1. Demetriades D, et al. Trauma fatalities: Time and location of hospital deaths. J. Am. Coll. Surg. 2004;198:20–26. doi: 10.1016/j.jamcollsurg.2003.09.003. - DOI - PubMed
    1. Probst C, et al. 30 years of polytrauma care: An analysis of the change in strategies and results of 4849 cases treated at a single institution. Injury. 2009;40:77–83. doi: 10.1016/j.injury.2008.10.004. - DOI - PubMed
    1. Søreide K. Epidemiology of major trauma. Br. J. Surg. 2009;96:697–698. doi: 10.1002/bjs.6643. - DOI - PubMed
    1. 4World-Health-Organization. Global Health Estimates 2016: Deaths by Cause, Age, Sex, by Country and by Region 2000–2016 (2018).
    1. Keel M, Trentz O. Pathophysiology of polytrauma. Injury. 2005;36:691–709. doi: 10.1016/j.injury.2004.12.037. - DOI - PubMed

Publication types