

Histopathological imaging features- versus molecular measurements-based cancer prognosis modeling
- PMID: 32929170
- PMCID: PMC7490375
- DOI: 10.1038/s41598-020-72201-5
Histopathological imaging features- versus molecular measurements-based cancer prognosis modeling
Abstract
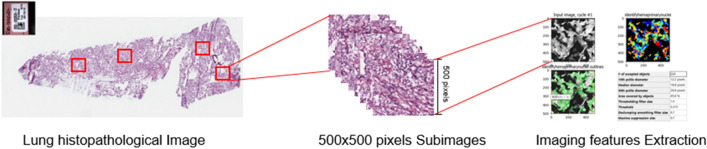
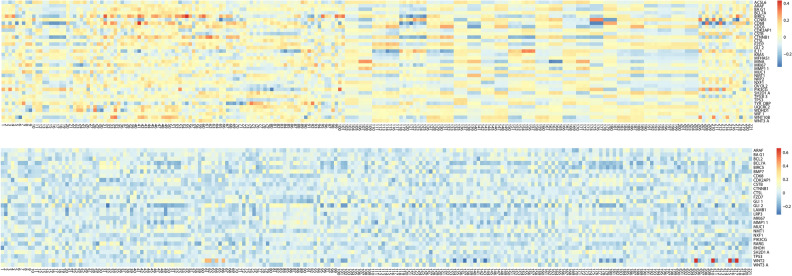
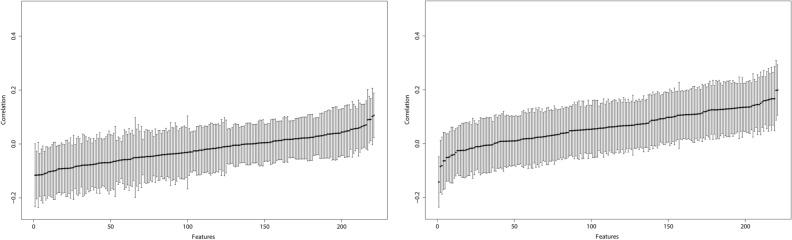
For lung and many other cancers, prognosis is essentially important, and extensive modeling has been carried out. Cancer is a genetic disease. In the past 2 decades, diverse molecular data (such as gene expressions and DNA mutations) have been analyzed in prognosis modeling. More recently, histopathological imaging data, which is a "byproduct" of biopsy, has been suggested as informative for prognosis. In this article, with the TCGA LUAD and LUSC data, we examine and directly compare modeling lung cancer overall survival using gene expressions versus histopathological imaging features. High-dimensional penalization methods are adopted for estimation and variable selection. Our findings include that gene expressions have slightly better prognostic performance, and that most of the gene expressions are weakly correlated imaging features. This study may provide additional insight into utilizing the two types of important data in cancer prognosis modeling and into lung cancer overall survival.
Conflict of interest statement
The authors declare no competing interests.
Figures
Similar articles
-
Bioinformatic analysis revealing mitotic spindle assembly regulated NDC80 and MAD2L1 as prognostic biomarkers in non-small cell lung cancer development.BMC Med Genomics. 2020 Aug 14;13(1):112. doi: 10.1186/s12920-020-00762-5. BMC Med Genomics. 2020. PMID: 32795325 Free PMC article.
-
System analysis of FHIT in LUAD and LUSC: The expression, prognosis, gene regulation network, and regulation targets.Int J Biol Markers. 2022 Jun;37(2):158-169. doi: 10.1177/03936155221084056. Epub 2022 Mar 7. Int J Biol Markers. 2022. PMID: 35254116
-
The High Expression of PTPRH Is Associated with Poor Prognosis of Human Lung Adenocarcinoma.Comput Math Methods Med. 2021 Jul 29;2021:9932088. doi: 10.1155/2021/9932088. eCollection 2021. Comput Math Methods Med. 2021. PMID: 34367321 Free PMC article.
-
Elevated PHD2 expression might serve as a valuable biomarker of poor prognosis in lung adenocarcinoma, but no lung squamous cell carcinoma.Eur Rev Med Pharmacol Sci. 2018 Dec;22(24):8731-8739. doi: 10.26355/eurrev_201812_16638. Eur Rev Med Pharmacol Sci. 2018. PMID: 30575913
-
Integrative bioinformatics analysis the clinical value of KMT5A in different subtypes of lung cancer.Comput Biol Chem. 2022 Feb;96:107603. doi: 10.1016/j.compbiolchem.2021.107603. Epub 2021 Nov 29. Comput Biol Chem. 2022. PMID: 34894606
Cited by
-
Gaussian graphical model-based heterogeneity analysis via penalized fusion.Biometrics. 2022 Jun;78(2):524-535. doi: 10.1111/biom.13426. Epub 2021 Feb 5. Biometrics. 2022. PMID: 33501648 Free PMC article.
-
Computed tomography radiomic features hold prognostic utility for canine lung tumors: An analytical study.PLoS One. 2021 Aug 17;16(8):e0256139. doi: 10.1371/journal.pone.0256139. eCollection 2021. PLoS One. 2021. PMID: 34403435 Free PMC article.
-
Pathological imaging-assisted cancer gene-environment interaction analysis.Biometrics. 2023 Dec;79(4):3883-3894. doi: 10.1111/biom.13873. Epub 2023 May 17. Biometrics. 2023. PMID: 37132273 Free PMC article.
-
Bayesian hierarchical finite mixture of regression for histopathological imaging-based cancer data analysis.Stat Med. 2022 Mar 15;41(6):1009-1022. doi: 10.1002/sim.9309. Epub 2022 Jan 13. Stat Med. 2022. PMID: 35028949 Free PMC article.
References
Publication types
MeSH terms
Substances
Grants and funding
LinkOut - more resources
Full Text Sources
Medical
Miscellaneous
