. 2021 Feb;5(2):157-168.
doi: 10.1038/s41551-020-00607-7. Epub 2020 Sep 14.

The sustained expression of Cas9 targeting toxic RNAs reverses disease phenotypes in mouse models of myotonic dystrophy type 1

Affiliations

The sustained expression of Cas9 targeting toxic RNAs reverses disease phenotypes in mouse models of myotonic dystrophy type 1

Ranjan Batra et al. Nat Biomed Eng. 2021 Feb.

Abstract

Myotonic dystrophy type I (DM1) is a multisystemic autosomal-dominant inherited human disorder that is caused by CTG microsatellite repeat expansions (MREs) in the 3' untranslated region of DMPK. Toxic RNAs expressed from such repetitive sequences can be eliminated using CRISPR-mediated RNA targeting, yet evidence of its in vivo efficacy and durability is lacking. Here, using adult and neonatal mouse models of DM1, we show that intramuscular or systemic injections of adeno-associated virus (AAV) vectors encoding nuclease-dead Cas9 and a single-guide RNA targeting CUG repeats results in the expression of the RNA-targeting Cas9 for up to three months, redistribution of the RNA-splicing protein muscleblind-like splicing regulator 1, elimination of foci of toxic RNA, reversal of splicing biomarkers and amelioration of myotonia. The sustained reversal of DM1 phenotypes provides further support that RNA-targeting Cas9 is a viable strategy for treating DM1 and other MRE-associated diseases.


Conflict of interest statement

Competing interests

G.W.Y. is a cofounder, member of the board of directors, equity holder and paid consultant of Locanabio. D.A.N. is a cofounder and an equity holder of Locanabio. R.B. is an equity holder and employee of Locanabio. M.S.S. is an equity holder of Locanabio and a Scientific Advisory Board member of Skyhawk Therapeutics. The terms of this arrangement have been reviewed and approved by the University of California San Diego and the University of Florida, Gainesville in accordance with their conflict of interest policies. The other authors declare no other competing interests.

Figures

Fig. 1 |
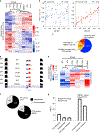
Fig. 1 |. Treatment of adult skeletal muscle in the HSALR DM1 mouse model with RNA-targeting Cas9 eliminates CuG RNA foci.
a, Treatment scheme for dual-vector administration of RNA-targeting Cas9 and sgRNA. A pair of vectors encoding PIN fused to nuclease-inactive Cas9 (dCas9) and either a CUG-targeting (CTG sgRNA; the resulting combination of vectors is referred to as RCas9-CTG) or non-targeting (NT sgRNA; the resulting combination of vectors is referred to as RCas9-NT) sgRNA were combined and injected into the TA of HSALR mice (aged 6–8 weeks). b, RNA-FISH analysis of CUG-repeat RNA in TA muscle treated with RCas9-CTG or RCas9-NT (100 nuclei were counted in 3 sections from n = 3 mice). Scale bar, 50 μm. c, Quantification of the RNA-FISH analysis of the CUG-repeat RNA foci shown in b. Data are mean ± s.d.; n = 9 mice with contralateral RCas9-CTG and RCas9-NT. Measurements were conducted on three serial muscle sections each. One-sided Mann–Whitney U-test; U = 0, Z = 5.11, *P < 0.00001.
Fig. 2 |
Fig. 2 |. RNA-targeting Cas9 releases MBNL1 protein and reverses hallmarks of splicing dysfunction in HSALR DM1 adult muscle.
a, RNA-FISH analysis of CUG repeats (red) and GFP immunofluorescence (green) of longitudinal sections of TA muscle treated with RCas9-CTG (representative image, n = 3). Transduced cells were stained in green, whereas the adjacent dark cells lack expression of CUG-targeting sgRNA. The insets on the right highlight the presence or absence of CUG RNA foci (red). Scale bars, 50 μm. b, MBNL1 protein and CUG-repeat RNA foci were visualized using immunofluorescence and RNA-FISH analysis, respectively (representative image). Bottom, a pair of adjacent cells indicate diffuse MBNL1 distribution that is correlated with the absence of CUG RNA foci (white arrow), whereas focal MBNL1 is correlated with the presence of CUG RNA foci. Scale bar, 10 μm. n = 3 mice. This experiment was reproduced in a separate cohort (Supplementary Fig. 1b) with n = 9 mice per sex per condition. c, CLCN1 protein was visualized using immunofluorescence in transverse sections of TA mouse muscle in the presence of RCas9-CTG or RCas9-NT (representative image, n = 3). Scale bar, 50 μm. d, Splicing of alternative exons regulated by MBNL1 (Clcn1, Atp2a1, Cypher (Ldb3) and Tnnt3) assessed using RT–PCR and gel electrophoresis. WT mice were compared with HSALR mice that were treated with RCas9-CTG (PIN–dCas9, CTG sgRNA), RCas9-NT (PIN–dCas9, NT sgRNA) or MBNL1-treated mice. n = 3 mice with contralateral injections of targeting and non-targeting RCas9 systems and n = 1 for MBNL1-treated and WT mice. e, The fraction of central nucleation in muscle fibres in transverse sections (n = 3 mice) with contralateral targeting and non-targeting RCas9 systems. Scale bar, 50 μm. f, Quantification of central nucleation in e. Measurements were conducted on n = 3 serial muscle sections each. Data are mean ± s.e.m. Statistical significance was determined using a one-tailed Student’s t-test; *P = 0.018.
Fig. 3 |
Fig. 3 |. RNA-targeting Cas9 promotes a global reversal of DM1-associated splicing dysfunction and increases the expression of genes associated with proper muscle function and mature muscle.
a, Hierarchical clustering (Pearson correlation) of exon inclusion indices of the genes that are most altered in HSALR TA muscle compared with the WT (n = 1). Tissues were treated with either RCas9-CTG (CTG1, CTG2 or CTG3; n = 3), RCas9-NT (NT1 or NT2; n = 2) or MBNL1 protein (MBNL1; n = 1). each numbered sample represents a mouse. b, xy scatterplots of PSI (a measure of exon inclusion ranging from 0 to 1) between WT (n = 1) and non-targeting (NT) (n = 2), or between WT (n = 1) and RCas9-CTG or CTG (n = 3). Pearson correlation R2 values are shown and are a measure of similarity of PSI scores between two conditions. The dotted lines represent a fitted line based on linear regression. c, Summary of the reversal of DM1-related alternative-splicing events describing the fraction of alternative-splicing events reversed by the RCas9 system compared with all of the splicing events regulated by MBNL1 overexpression (Oe). n = 1 (WT); n = 1 (MBNL1); n = 3 (RCas9-CTG). d, UCSC genome browser tracks of Mef2d, which encodes an important muscle transcription factor, demonstrating a switch from exon α−1 (fetal isoform) to exon α−2 (adult) among RCas9-CTG, RCas9-NT and MBNL1-treated mice. each track represents n = 1 mouse TA. e, expression levels of mature muscle markers (downstream of Mef2d and myogenesis) in tissues treated with RCas9 system or MBNL1 protein Oe. each lane represents n = 1 mouse. f, Gene expression changes among the mice treated with RCas9-NT (NT; n = 2) compared with RCas9-CTG (CTG; n = 3) and mice treated with RCas9-CTG compared with MBNL1 (positive control). Gene expression changes are summarized as either upregulated or downregulated in each of the two pairwise comparisons. g, GO analysis comparing RCas9-CTG (CTG-targeting) and RCas9-NT (non-targeting) or the RCas9-CTG and MBNL1 (P < 10−5). P values were calculated using modified Fisher’s exact tests using the DAVID GO tool (https://david.ncifcrf.gov/); −log10-transformed P values are indicated.
Fig. 4 |
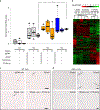
Fig. 4 |. Sustained expression of RNA-targeting Cas9 in WT adult muscle.
a, Cas9 mRNA levels in TA muscle of WT mice treated with AAV9 encoding PIN–dCas9 and sgRNA as assessed by RT–qPCR at 1, 6 and 12 weeks after treatment. Mice were treated with various immunosuppression regimens transiently for 2 weeks. Interquartile range and median as indicated were determined with n = 4 mice per condition per time point for a total of 48 mice. Statistical analysis was performed using a two-tailed paired Student’s t-test; 1.75-fold, *P = 0.00055. The centre lines show the median values, the box limits indicate the 25th and 75th percentiles as determined using R and the whiskers extend to 1.5× the interquartile range from the 25th and 75th percentiles; outliers are represented by dots. b, Hierarchical clustering (Pearson correlation) of log2[RPKM] of the most altered genes in WT mice 1, 6 and 12 weeks after treatment injected into the TA with sgRNA alone (G1), sgRNA and PIN–dCas9 (G2), or sgRNA, PIN–dCas9, tacrolimus and CTLA4-Ig (G4). The groups are the same as described in Fig. 3a. each lane represents n = 1 mouse TA. c, CD3+ immunohistochemistry analysis of T cells in WT mice that were treated with sgRNA only, PIN–dCas9 and sgRNA (RCas9), PIN–dCas9 and sgRNA with tacrolimus (RCas9 + tac.), or PIN–dCas9 with tacrolimus and CTLA4-Ig (RCas9-CTG + tac. + CTLA4-Ig) 4 weeks after injection (representative images, n = 4). T-cell nests are indicated by black arrows. Scale bars, 50 μm. d, CD3+ immunohistochemistry analysis of T cells in HSALR mice treated with either control (AAV9 with empty filler genome, injected into the left TA) or RCas9-CTG (RCas9, injected into the right TA), with or without tacrolimus and CTLA4-Ig (RCas9 + tac. + CTLA4-Ig) 4 weeks after injection (representative images, n = 4). Scale bars, 50 μm.
Fig. 5 |
Fig. 5 |. Transient pharmacological immunosuppression promotes sustained expression of RNA-targeting Cas9 in adult muscle.
a, Quantification of Fig. 4c,d. n = 4 or n = 5 mice. Genotypes were labelled at 4 weeks after injection. The lanes represent sgRNA-alone control (WT), RCas9-CTG (WT), RCas9-CTG (HSALR) and RCas9-CTG cotreatment with transient immunosuppression (IS) with tacrolimus and CTLA4-Ig. The centre lines show the median values, the box limits indicate the 25th and 75th percentiles as determined using R and the whiskers extend to 1.5× the interquartile range from the 25th and 75th percentiles; outliers are represented by dots. b, RCas9-CTG RNA levels in TA muscle of HSALR mice that were treated with AAV9 encoding PIN–dCas9 and sgRNA, as assessed using RT–qPCR. HSALR mice were treated with control (AAV9 with empty filler genome, injected into the left TA) and either RCas9-CTG (RCas9) or RCas9-CTG (RCas9) with tacrolimus and CTLA4-Ig (RCas9-IS) for 4, 8 and 12 weeks. n = 4. Two-tailed Student’s t-tests, **P = 0.0079 (8-week samples RCas9-CTG versus RCas9-CTG + immunosuppression); **P = 0.0000543 (12-week samples RCas9-CTG versus RCas9-CTG + immunosuppression). One-tailed Student’s t-test, P = 0.125 (8-week RCas9-CTG + immunosuppression versus 12-week RCas9-CTG + immunosuppression). The centre lines show the median values, the box limits indicate the 25th and 75th percentiles as determined using R and the whiskers extend to 1.5× the interquartile range from the 25th and 75th percentiles; outliers are represented by dots.
Fig. 6 |
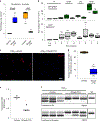
Fig. 6 |. Systemic treatment of HSALR DM1 mice with RNA-targeting Cas9 leads to sustained expression in various tissues, eliminates toxic RNA foci and reverses DM1-related mis-splicing.
a, mRNA levels of Cas9 (blue) and HSALR (CUG repeat levels, orange) in the quadriceps muscle of mice that were treated with either control or RCas9-CTG 16 weeks after treatment with 2 × 10¹¹ vg of AAV9-RCas9-CTG in P0 (neonatal) HSALR mice. n = 3 for each condition. Statistical significance was determined using a one-tailed Student’s t-test; **P = 0.0071. The centre lines show the median values, the box limits indicate the 25th and 75th percentiles as determined using R and the whiskers extend to 1.5× the interquartile range from the 25th and 75th percentiles; outliers are represented by dots. b, The distribution of mRNA levels of GFP gRNA (green) and Cas9 (grey) levels in various indicated tissues measured using RT–qPCR at 4 and 8 weeks after lateral tail vein injection of 1 × 1012 vg of AAV9-RCas9-CTG vectors in adult (aged 8 weeks) HSALR mice (n = 3). The levels were normalized to the levels in TA muscle at 4 weeks. 4 w veh., vehicle treatment at 4 weeks. The centre lines show the median values, the box limits indicate the 25th and 75th percentiles as determined using R and the whiskers extend to 1.5× the interquartile range from the 25th and 75th percentiles; outliers are represented by dots. c, RNA-FISH analysis of CUG-repeat RNA in the quadriceps muscle 4 weeks after lateral tail vein injection of either vehicle control or 1012 vg of AAV9-RCas9-CTG (100 nuclei were counted in 3 sections from n = 3 mice) in adult HSALR mice (aged 8 weeks). Scale bar, 50 μm. d, Quantification of RNA-FISH analysis of CUG-repeat RNA foci in adult HSALR mice (aged 8 weeks) in c. Statistical significance was determined using a one-tailed Student’s t-test; **P = 0.0015. n = 3 each. The centre lines show the median values, the box limits indicate the 25th and 75th percentiles as determined using R and the whiskers extend to 1.5× the interquartile range from the 25th and 75th percentiles; outliers are represented by dots. e, HSA RNA levels in the quadriceps muscle 4 weeks after lateral tail vein injection of either vehicle control or 1012 vg of AAV9-RCas9-CTG in adult HSALR mice (aged 8 weeks). n = 3. Statistical significance was determined using a one-sided Student’s t-test; *P< 0.024. f, Splicing of alternative exon 22 in Atp2a1 assessed using RT–PCR in quadriceps 16 weeks after temporal vein injection of P0 (neonatal) HSALR mice with either saline or 1011 vg of AAV9-RCas9-CTG (top). Splicing of alternative exon 22 in Atp2a1 was assessed using RT–PCR in the quadriceps 4 weeks after lateral tail vein injection of adult HSALR mice (aged 8 weeks) with either vehicle or 1012 vg of AAV9-RCas9-CTG (bottom). Total n = 3 mice for each condition, each lane represents measurements from a single mouse.
Fig. 7 |
Fig. 7 |. Systemic treatment of HSALR DM1 mouse model with RNA-targeting Cas9 reverses behavioural and electrophysiological features of the disease.
a, Quantification of pull-test measurements in terms of latency (seconds) to hind-limb relaxation at 8 and 16 weeks after treatment of P0 (neonatal) HSALR mice with either saline (control) or 1011 vg of AAV9-RCas9-CTG. n = 5. One-sided Mann–Whitney U-test; U = 0, Z = 2.5, **P = 0.0064. each dot represents an individual mouse. b, electromyography of TA of untreated WT, treated control (saline) and AAV9-RCas9-CTG-treated (1011 vg) P0 (neonatal) HSALR mice at 8 weeks after temporal vein injection. n = 5 mice for each condition. One-sided Mann–Whitney U-test; U = 0, Z = 2.8, ***P = 0.00256. The centre lines show the median values, the box limits indicate the 25th and 75th percentiles as determined using R and the whiskers extend to 1.5× the interquartile range from the 25th and 75th percentiles; outliers are represented by dots. c, electromyography of TA of adult HSALR mice (aged 8 weeks) 4 weeks after lateral tail injection of either vehicle or AAV9-RCas9-CTG (1012 vg). n = 3 mice for each condition. The centre lines show the median values, the box limits indicate the 25th and 75th percentiles as determined using R and the whiskers extend to 1.5× the interquartile range from the 25th and 75th percentiles. Statistical significance was determined using a one-tailed Student’s t-test; *P = 0.03.

Comment in

Similar articles

Cited by

References

    1. Iyer RR, Pluciennik A, Napierala M & Wells RD DNA triplet repeat expansion and mismatch repair. Annu. Rev. Biochem. 84, 199–226 (2015). - PMC - PubMed
    1. Dion V Tissue specificity in DNA repair: lessons from trinucleotide repeat instability. Trends Genet. 30, 220–229 (2014). - PubMed
    1. Lopez Castel A, Cleary JD & Pearson CE Repeat instability as the basis for human diseases and as a potential target for therapy. Nat. Rev. Mol. Cell Biol. 11, 165–170 (2010). - PubMed
    1. McGinty RJ & Mirkin SM Cis- and trans-modifiers of repeat expansions: blending model systems with human genetics. Trends Genet. 34, 448–465 (2018). - PMC - PubMed
    1. Pearson CE Slipping while sleeping? Trinucleotide repeat expansions in germ cells. Trends Mol. Med. 9, 490–495 (2003). - PubMed

Publication types