Review
. 2020 Sep;52(9):1428-1442.
doi: 10.1038/s12276-020-0420-2. Epub 2020 Sep 15.

Single-cell multiomics: technologies and data analysis methods

Affiliations
Review

Single-cell multiomics: technologies and data analysis methods

Jeongwoo Lee et al. Exp Mol Med. 2020 Sep.

Abstract

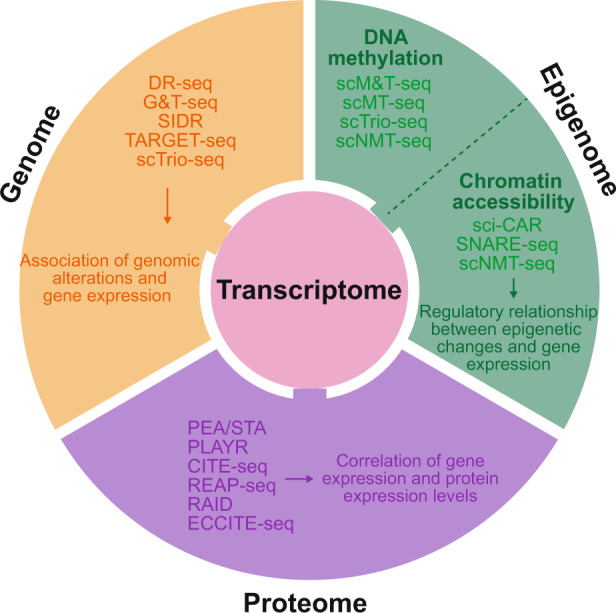
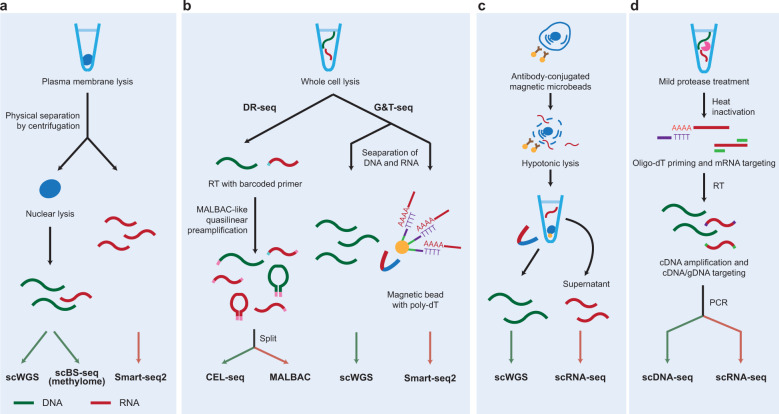
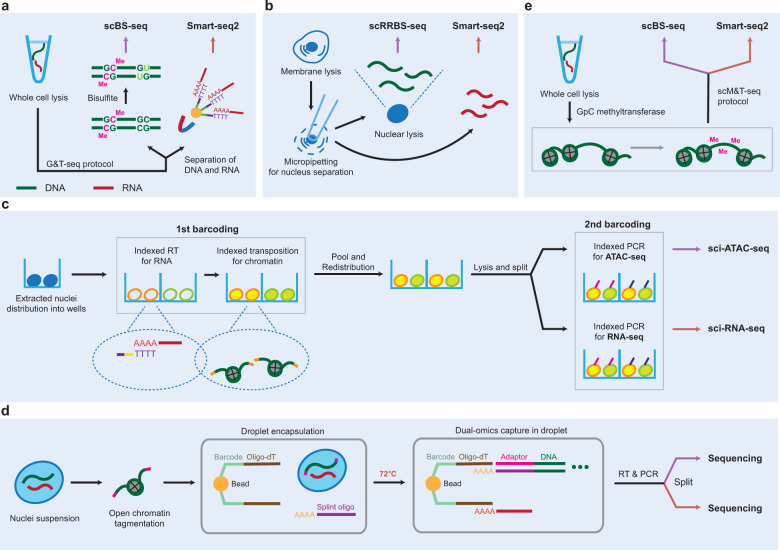
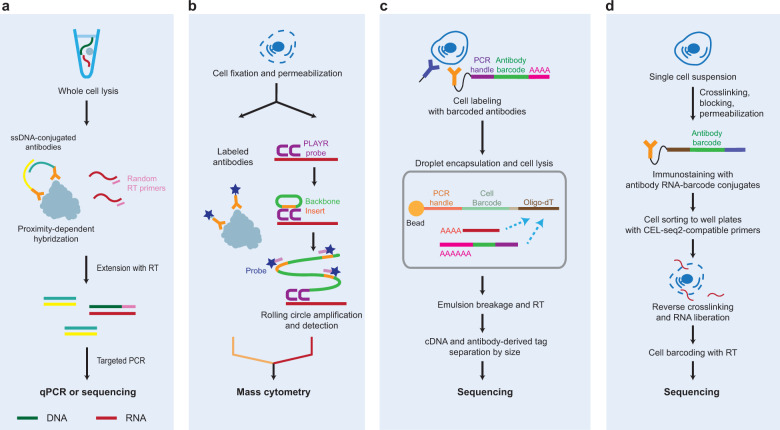
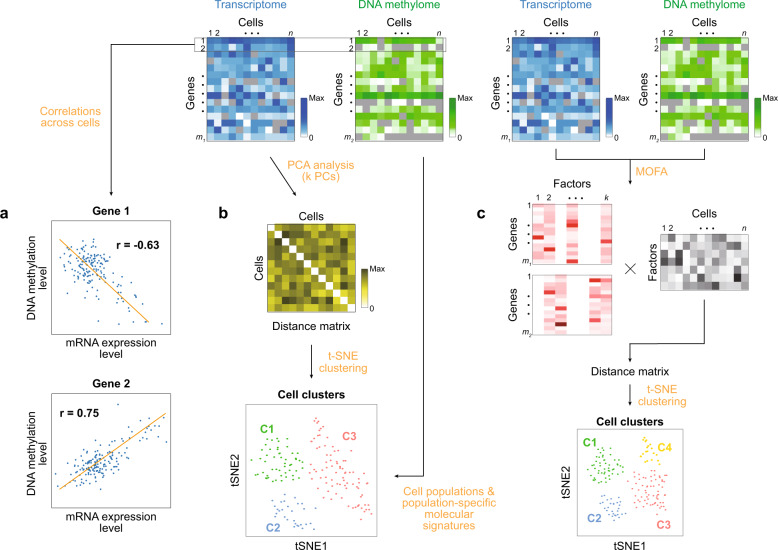
Advances in single-cell isolation and barcoding technologies offer unprecedented opportunities to profile DNA, mRNA, and proteins at a single-cell resolution. Recently, bulk multiomics analyses, such as multidimensional genomic and proteogenomic analyses, have proven beneficial for obtaining a comprehensive understanding of cellular events. This benefit has facilitated the development of single-cell multiomics analysis, which enables cell type-specific gene regulation to be examined. The cardinal features of single-cell multiomics analysis include (1) technologies for single-cell isolation, barcoding, and sequencing to measure multiple types of molecules from individual cells and (2) the integrative analysis of molecules to characterize cell types and their functions regarding pathophysiological processes based on molecular signatures. Here, we summarize the technologies for single-cell multiomics analyses (mRNA-genome, mRNA-DNA methylation, mRNA-chromatin accessibility, and mRNA-protein) as well as the methods for the integrative analysis of single-cell multiomics data.


Conflict of interest statement

The authors declare that they have no conflict of interest.

Figures

Fig. 1
Fig. 1. An overview of single-cell multiomics sequencing technologies.
Single-cell multiomics sequencing technologies and the expected outcomes are illustrated. Technologies that measure more than two types of data are included in multiple categories (e.g., scTrio-seq in transcriptome-genome and transcriptome-DNA methylation categories).
Fig. 2
Fig. 2. Single-cell multiomics sequencing protocols for the integrative analyses of the genome and transcriptome.
Protocols for the isolation of single cells or nuclei and the barcoding of gDNA and mRNAs are shown for five types of multiomics analyses of the genome and transcriptome: scTrio-seq (a), DR-seq and G&T-seq (b), SIDR (c), and TARGET-seq (d). Blue solid circles, nucleus; blue dotted line, permeabilized membrane; red and green lines, mRNA and gDNA, respectively; yellow solid circles, beads; Y shapes, antibodies; magenta and green fragments, barcodes or primers; and U shapes, magnets. See text for the definitions of the abbreviations.
Fig. 3
Fig. 3. Single-cell multiomics sequencing protocols for the integrative analysis of the transcriptome and epigenome.
Protocols for the isolation of single cells or nuclei and the barcoding of gDNA and mRNAs are shown for five types of multiomics analyses of the transcriptome and epigenome: scM&T-seq (a) and scMT-seq (b) for DNA methylation and sci-CAR (c), SNARE-seq (d), and scNMT-seq (e) for chromatin accessibility. Gray cross, nucleosome; Me, CH3. In c, the colors of the border line, inside, and tip of the circles distinguish the barcodes of mRNAs, accessible DNA fragments, and indexed PCR, respectively. See the legend in Fig. 2 for the other symbols and the text for the definitions of the abbreviations.
Fig. 4
Fig. 4. Single-cell multiomics sequencing protocols for integrative analyses of the transcriptome and proteome.
Protocols for the isolation of single cells and the barcoding of mRNAs and proteins are shown for four types of multiomics analyses of the transcriptome and proteome: PEA/STA (a), PLAYR (b), CITE-seq (c), and RAID (d). Green-blue line, single-stranded DNA (ssDNA) oligos conjugated to antibodies; rotated U shapes, PLAYR probes; green-orange circle, backbone-insert oligos; and DNA fragments containing stars, isotope-labeled probes. See the legend of Fig. 2 for the other symbols and the text for the definitions of the abbreviations.
Fig. 5
Fig. 5. Strategies for the integrative analysis of single-cell multiomics data.
Blue and green heat maps represent the data matrixes for the transcriptome and DNA methylome, respectively. The symbols n, m1, and m2 denote the numbers of cells (n) and genes with the levels of mRNA (m1) and DNA methylation (m2). Colors in the heat maps represent the levels of mRNA and DNA methylation (see color bars; Max, the maximum level). a Correlation analysis between mRNA and DNA methylation levels. Scatter plots show mRNA and DNA methylation levels for genes 1 (top) and 2 (bottom). Line, regression line; r, Pearson correlation. Negative and positive correlations are shown for genes 1 and 2, respectively. b Analysis of scRNA-seq data followed by the integration of scBS-seq data. Principal component analysis (PCA) is first applied to scRNA-seq data to obtain score values for k PCs, the pairwise Euclidean distances of cells are computed using the score values for k PCs to generate a distance matrix, t-stochastic neighbor embedding (t-SNE) clustering is applied to the distance matrix to identify cell populations, and scBS-seq data are then integrated into these cell populations as described in the text. C1-3, cell populations 1-3, respectively. c Integrative analysis of scRNA-seq and scBS-seq data to generate the overall single-cell map. The analytical scheme of MOFA is shown. Two-way matrix decomposition is performed for scRNA-seq and scBS-seq data using k factors, resulting in weight matrixes (m1 × k for scRNA-seq data and m2 × k for scBS-seq data) and a factor loading matrix (k × n for n cells). Factor loading values are used to compute a distance matrix that is then used for t-SNE clustering. The t-SNE plot shows cell populations 1-4 (C1-4) identified collectively by scRNA-seq and scBS-seq data.

References

    1. Gawad C, Koh W, Quake SR. Single-cell genome sequencing: current state of the science. Nat. Rev. Genet. 2016;17:175–188. - PubMed
    1. Woodworth MB, Girskis KM, Walsh CA. Building a lineage from single cells: genetic techniques for cell lineage tracking. Nat. Rev. Genet. 2017;18:230–244. - PMC - PubMed
    1. Schwartzman O, Tanay A. Single-cell epigenomics: techniques and emerging applications. Nat. Rev. Genet. 2015;16:716–726. - PubMed
    1. Prakadan SM, Shalek AK, Weitz DA. Scaling by shrinking: empowering single-cell ‘omics’ with microfluidic devices. Nat. Rev. Genet. 2017;18:345–361. - PMC - PubMed
    1. Tirosh I, et al. Dissecting the multicellular ecosystem of metastatic melanoma by single-cell RNA-seq. Science. 2016;352:189–196. - PMC - PubMed

Publication types