Review
. 2020 Sep;52(9):1452-1465.
doi: 10.1038/s12276-020-0422-0. Epub 2020 Sep 15.

Single-cell transcriptomics in cancer: computational challenges and opportunities

Affiliations
Review

Single-cell transcriptomics in cancer: computational challenges and opportunities

Jean Fan et al. Exp Mol Med. 2020 Sep.

Abstract

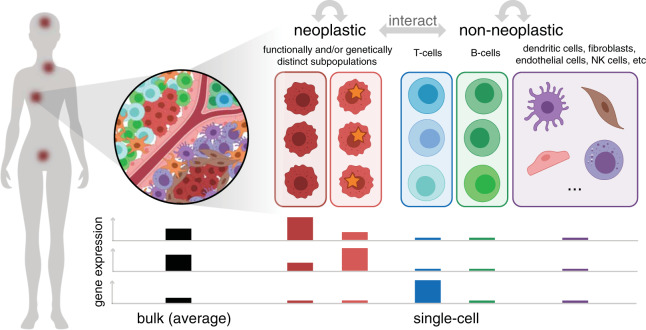
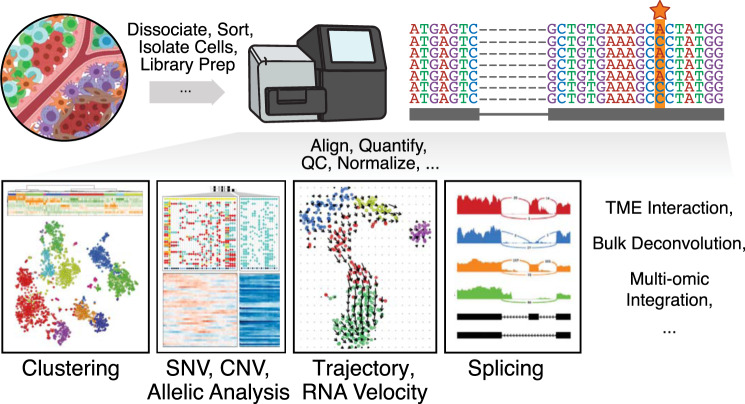
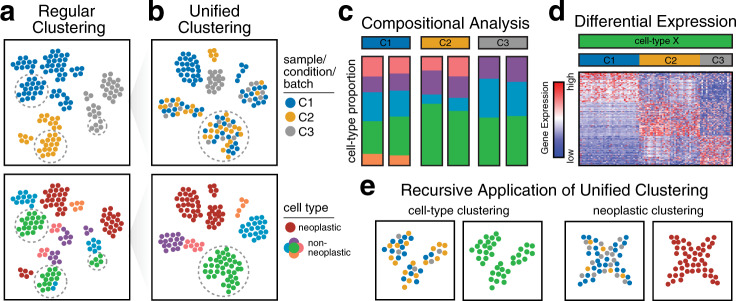
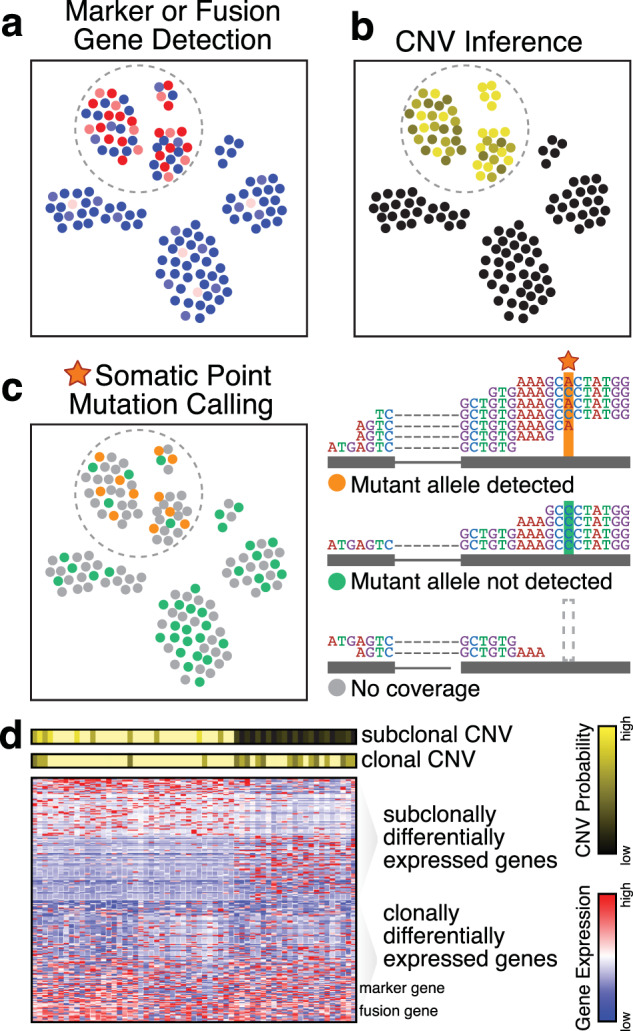
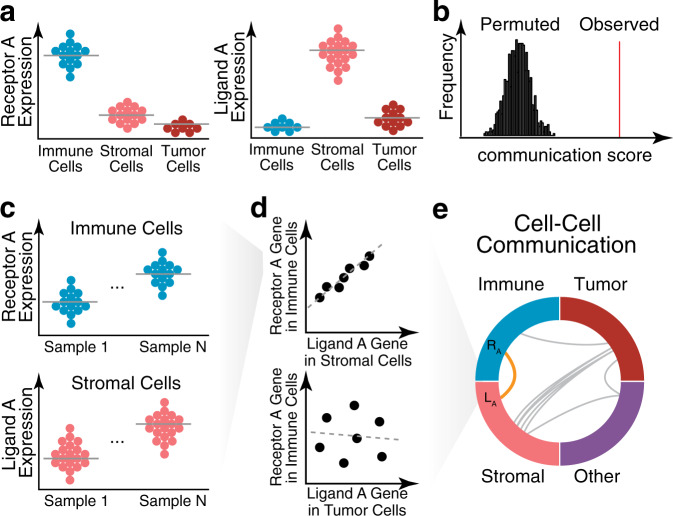
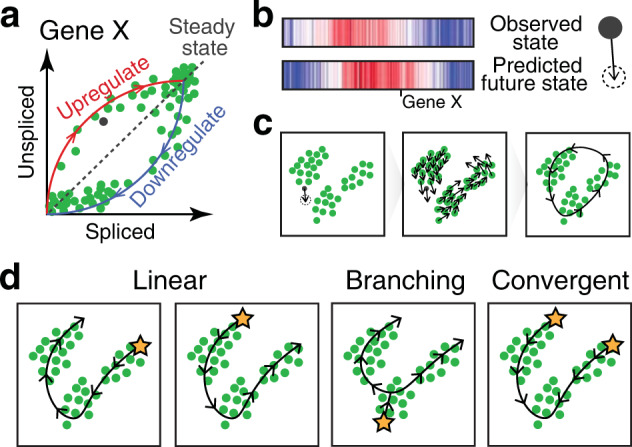
Intratumor heterogeneity is a common characteristic across diverse cancer types and presents challenges to current standards of treatment. Advancements in high-throughput sequencing and imaging technologies provide opportunities to identify and characterize these aspects of heterogeneity. Notably, transcriptomic profiling at a single-cell resolution enables quantitative measurements of the molecular activity that underlies the phenotypic diversity of cells within a tumor. Such high-dimensional data require computational analysis to extract relevant biological insights about the cell types and states that drive cancer development, pathogenesis, and clinical outcomes. In this review, we highlight emerging themes in the computational analysis of single-cell transcriptomics data and their applications to cancer research. We focus on downstream analytical challenges relevant to cancer research, including how to computationally perform unified analysis across many patients and disease states, distinguish neoplastic from nonneoplastic cells, infer communication with the tumor microenvironment, and delineate tumoral and microenvironmental evolution with trajectory and RNA velocity analysis. We include discussions of challenges and opportunities for future computational methodological advancements necessary to realize the translational potential of single-cell transcriptomic profiling in cancer.


Conflict of interest statement

The authors declare that they have no conflict of interest.

Figures

Fig. 1
Fig. 1. Cancer may manifest as multiple spatially distinct tumors composed of multiple functionally and/or genetically distinct neoplastic subpopulations as well as diverse nonneoplastic cell types and states that interact to impact clinical outcomes.
In this illustration, (left) a single patient presents with cancer at multiple sites. (top right) Zooming into one site, multiple cell types, both neoplastic and nonneoplastic, can be observed. Within the neoplastic cells, two distinct subpopulations marked by different somatic mutations, indicated with a star, are present. Likewise, within nonneoplastic cells, multiple distinct T-cell and B-cell subtypes and states, indicated with different shades of colors, are present. (bottom) Bulk measurements provide the average quantification of gene expression, which potentially obscures proportional and subpopulation or state-specific differences. The expression levels of three genes determined from bulk and pooled single-cell measurements for the two different neoplastic subtypes and major nonneoplastic cell types (T-cells, B-cells, and other) are illustrated as an example. The first two genes appear to be highly expressed in the bulk sample but are actually highly expressed in only one of the neoplastic subpopulations. In contrast, the third gene appears to show low expression in the bulk sample but is actually highly expressed among T-cells, which are proportionally low in abundance. In this manner, single-cell measurements could enable the finer, unbiased characterization of transcriptional features that underlie important cancer phenotypes.
Fig. 2
Fig. 2. Single cell RNA-seq workflow and downstream computational analyses.
High-throughput single-cell transcriptomic technologies such as single-cell RNA sequencing generally begin with experimental workflows tailored to distinct tumor and tissue types (dissociating, sorting, and isolating cells, etc.), which ultimately result in sequences that can be aligned, quantified, quality control (QC) filtered, and normalized in different ways to enable a number of downstream computational analyses, such as clustering analysis to identify transcriptionally distinct cell types and subpopulations, allelic analysis to identify single nucleotide variants (SNVs, indicated with a star in the read pileup) or copy number variants (CNVs), trajectory analysis, splicing detection, or the inference of tumor-microenvironmental (TME) interactions.
Fig. 3
Fig. 3. Unified clustering analysis.
a The clustering of cells from different samples across diverse conditions may result in cells being aggregated by sample, condition, or other technical factors such as the batch rather than the cell types of interest. The top illustration shows a 2D reduced dimensional representation (e.g., tSNE) in which each point is a cell and is colored according to the sample, condition, or batch label. The bottom illustration shows the same 2D embedding colored according to cell type. Cells are aggregated according to the sample, condition, or batch, rather than the cell type, making the identification of shared cell types difficult. b Unified clustering analysis results in cells that are appropriately aggregated by cell type, particularly for nonneoplastic cell types. c After the identification of common cell types, additional downstream analyses may be performed. For example, compositional analysis comparing nonneoplastic cell-type proportions across three conditions, each with two replicates, can be performed to show high correspondence within replicates but differences across conditions. d Differential expression analysis can also be applied to one cell type, comparing each condition to all others, identifying differentially upregulated genes in each condition. e Unified clustering analysis may be applied recursively to identify additional subtypes or states within nonneoplastic cell types (left) or shared transcriptional states among neoplastic cells across patients.
Fig. 4
Fig. 4. Distinguishing neoplastic and nonneoplastic cells.
a The detection of marker or fusion genes that are uniquely upregulated or expressed in neoplastic cells may be used to identify neoplastic cells. In this illustration, many neoplastic cells exhibit high expression (red) of a marker or fusion gene, although dropouts or other technical factors result in the detection of low or no expression (blue) in other neoplastic cells in the same cluster. b Copy-number variant (CNV) inference may also be used to identify neoplastic cells. Normalized smoothed gene expression magnitudes and variant allele frequencies can be used to infer the probability that a cell harbors CNVs. Neoplastic cells exhibit higher probabilities of harboring any CNVs, as expected. c Somatic point mutation calling may be used to identify neoplastic cells. The top read pileup for a cell shows an example in which both the mutant and reference alleles are detected, indicating that the cells harbors the mutation. The middle read pileup for a cell shows an example in which the mutant allele is not detected, which could indicate that the cell does not harbor the mutation or that there is allelic dropout of the mutant allele. Alternatively, the bottom read pileup shows an example where the mutation site presents no read coverage, and thus, no mutation call can be made. d The inference of CNVs and other genetic alterations directly from RNA-sequencing data enables the direct interrogation of transcriptional differences among genetic subclones. A clonal CNV distinguishes neoplastic from nonneoplastic cells and is also marked by high expression of marker and fusion genes. In addition, a subclonal CNV is present. Differential expression analysis may be applied to directly identify differentially expressed genes between genetic subclones.
Fig. 5
Fig. 5. Inference of cell–cell communication.
a The codetection of receptor-ligand pairs may be used to identify putative cell-cell communication. In this illustration, the single-cell expression levels of known receptor-ligand pairs (Receptor A and Ligand A) are shown across cell types. High receptor expression is identified in immune cells, as illustrated in the beeswarm plot, where each point is a cell. Likewise, high ligand expression is identified in stromal cells. Such codetection may indicate putative cell–cell communication between these two cell types. b Codetection may be quantified as a cell–cell communication score that is evaluated through permutation testing to assess statistical significance. c When multiple samples are available, correlation between receptor-ligand pairs may be used to identify putative cell–cell communication. In this illustration, the single-cell expression levels of known receptor–ligand pairs (Receptor A and Ligand A) are again plotted for N samples. d (top) The average Receptor A gene expression in an immune cell type versus the average Ligand A gene expression in a stromal cell type shows a high correlation across samples (represented as points), indicative of cell–cell communication between these two cell types. (bottom) In contrast, the correlation of the average Receptor A gene expression versus the average Ligand A gene expression in immune and tumor cells shows a poor correlation across samples. e Such correlations may be indicative of cell–cell communication between immune and stromal cell types (orange). Such testing can be applied to all cell-type pairs and visualized as a circle plot.
Fig. 6
Fig. 6. Trajectory inference combined with RNA velocity analysis.
a Transcriptional dynamics model used to estimate RNA velocity. For an individual gene such as Gene X, RNA velocity is modeled across a population of cells based on the observed spliced (e.g., exonic) and unspliced (e.g., intronic) mRNA abundances, plotted on the x- and y-axes, respectively. In this model, cells, illustrated as points, upregulating expression of the gene are expected to exhibit a relatively higher proportion of unspliced mRNA compared to spliced mRNA, while cells downregulating expression of the gene are expected to exhibit a relatively lower proportion of unspliced mRNA compared to spliced mRNA. b Such models of transcriptional dynamics can be used to extrapolate expression levels for many genes at a future time point. In this illustration, the current high-dimensional observed transcriptional state for a cell is visualized in a heatmap in which each column represents a gene, where red indicates higher expression, and blue indicates lower expression. The predicted future transcriptional state for the same set of genes based on the RNA velocity model is shown below. c The future transcriptional state for each cell, as predicted by the RNA velocity models, can be projected to a lower-dimensional embedding (e.g., tSNE and PCA). An arrow can be used to connect the observed transcriptional state and the future predicted transcriptional state in the lower-dimensional embedding to visualize velocities. This can be performed for each cell individually, as a gridded velocity field, or as a single directed principal curve, as illustrated. d RNA velocity analysis may be applied to distinguish between different trajectory patterns, such as a linear progression through different states, versus branching or convergent trajectories, as illustrated. RNA velocity analysis may also be applied to identify the roots or origins of cellular trajectories, illustrated here as stars.

References

    1. Marusyk A, Almendro V, Polyak K. Intra-tumour heterogeneity: a looking glass for cancer? Nat. Rev. Cancer. 2012;12:323–334. - PubMed
    1. Dagogo-Jack, I. & Shaw, A. T. Tumour heterogeneity and resistance to cancer therapies. 10.1038/nrclinonc.2017.166 (2018). - PubMed
    1. Cieślik M, Chinnaiyan AM. Cancer transcriptome profiling at the juncture of clinical translation. Nat. Rev. Genet. 2018;19:93–109. - PubMed
    1. Suvà ML, Tirosh I. Single-cell RNA sequencing in cancer: lessons learned and emerging challenges. Mol. Cell. 2019;75:7–12. - PubMed
    1. Saadatpour A, Lai S, Guo G, Yuan G-C. Single-cell analysis in cancer genomics. Trends Genet. 2015;31:576–586. - PMC - PubMed

Publication types

Substances