. 2020 Nov;21(11):1359-1370.
doi: 10.1038/s41590-020-0777-3. Epub 2020 Sep 14.

A regulatory T cell Notch4-GDF15 axis licenses tissue inflammation in asthma

Affiliations

A regulatory T cell Notch4-GDF15 axis licenses tissue inflammation in asthma

Hani Harb et al. Nat Immunol. 2020 Nov.

Erratum in

Abstract

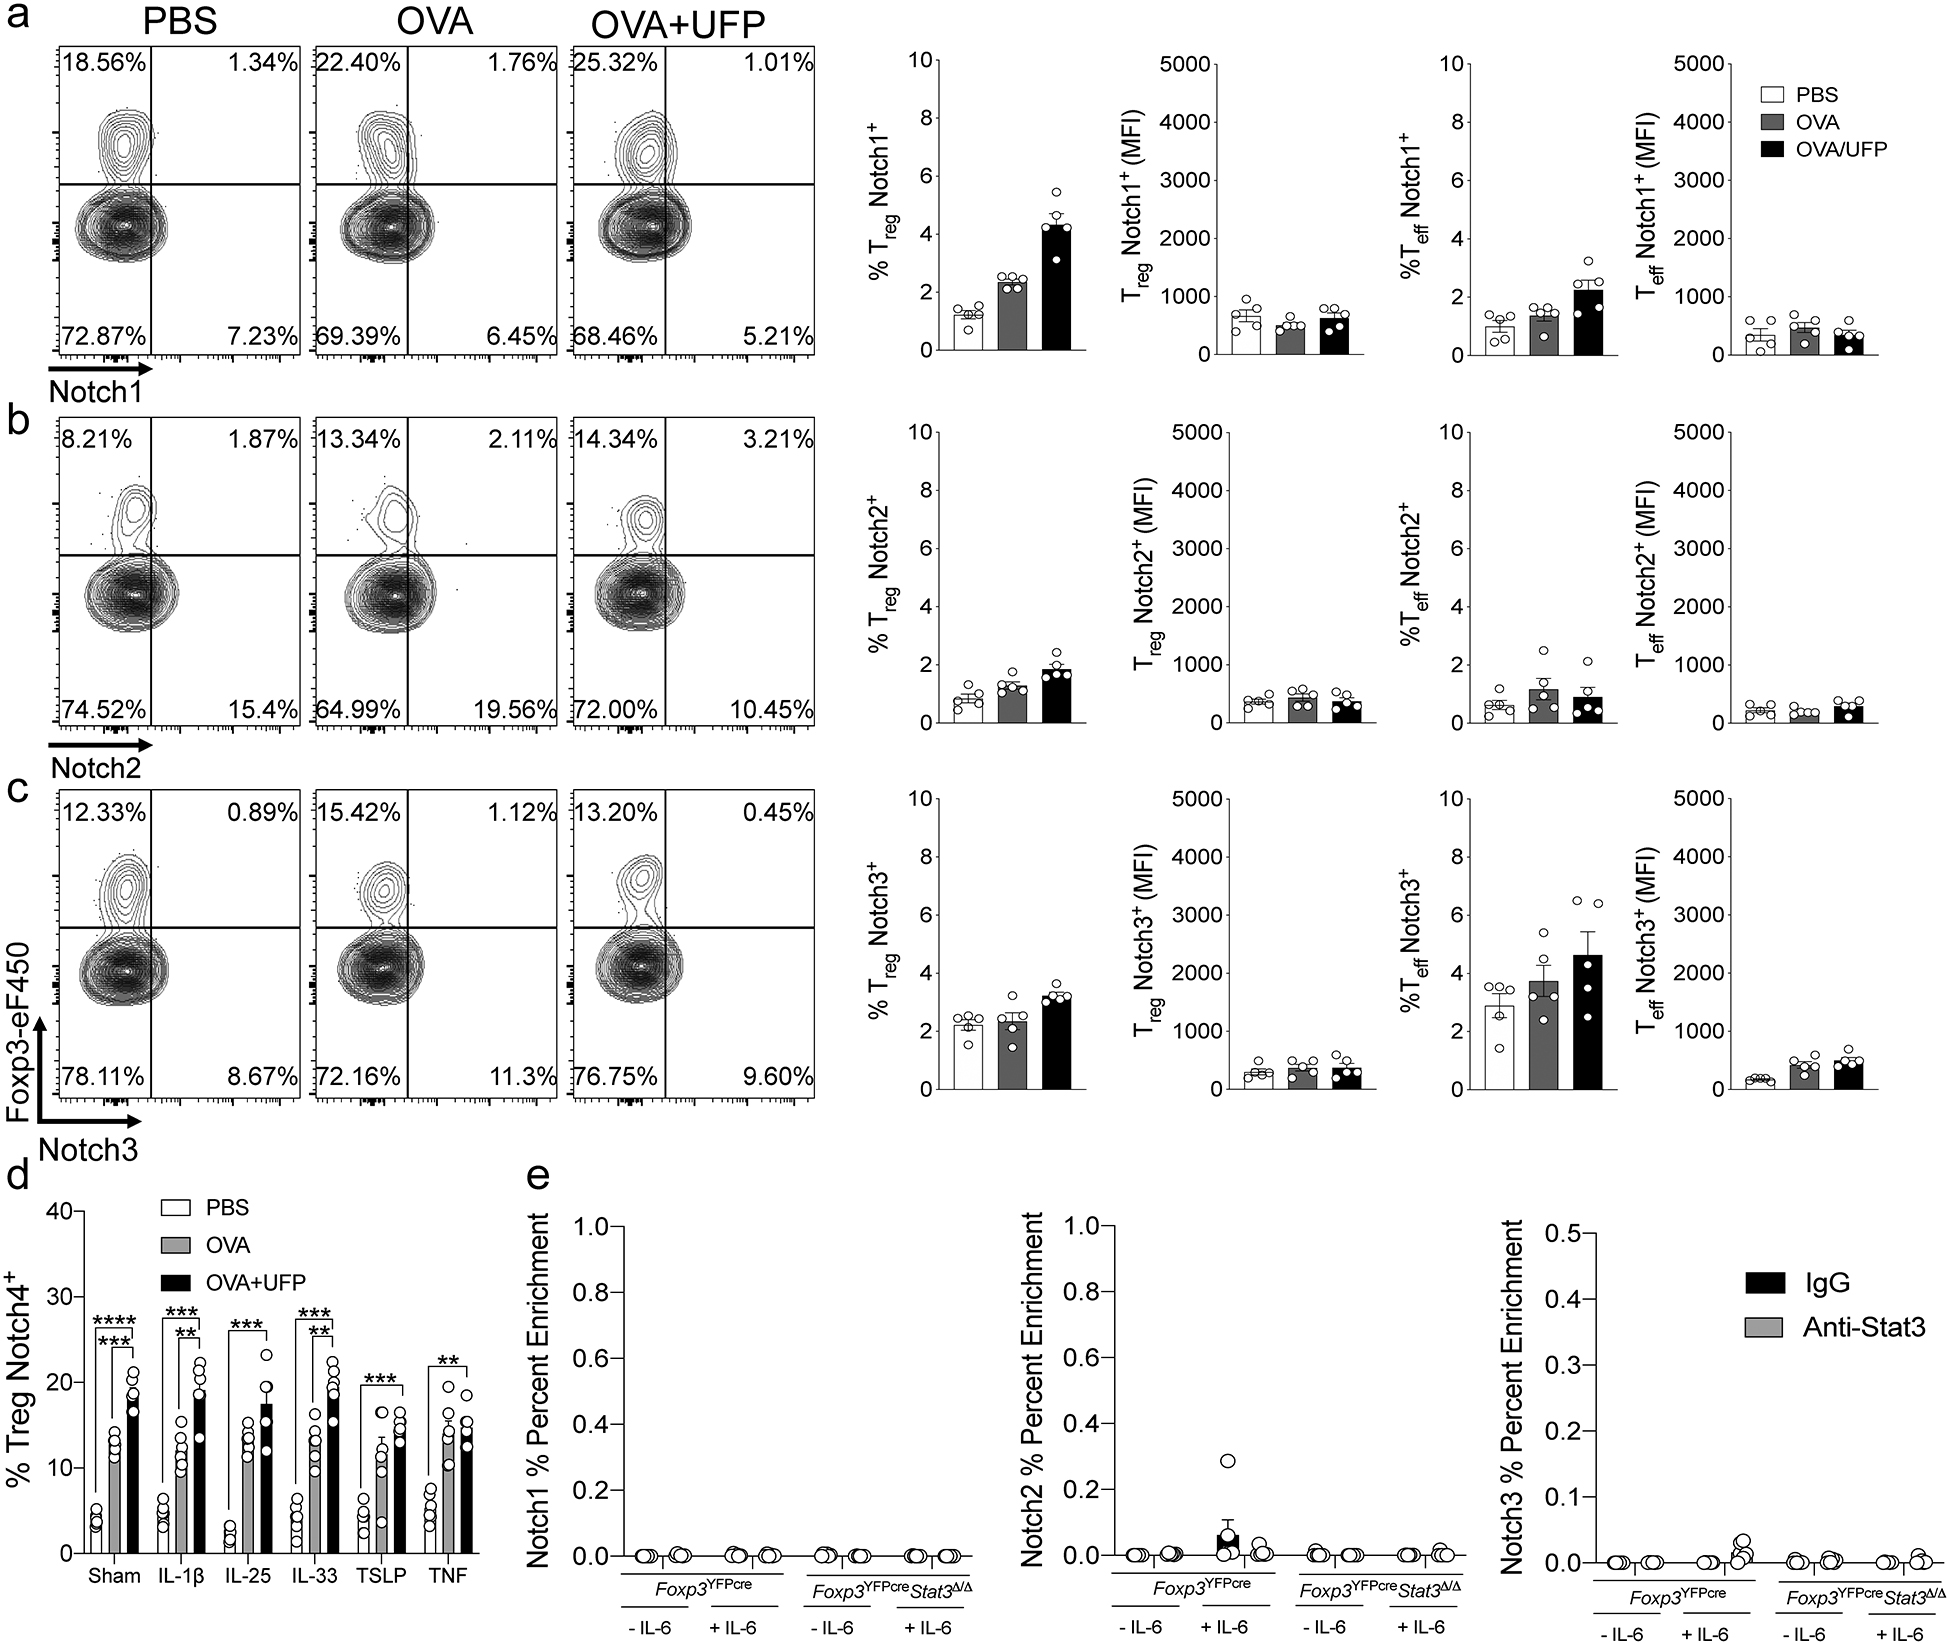
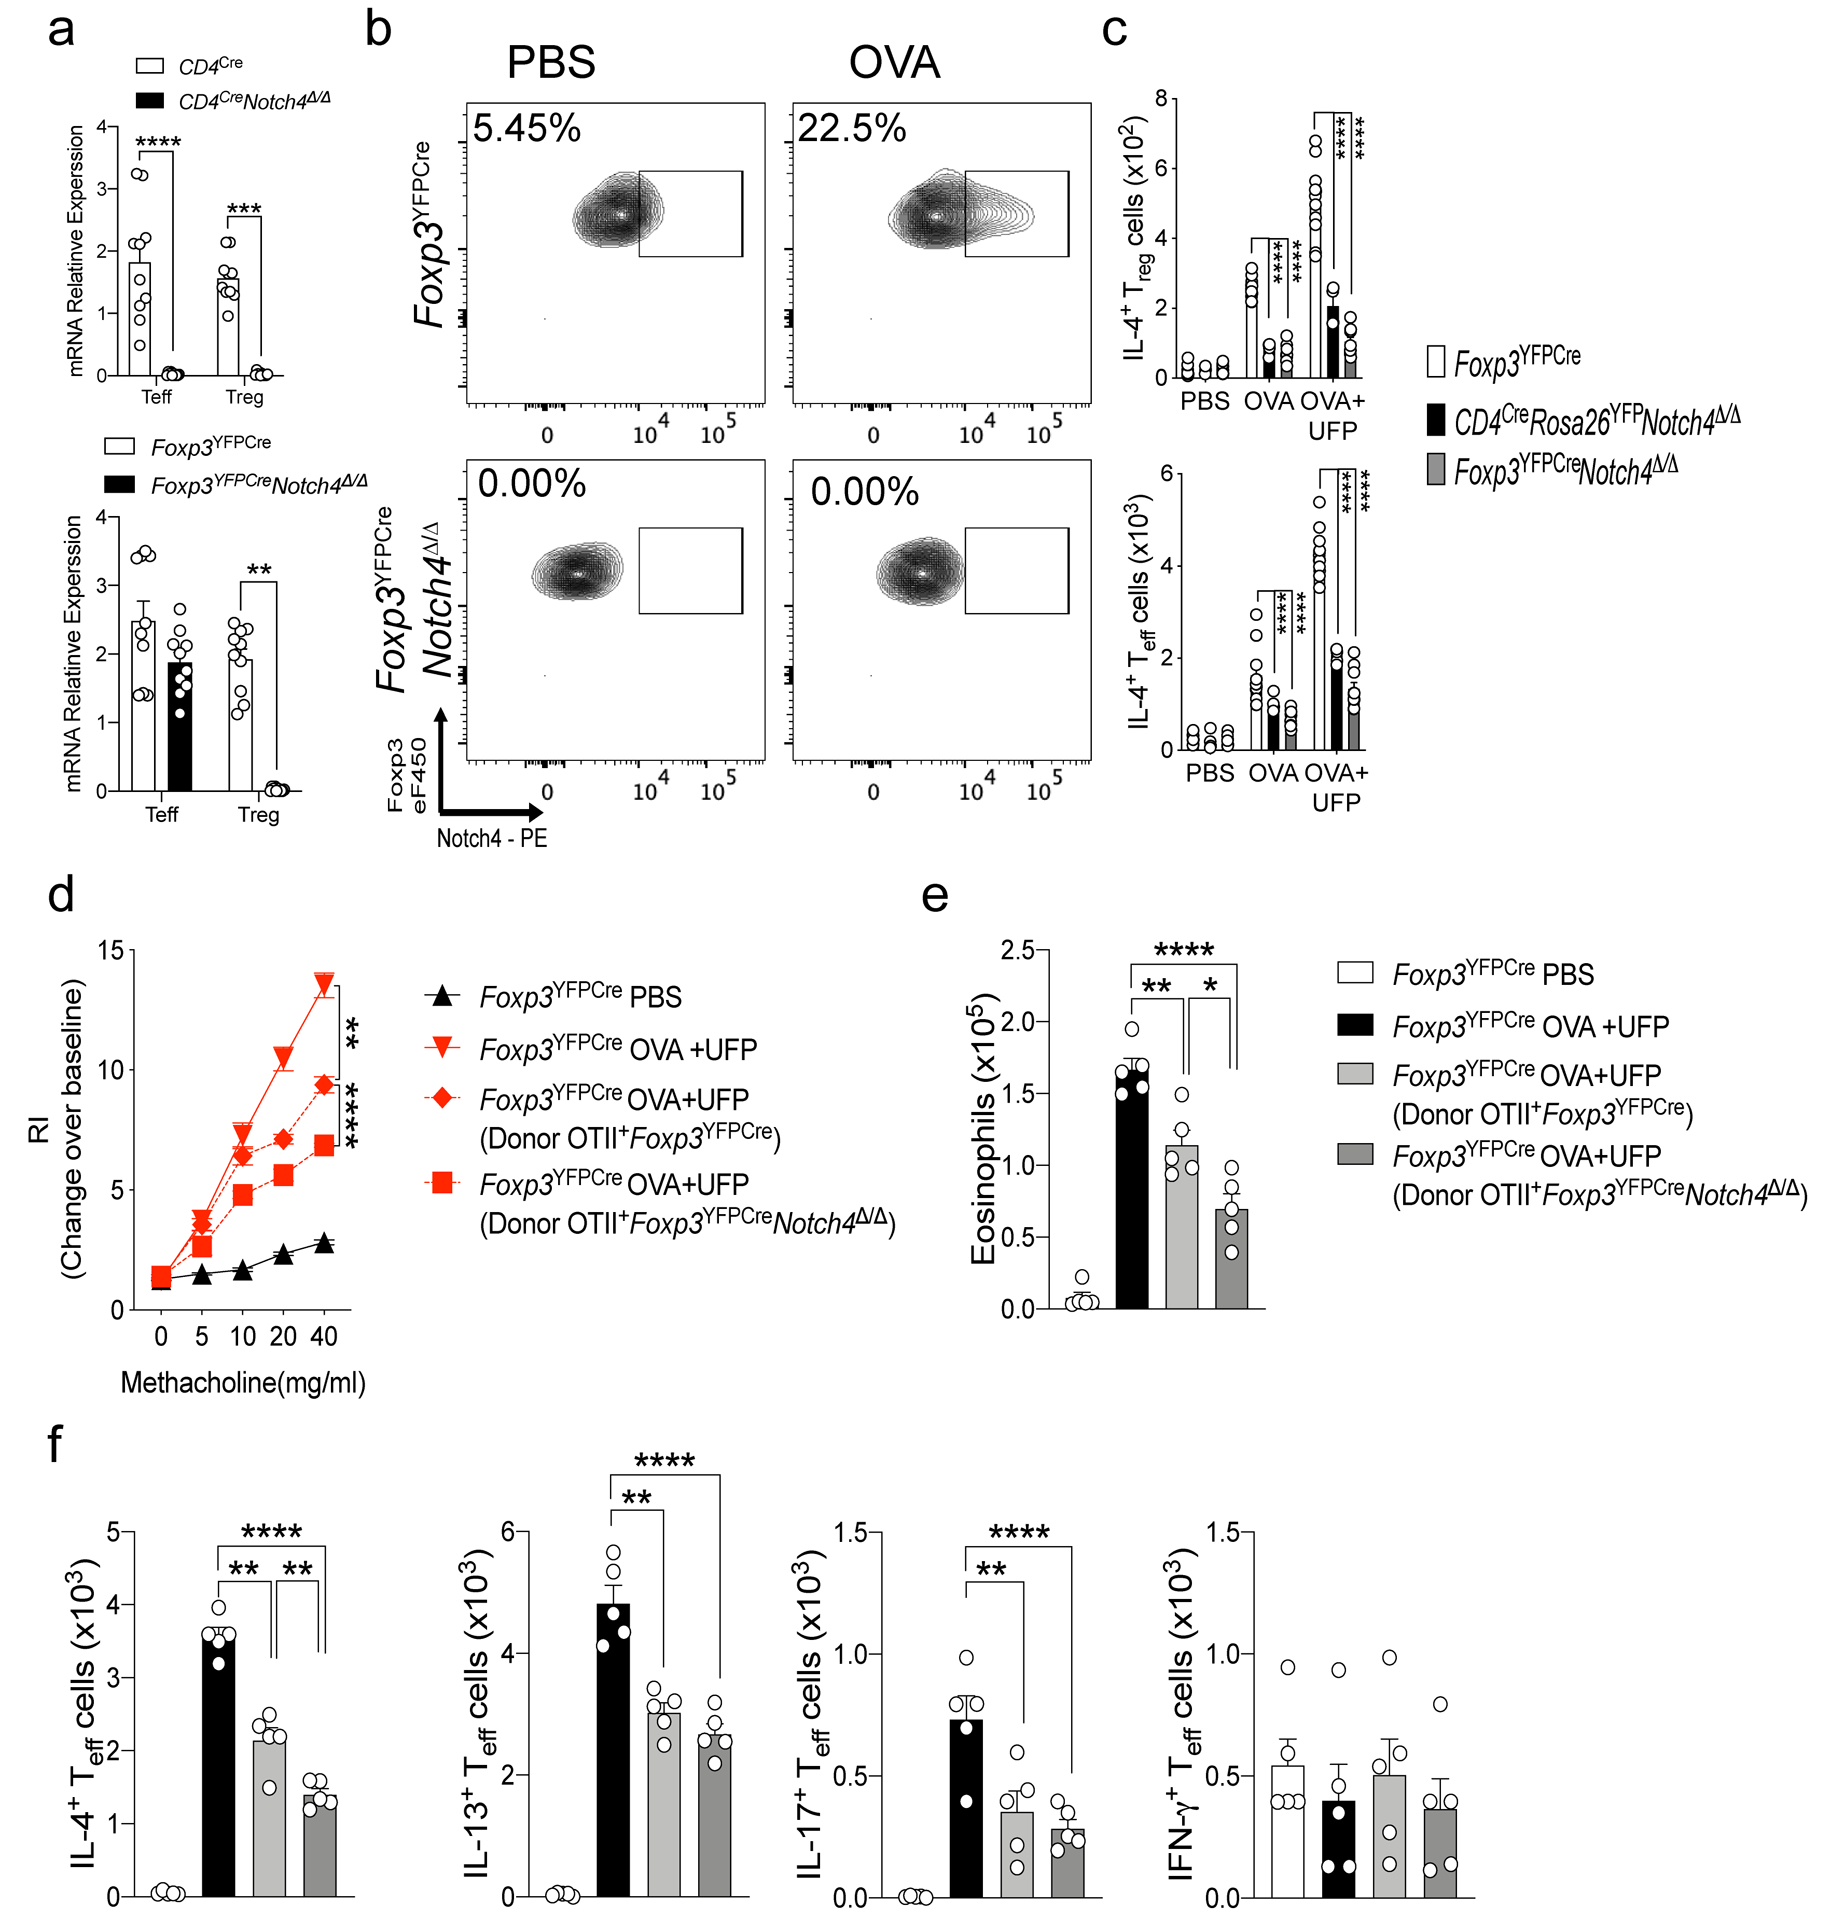
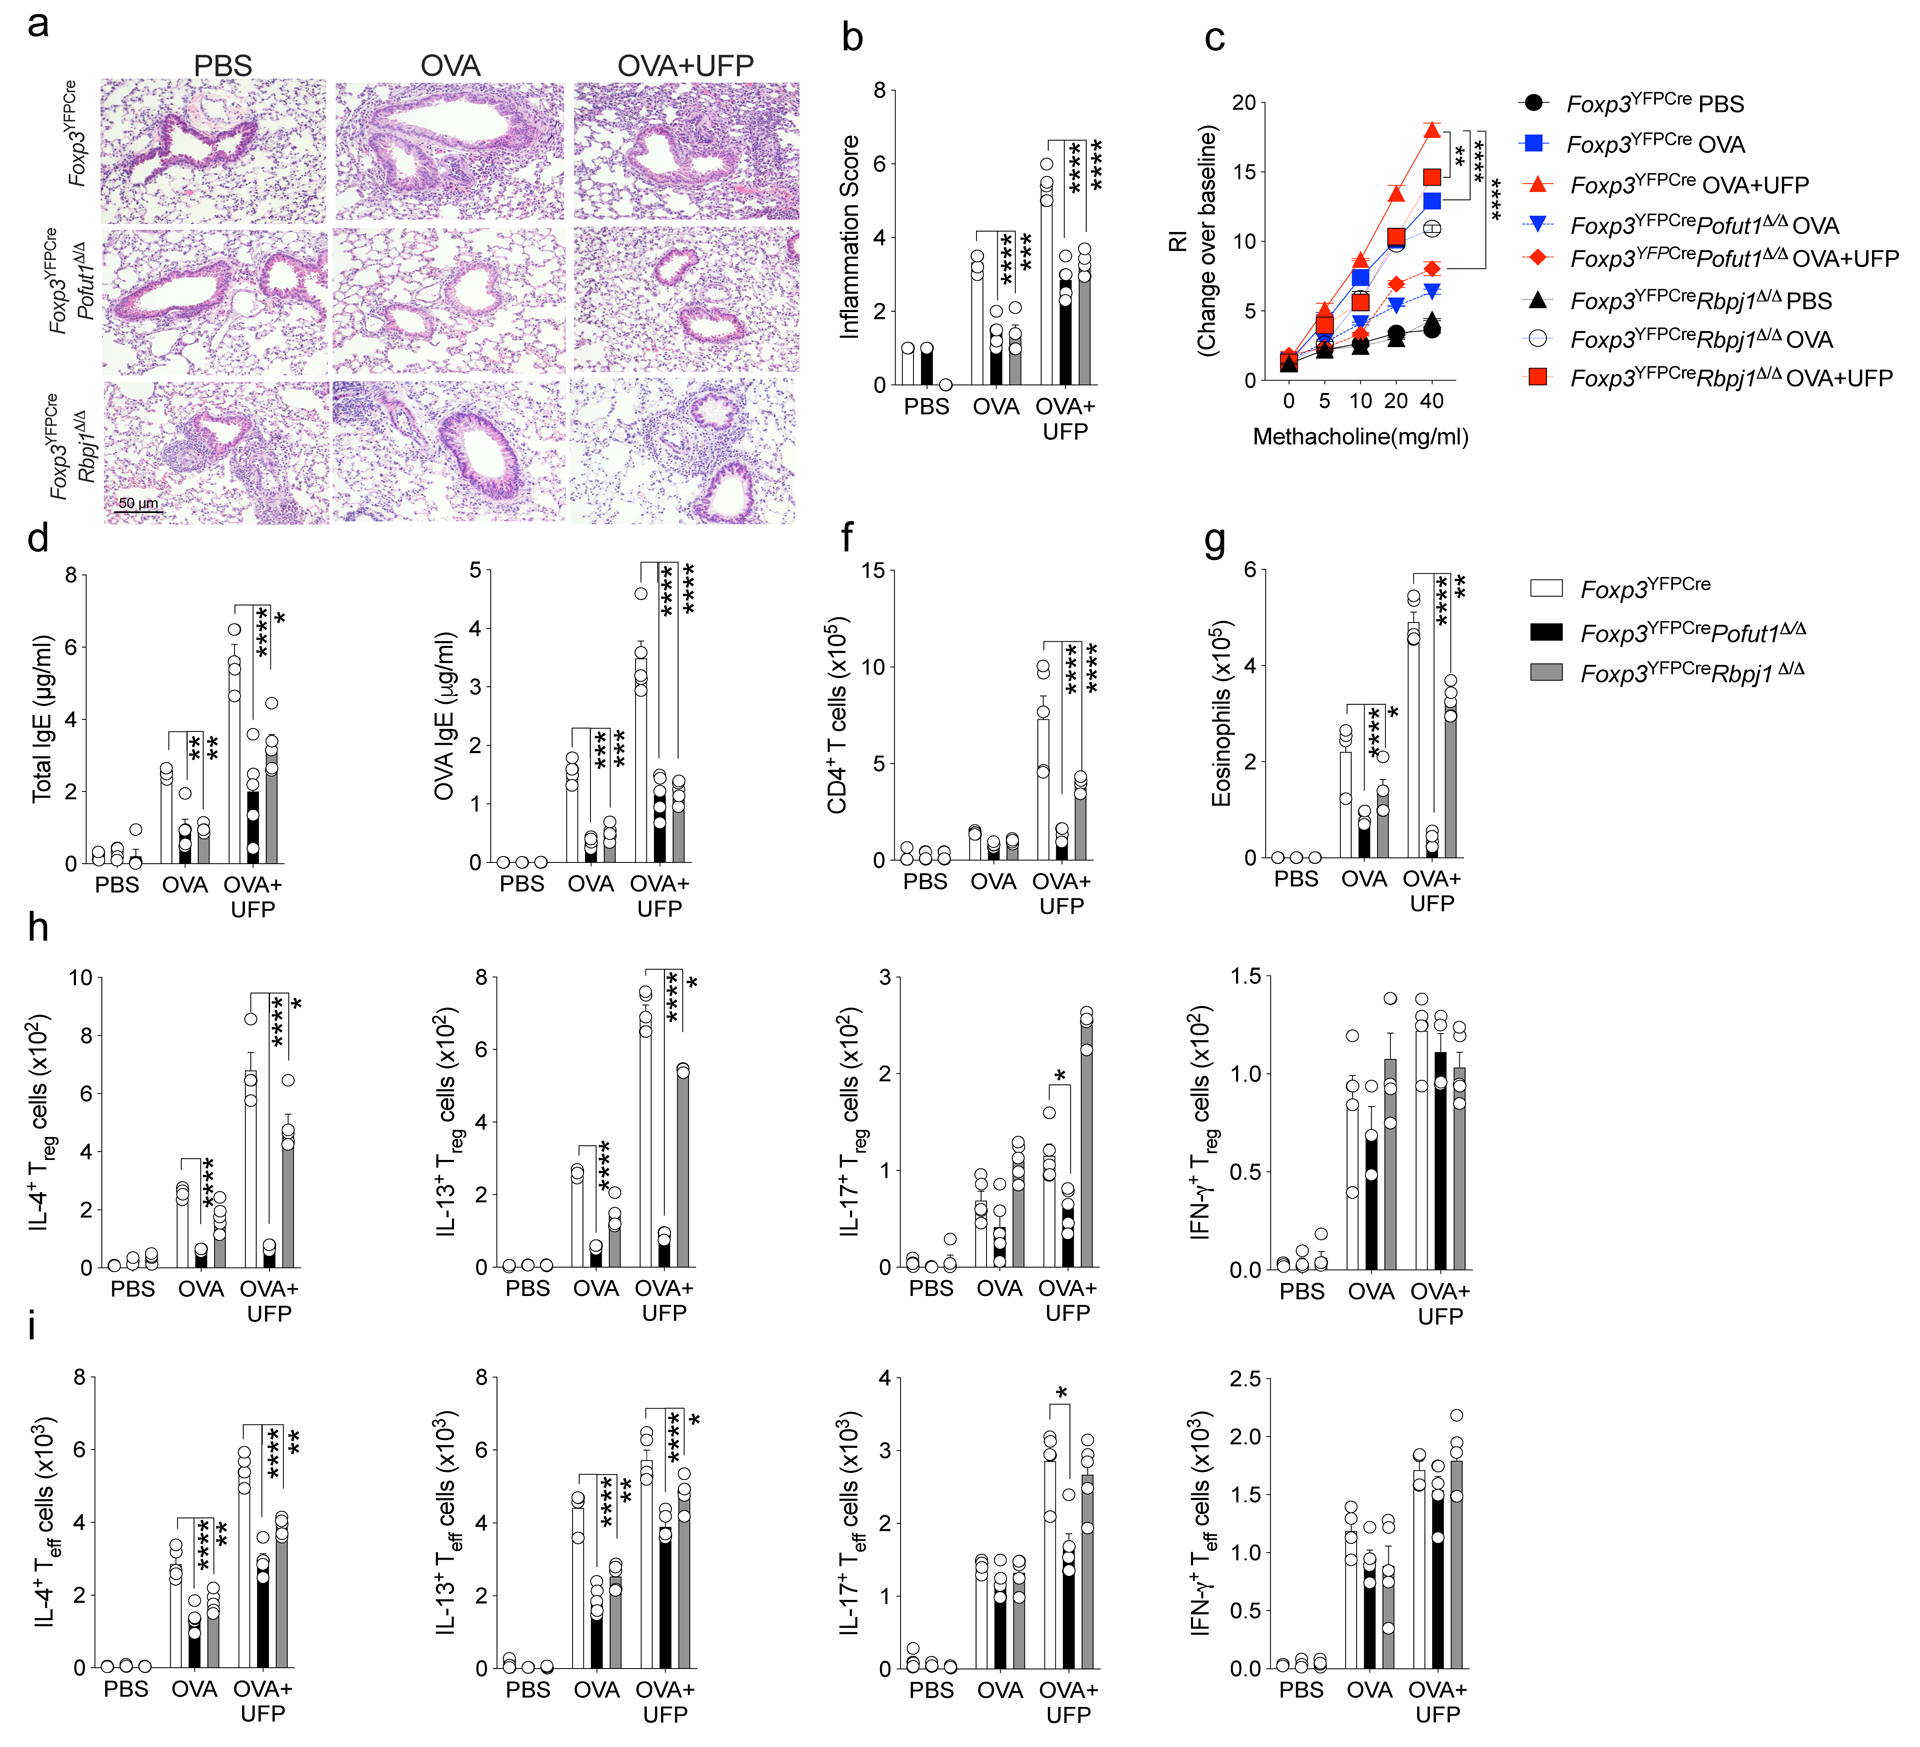
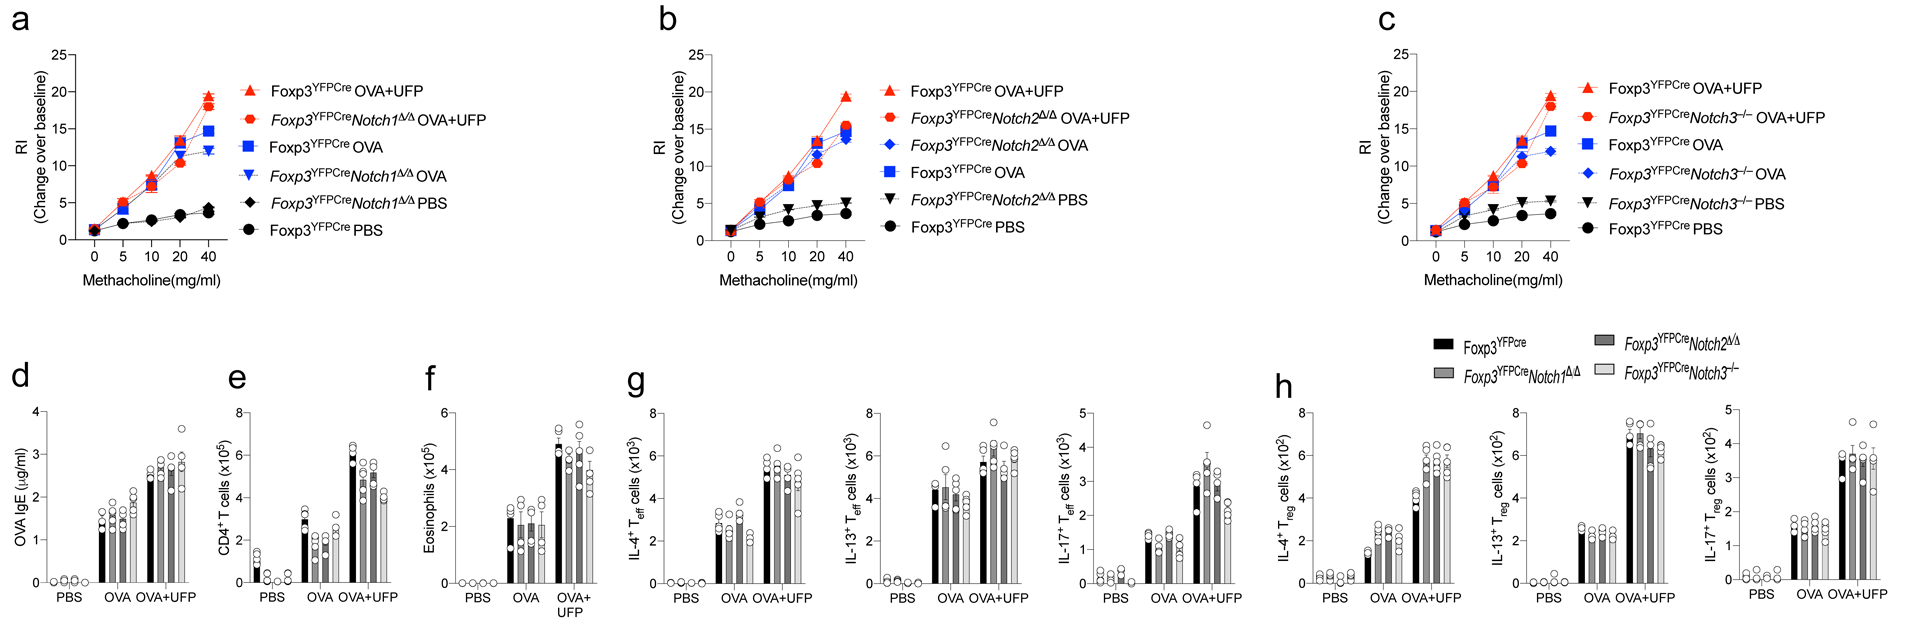
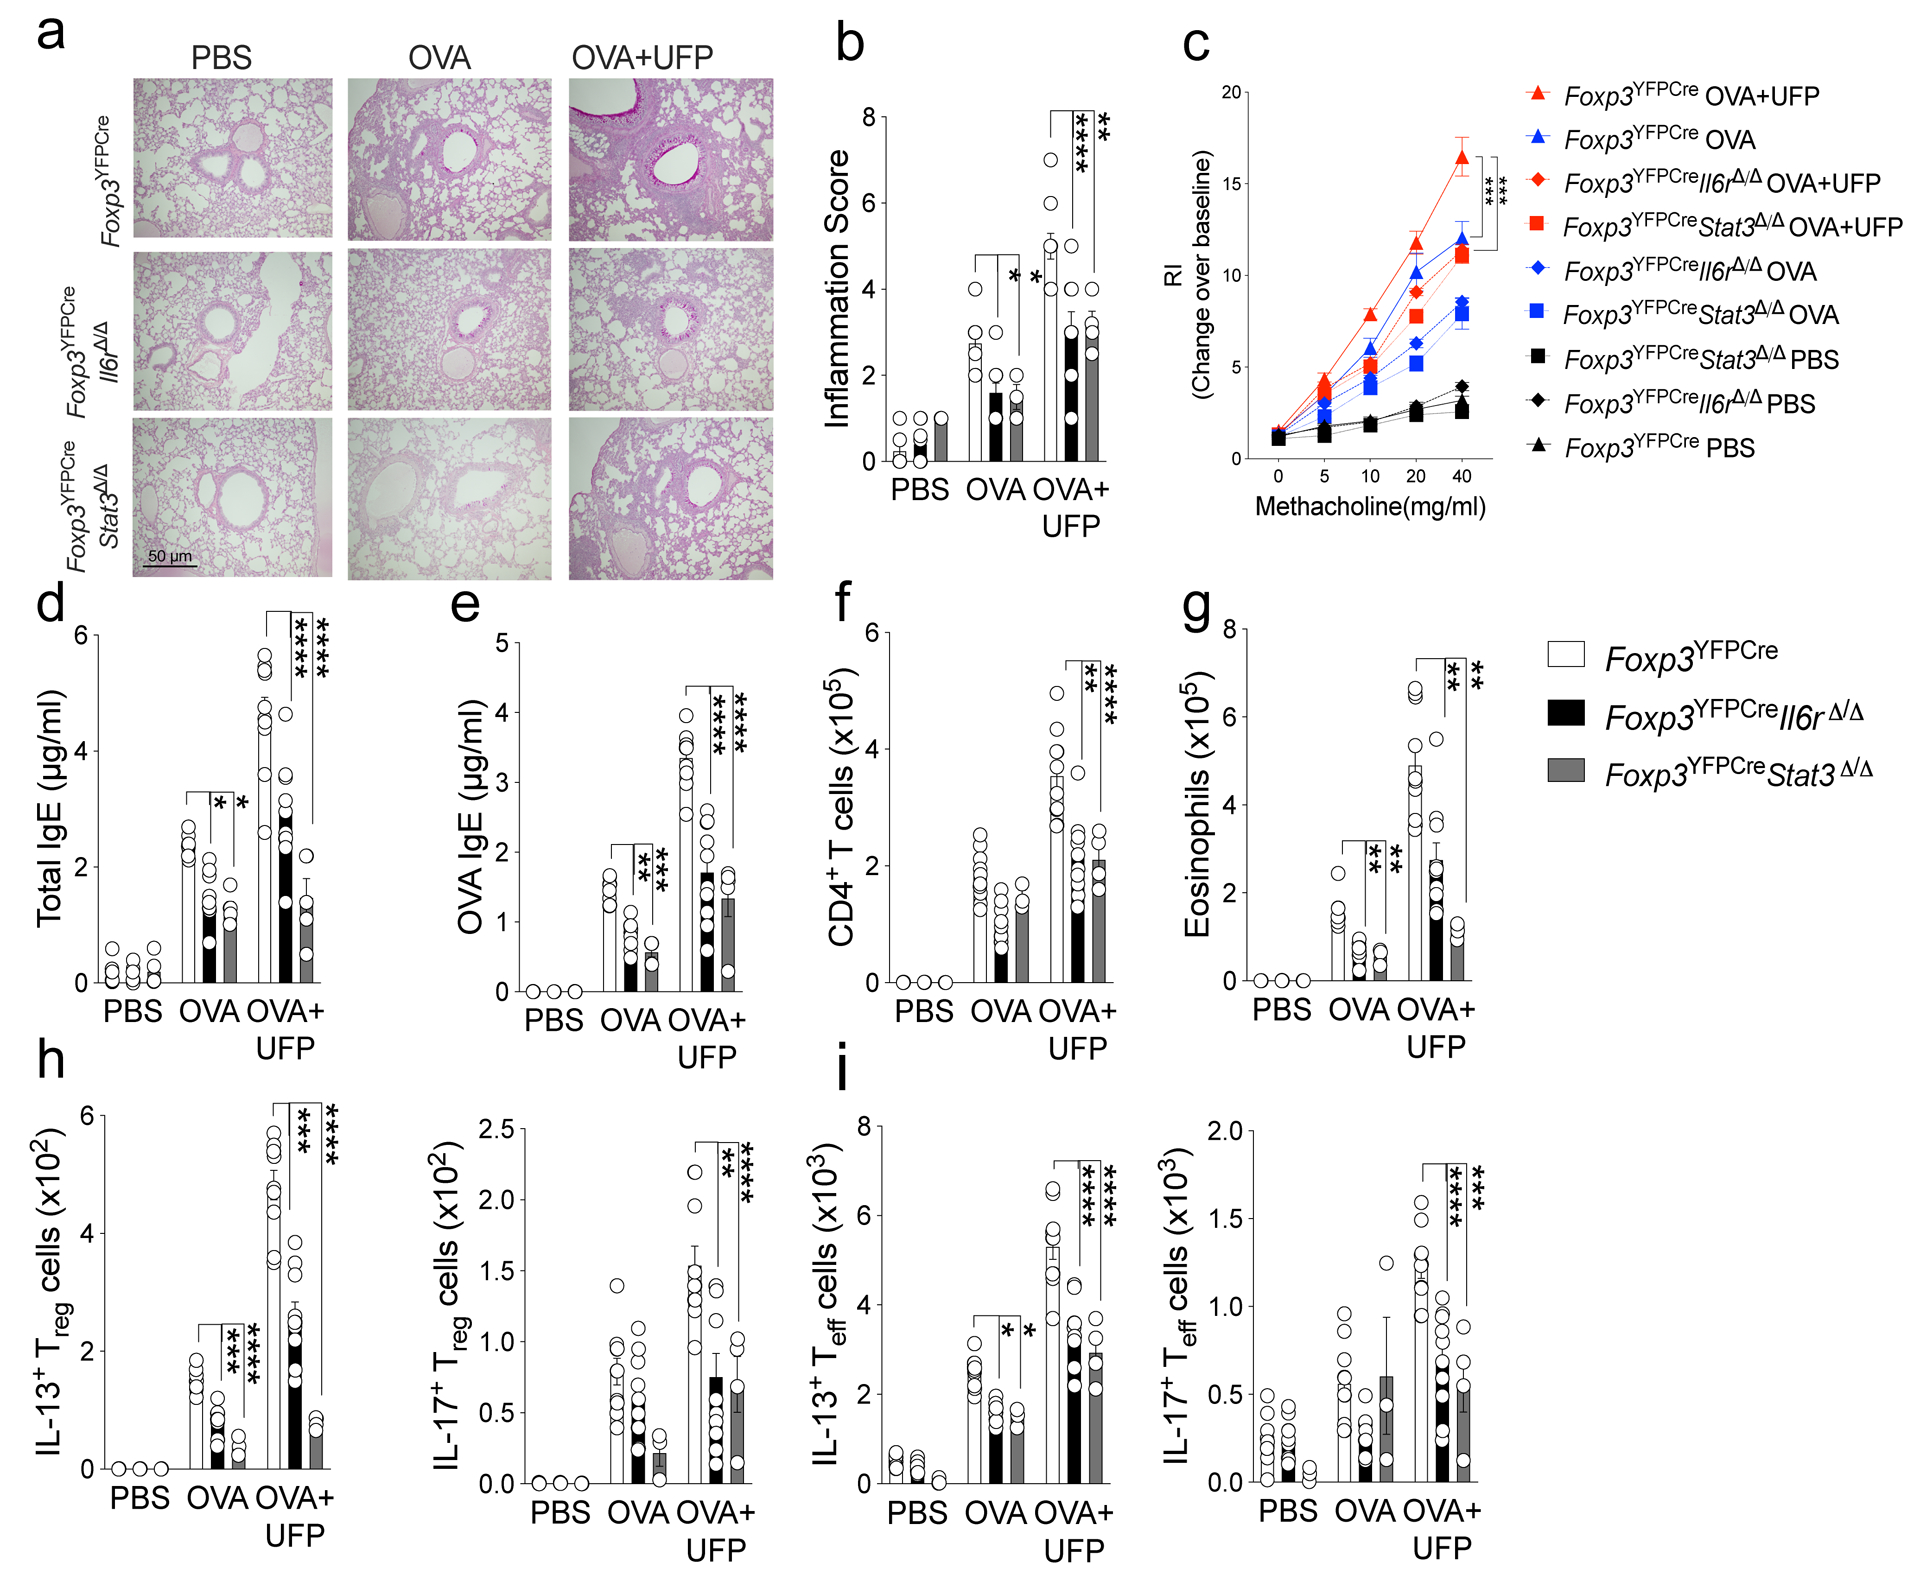
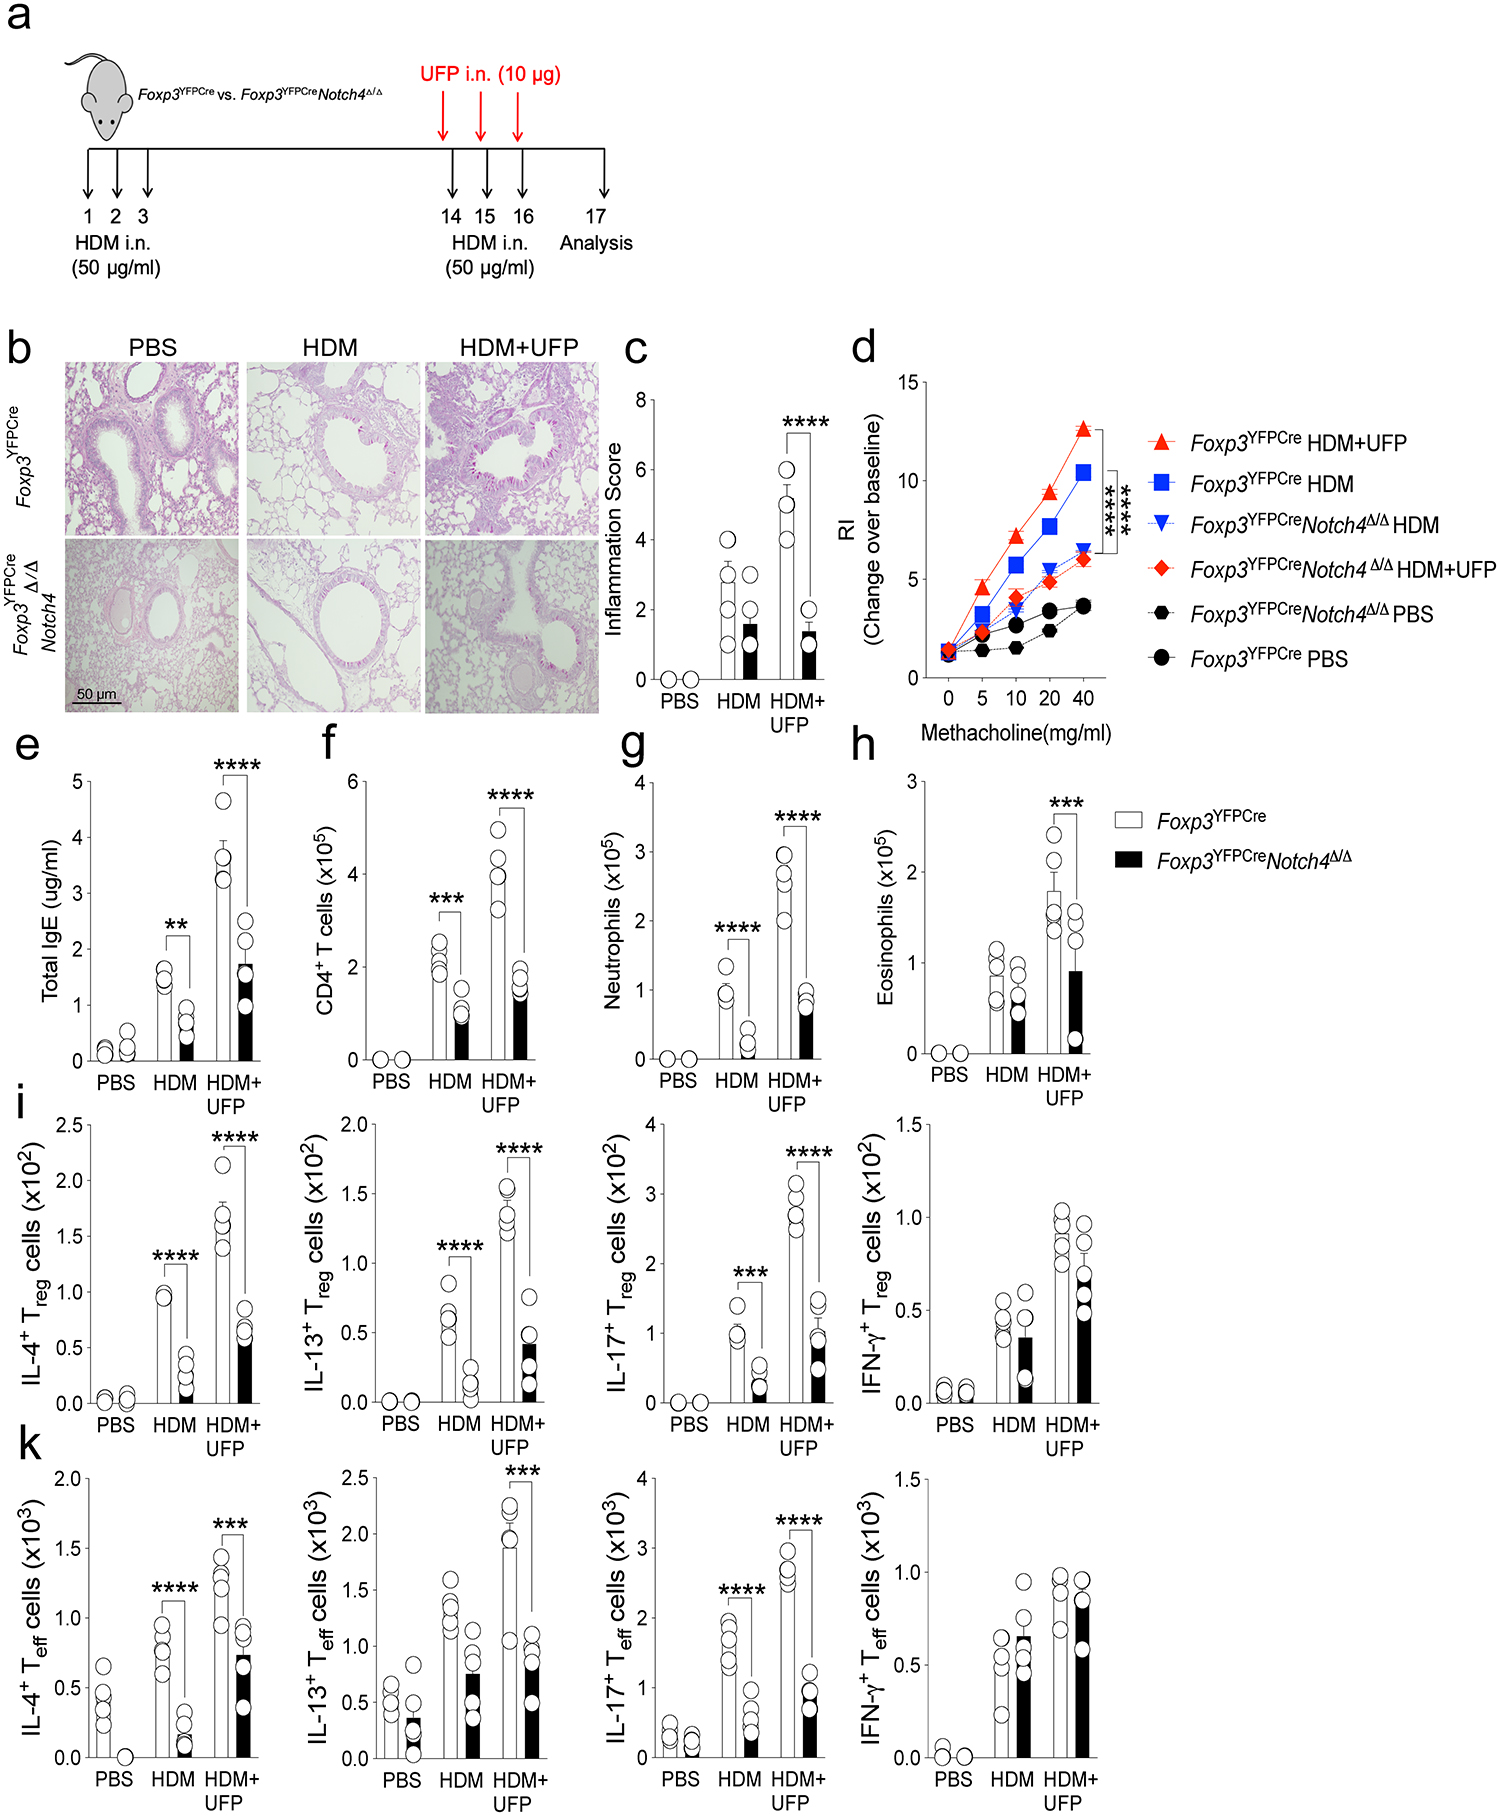
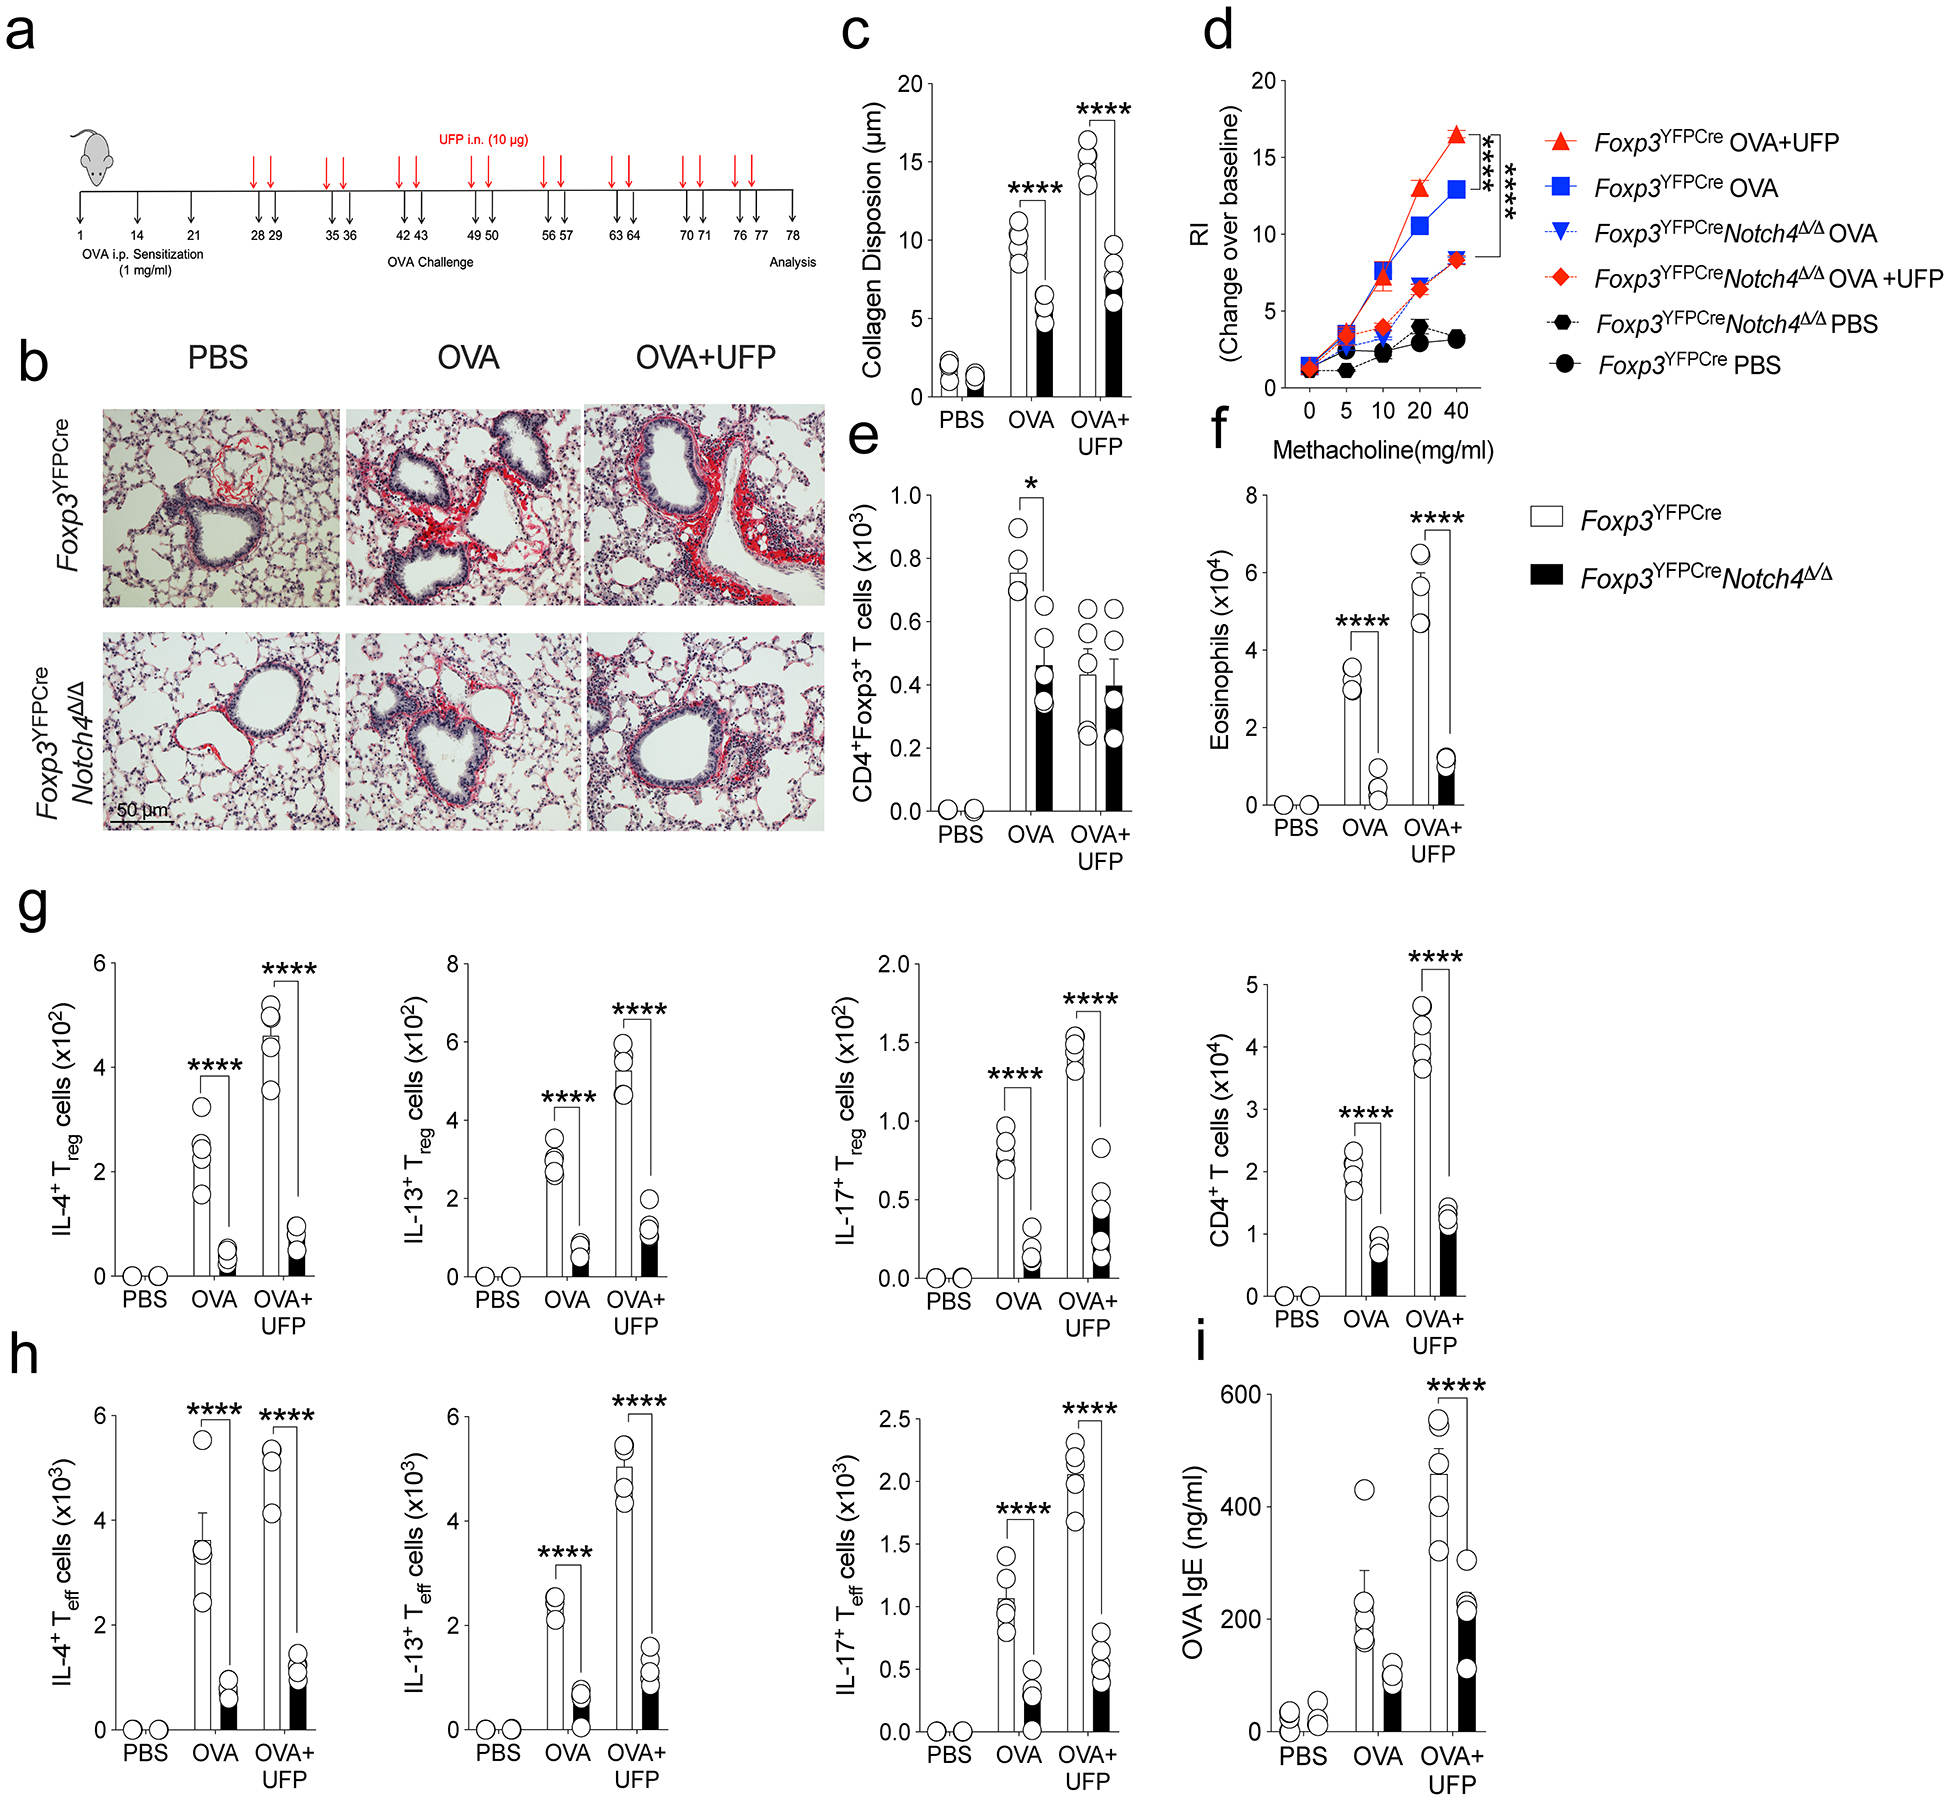
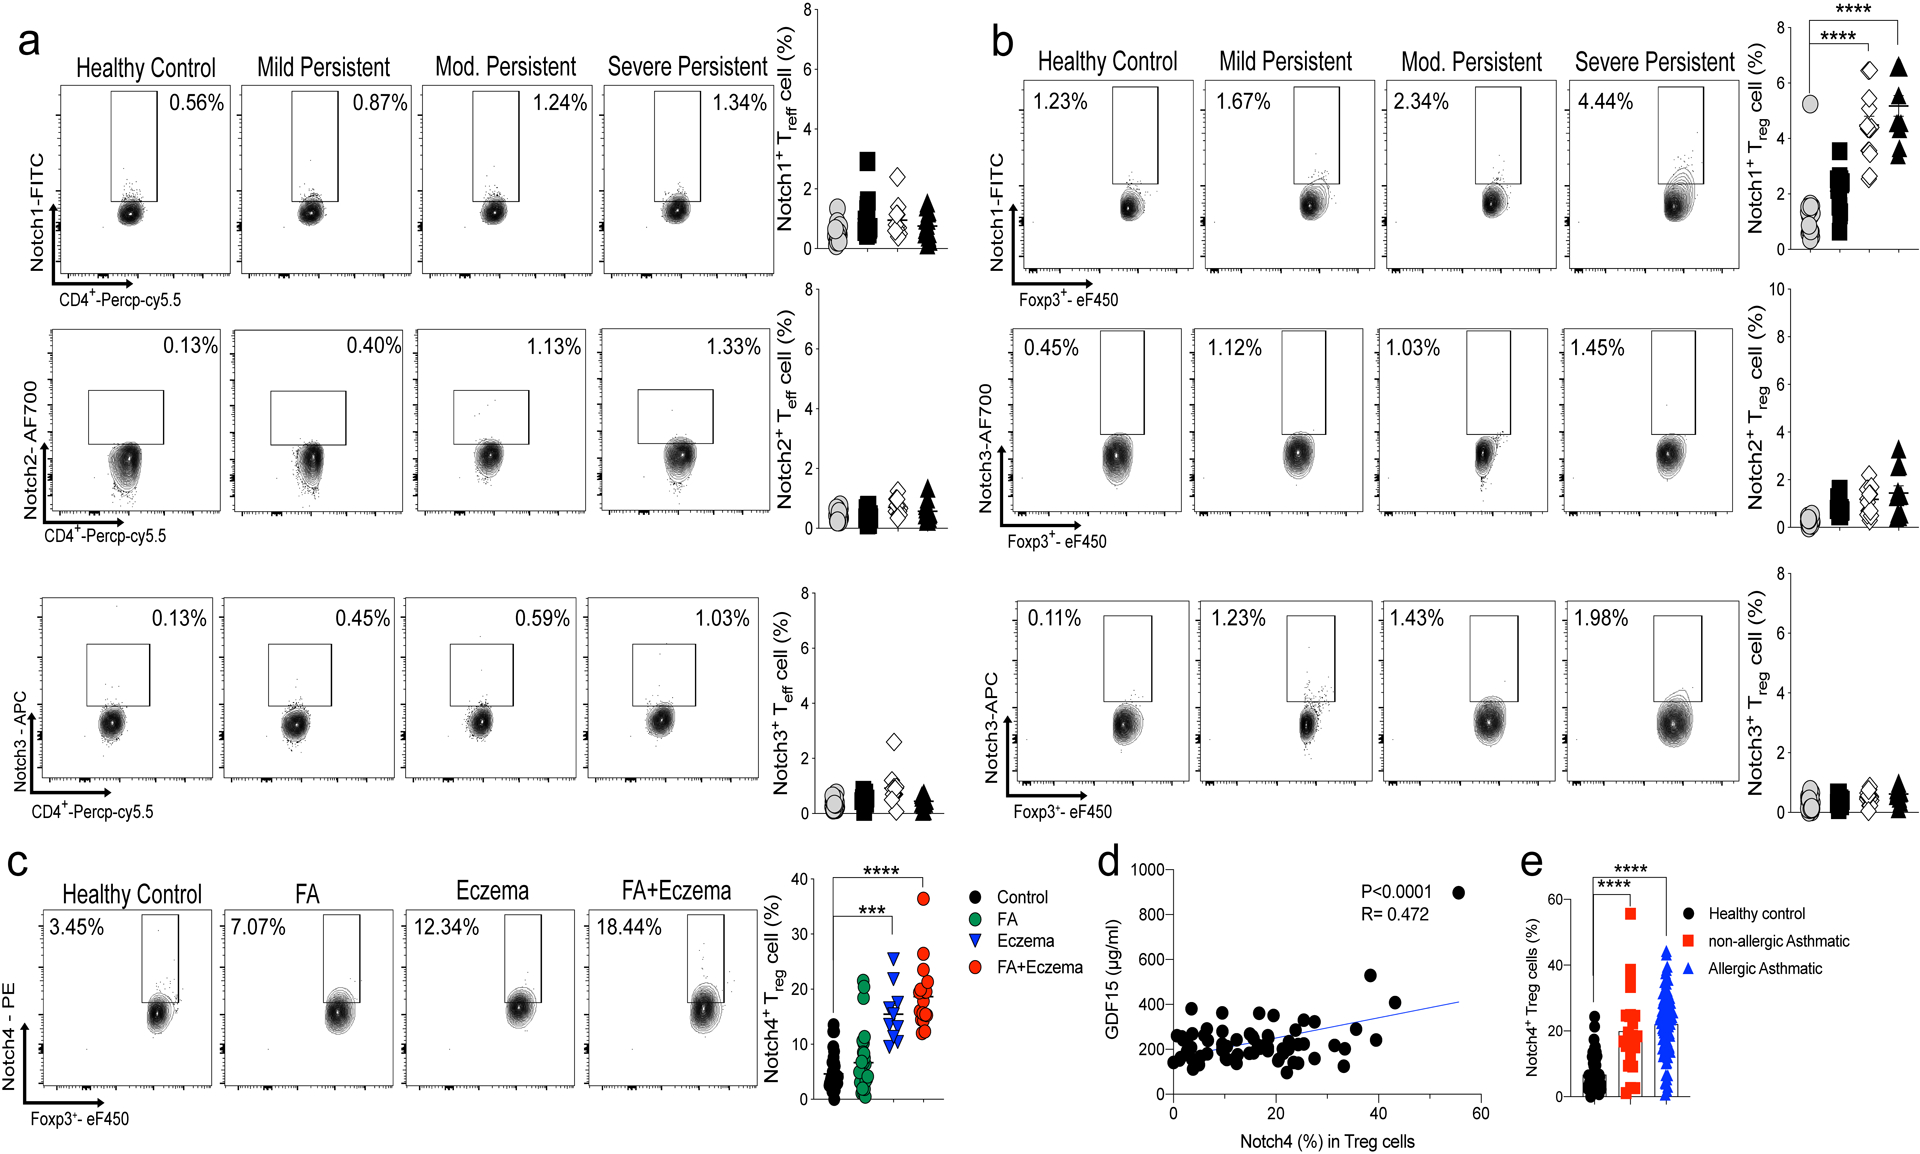
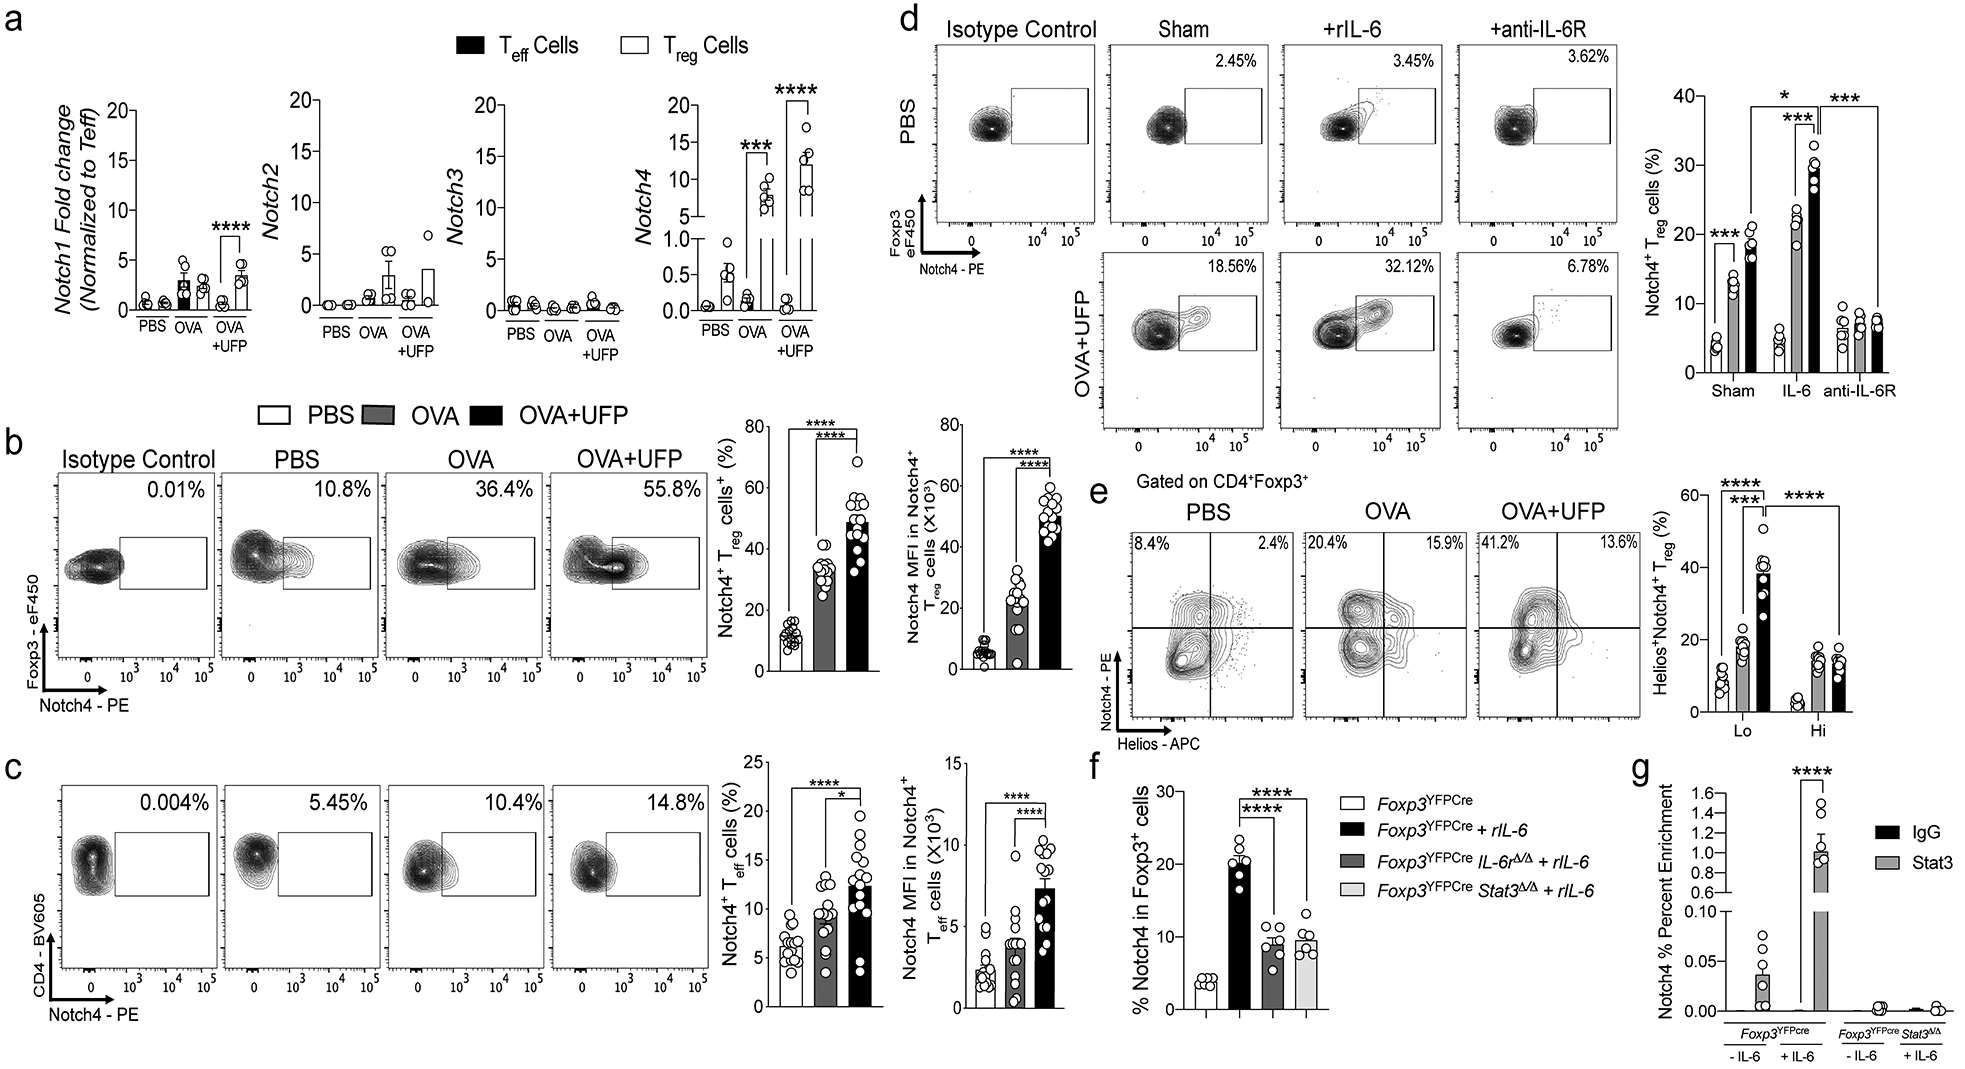
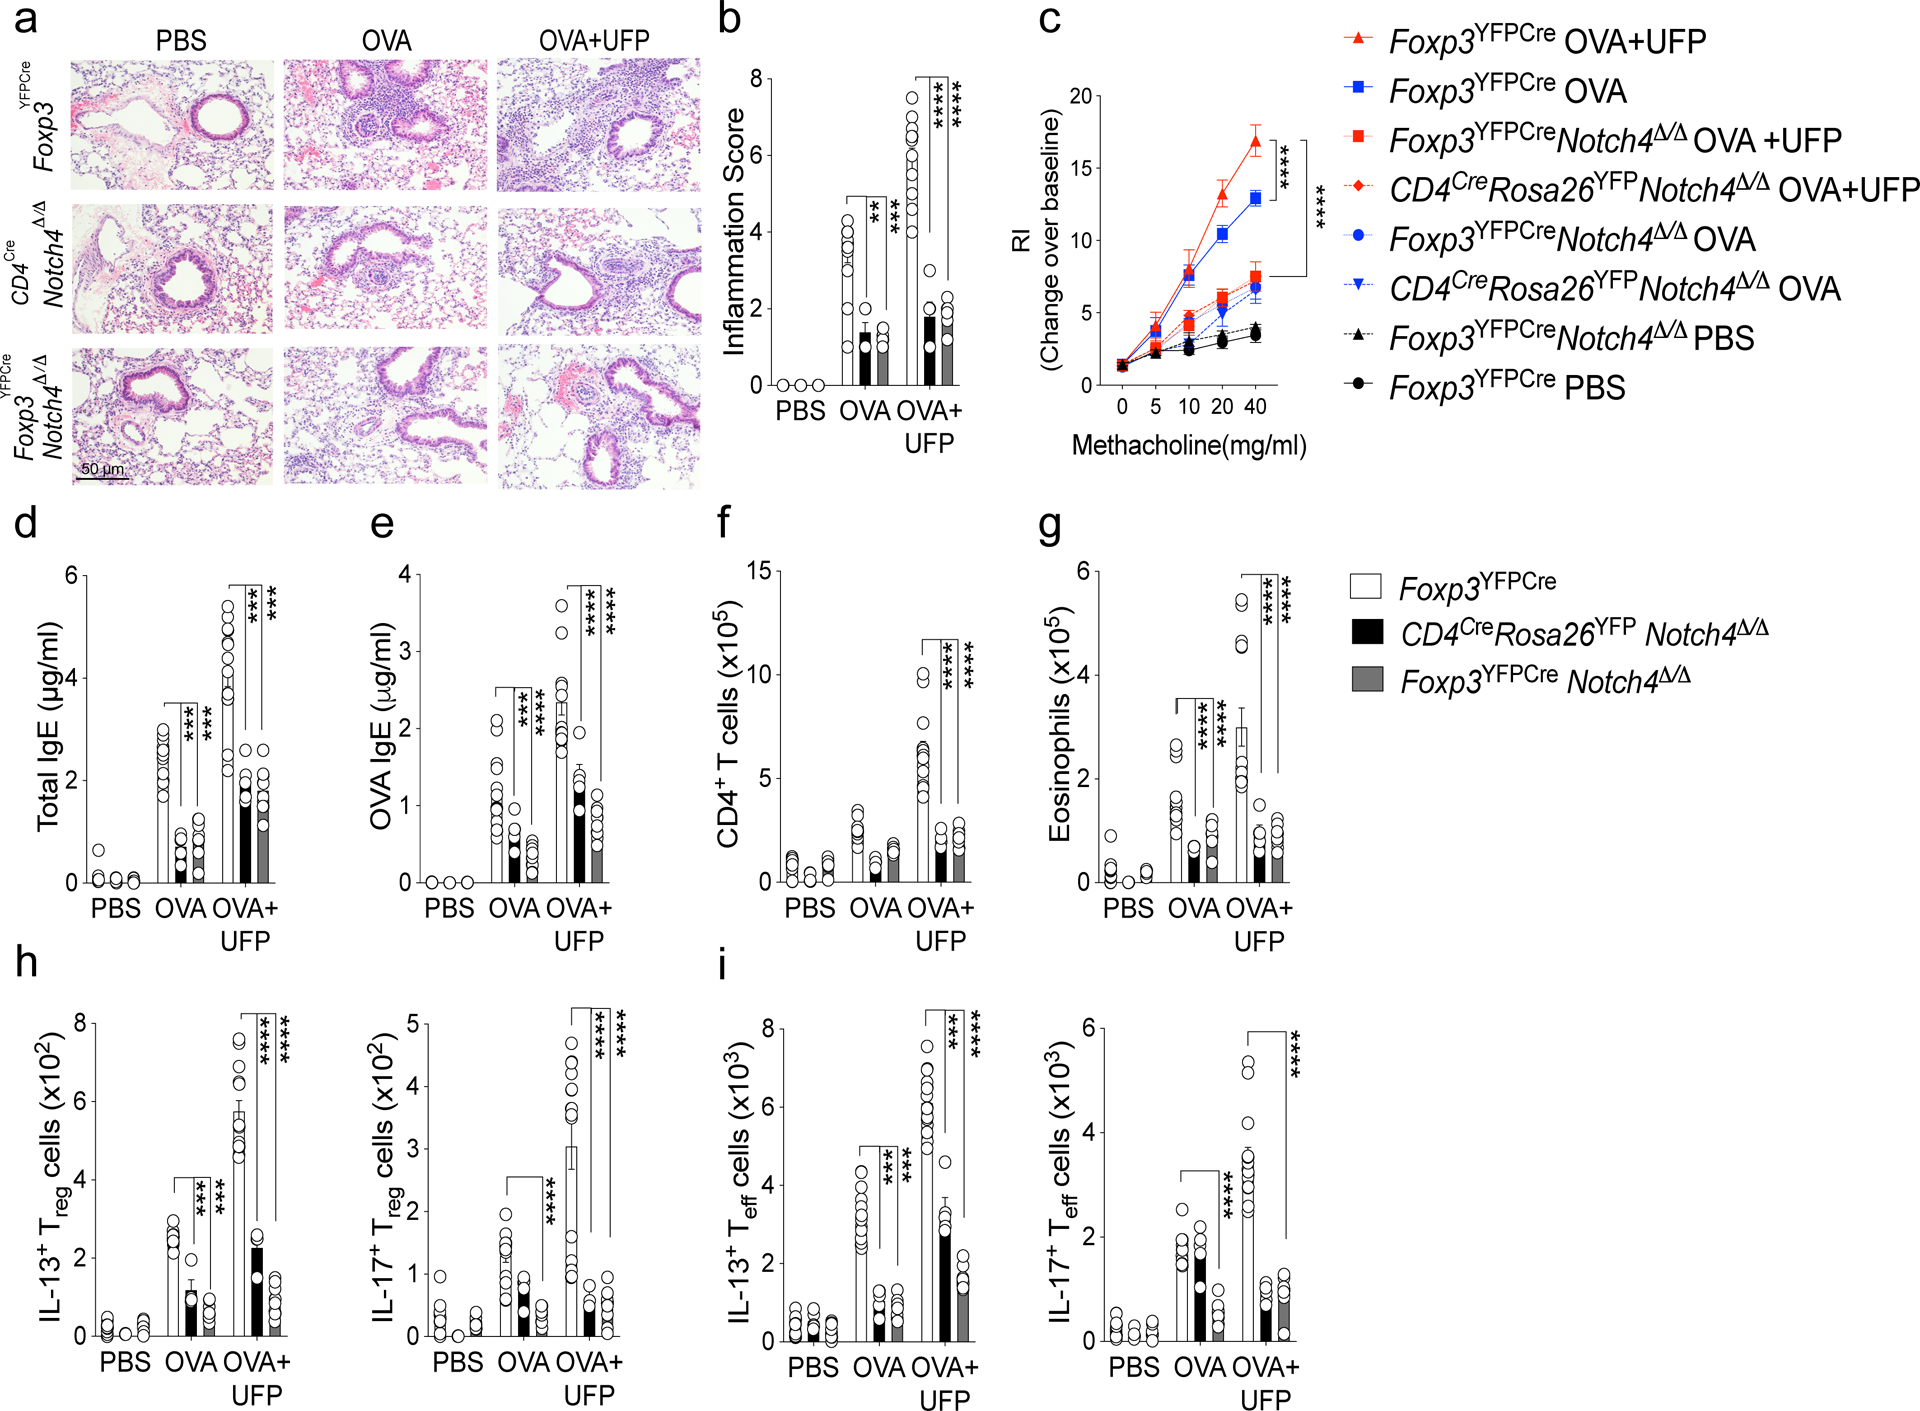
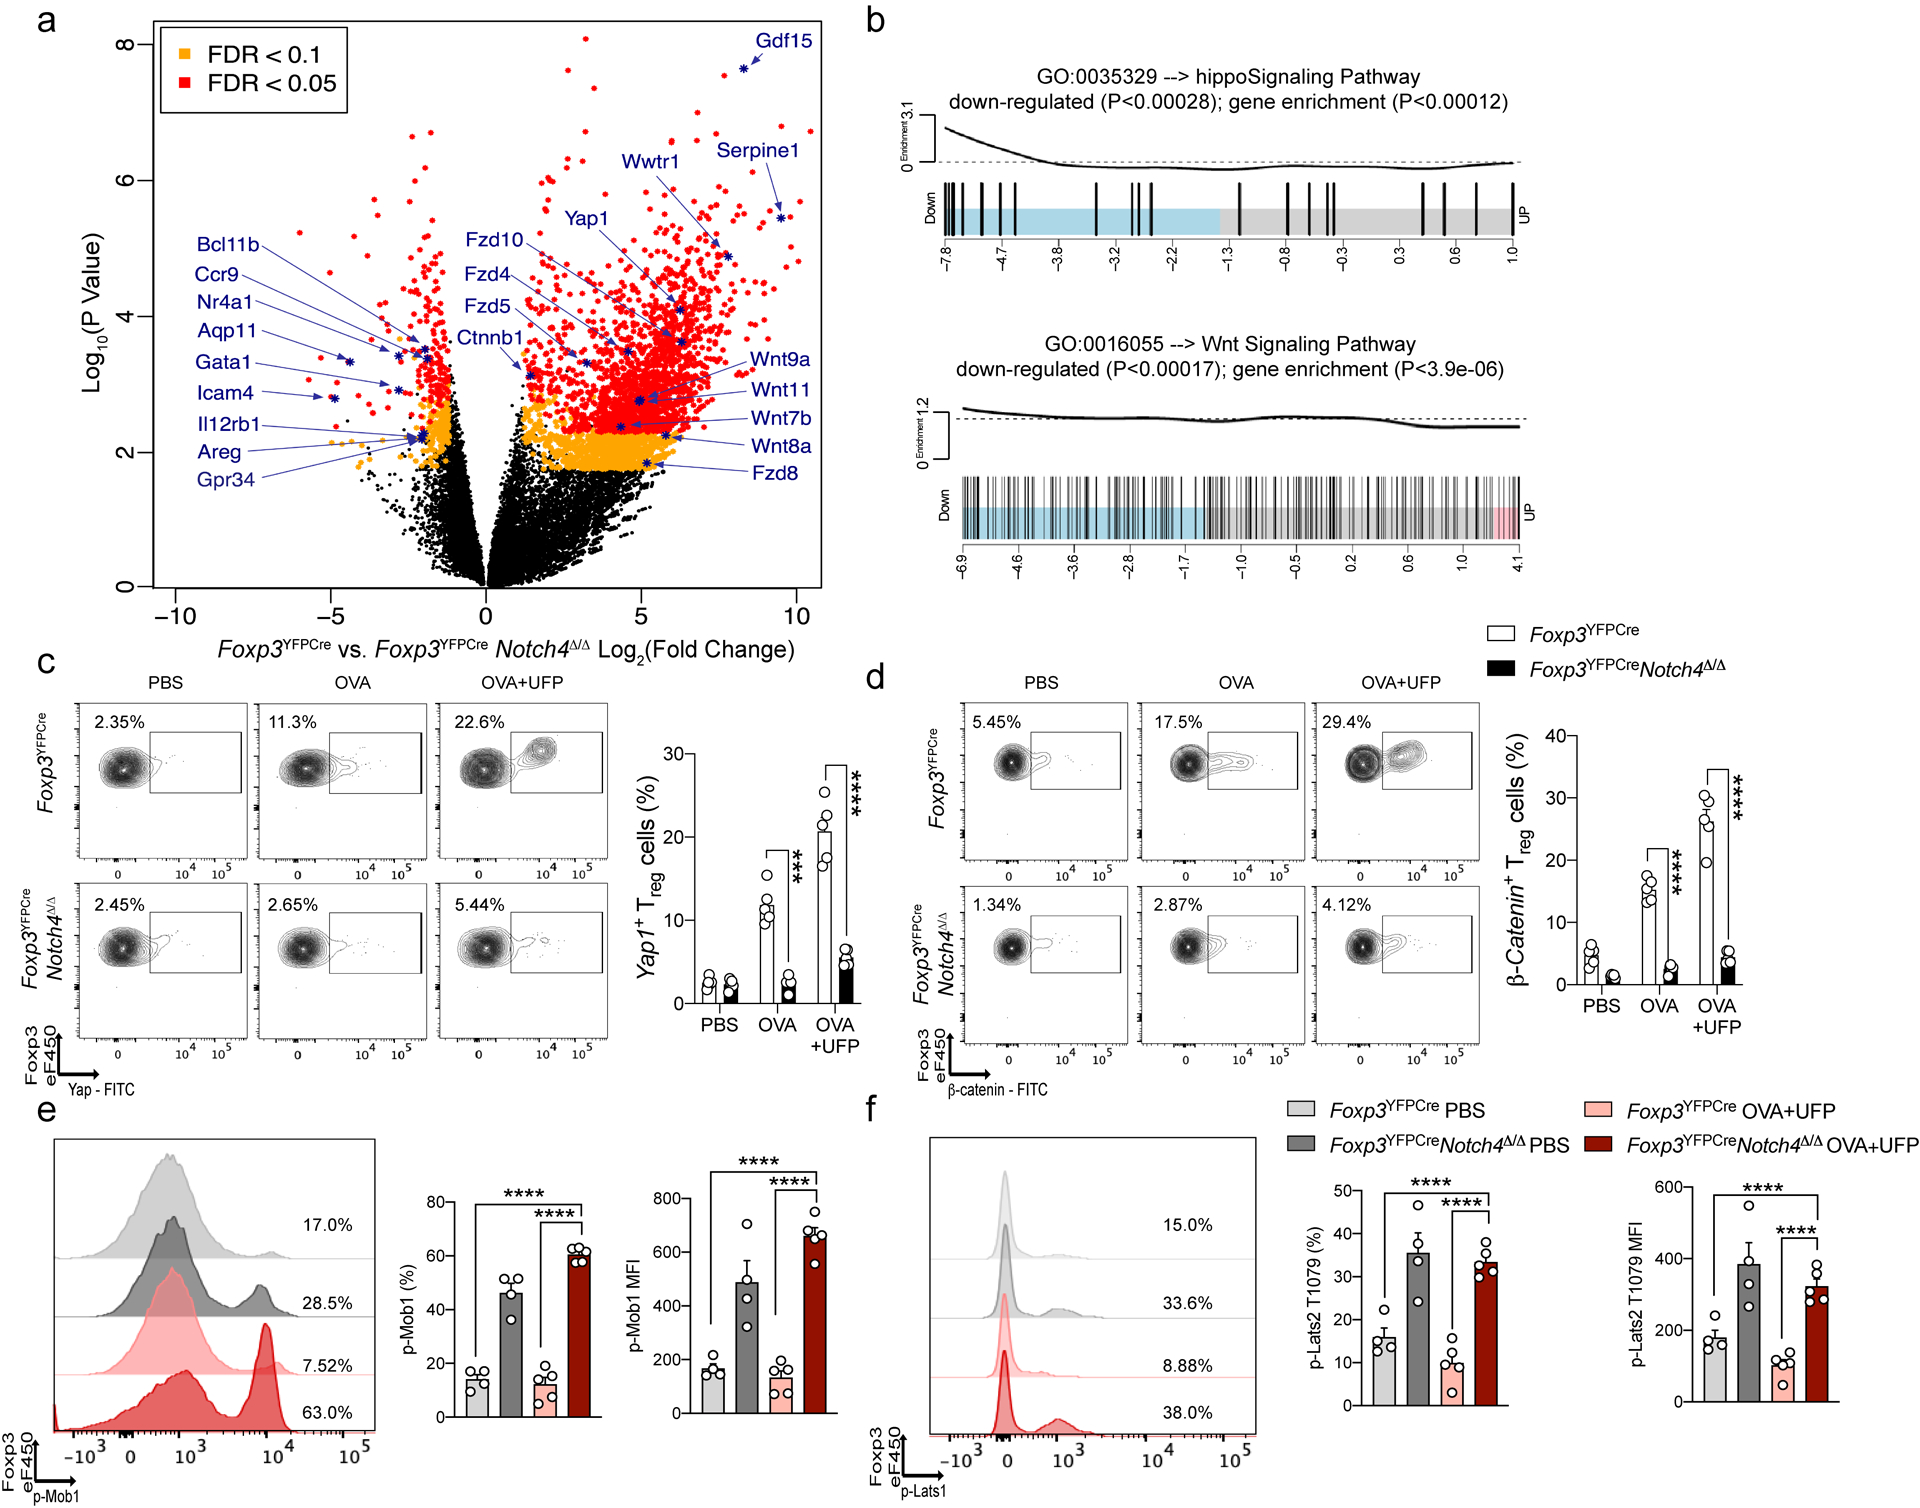
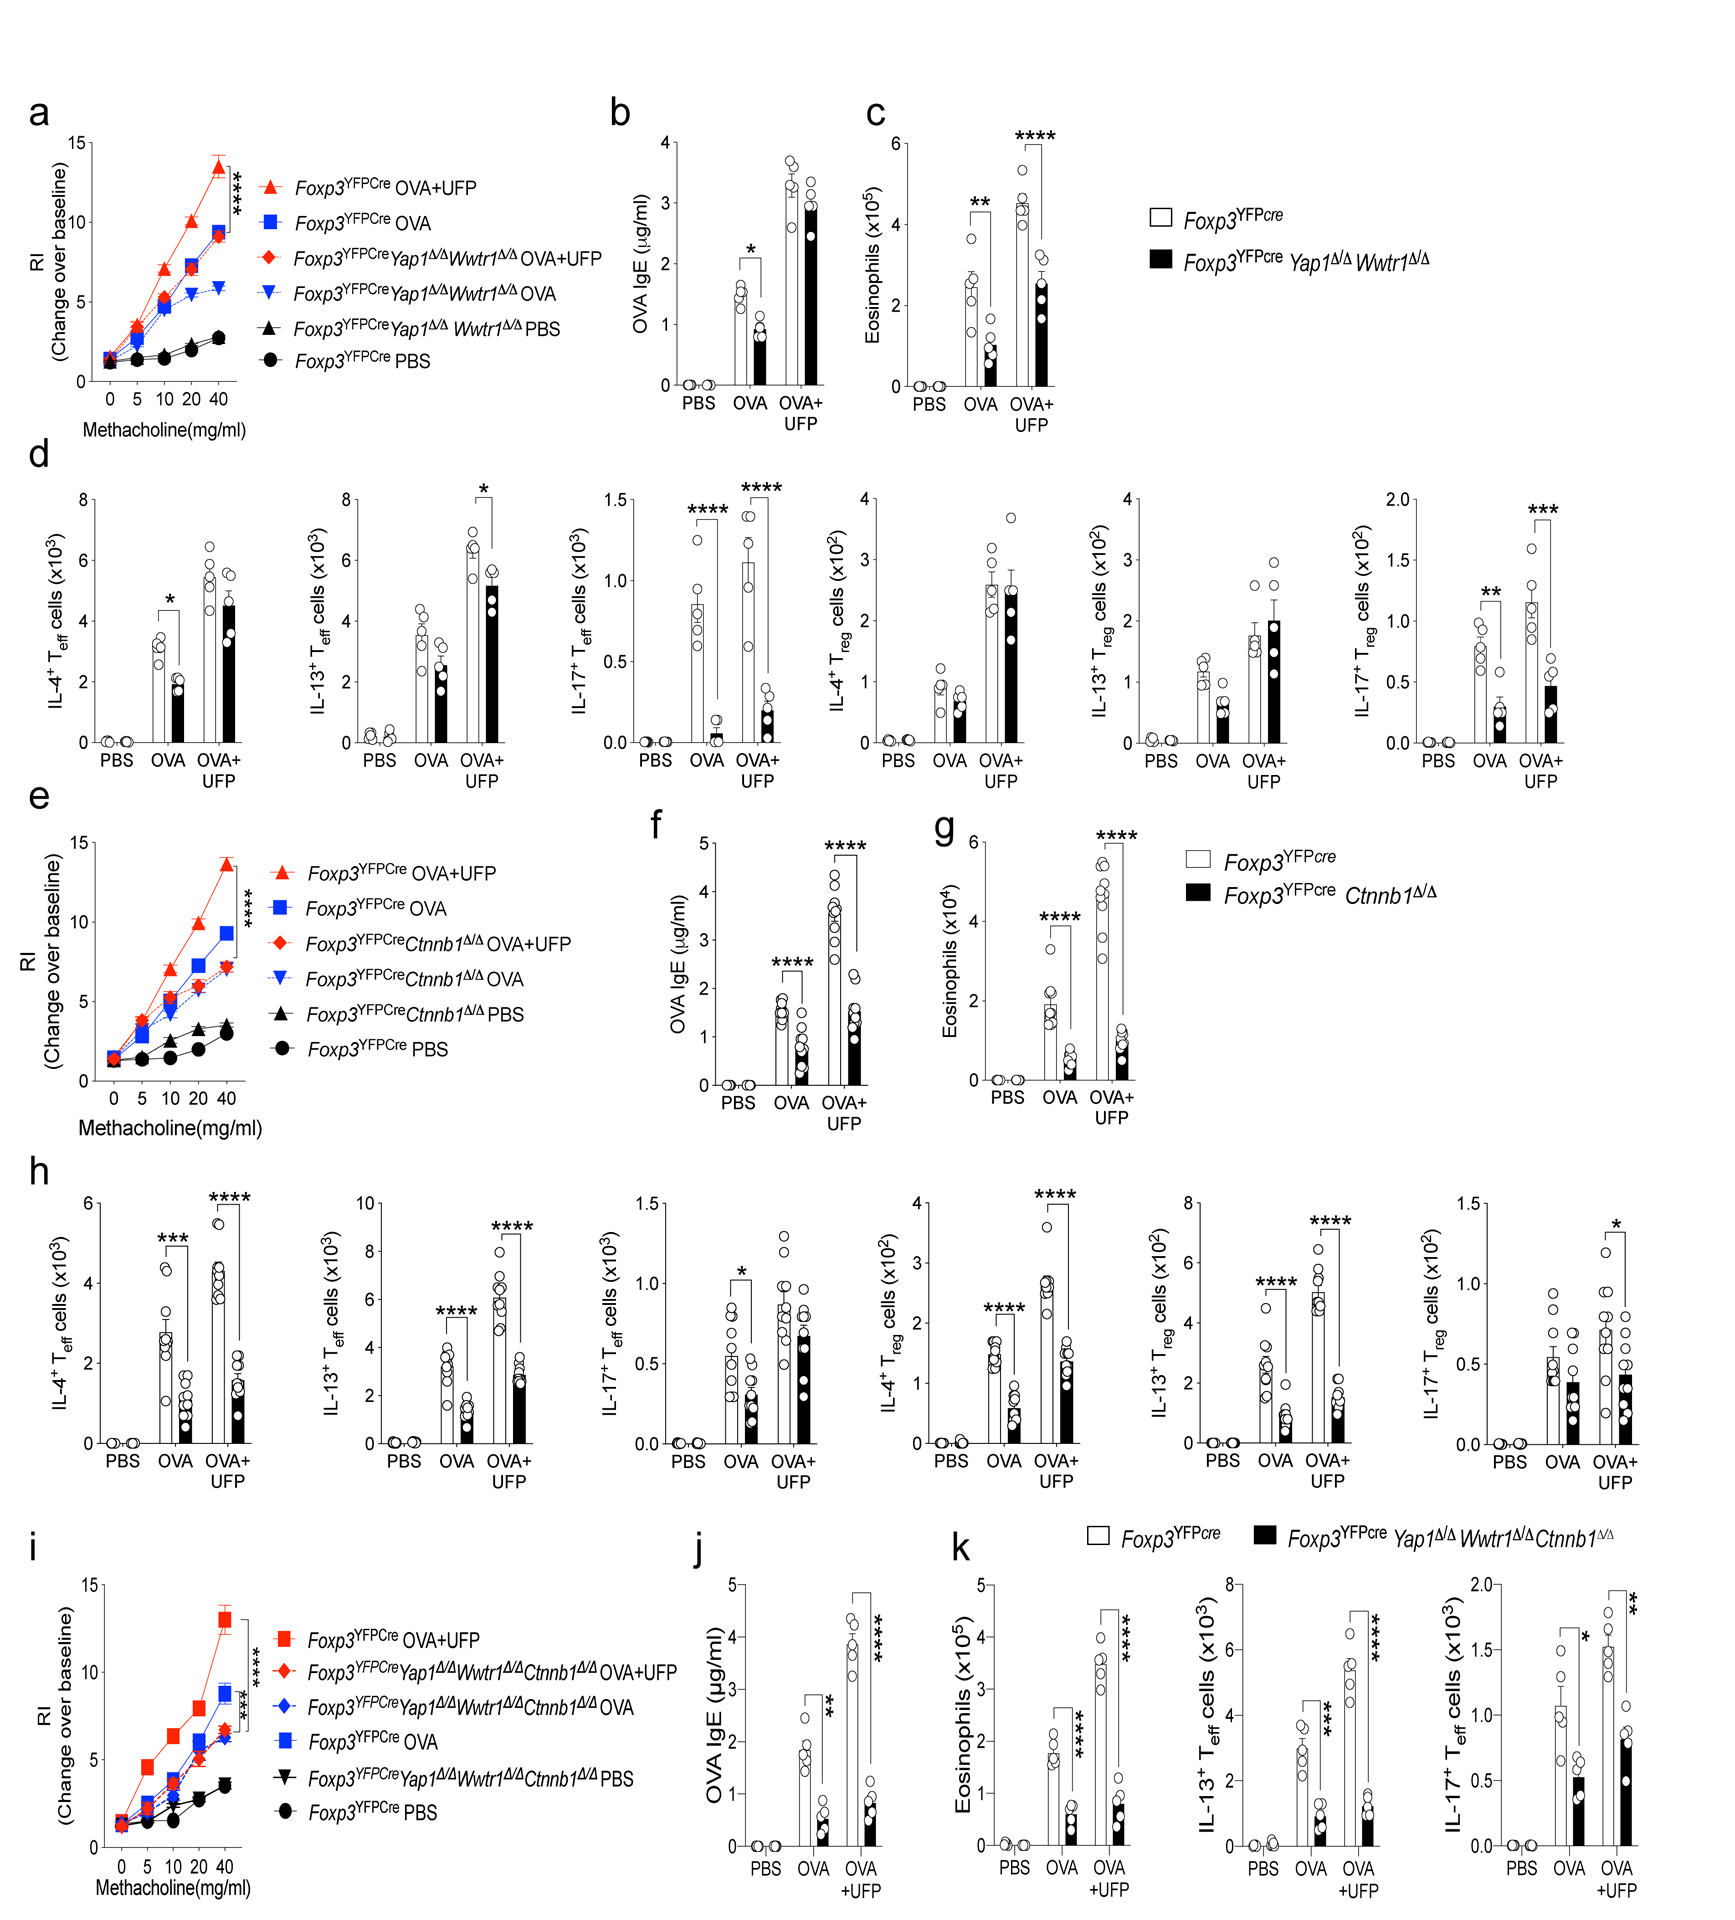
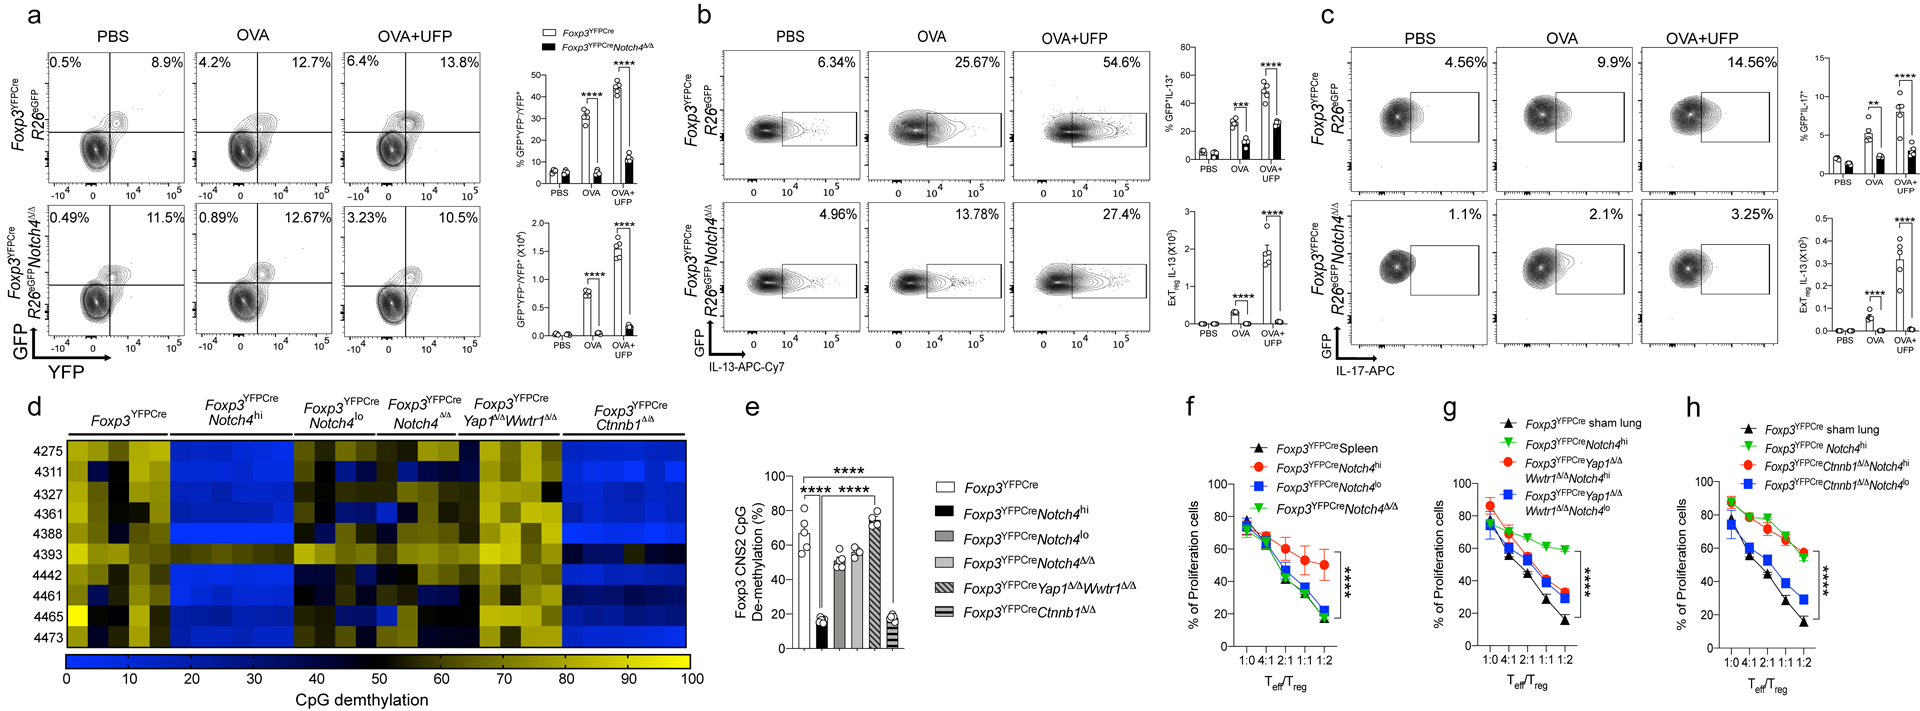
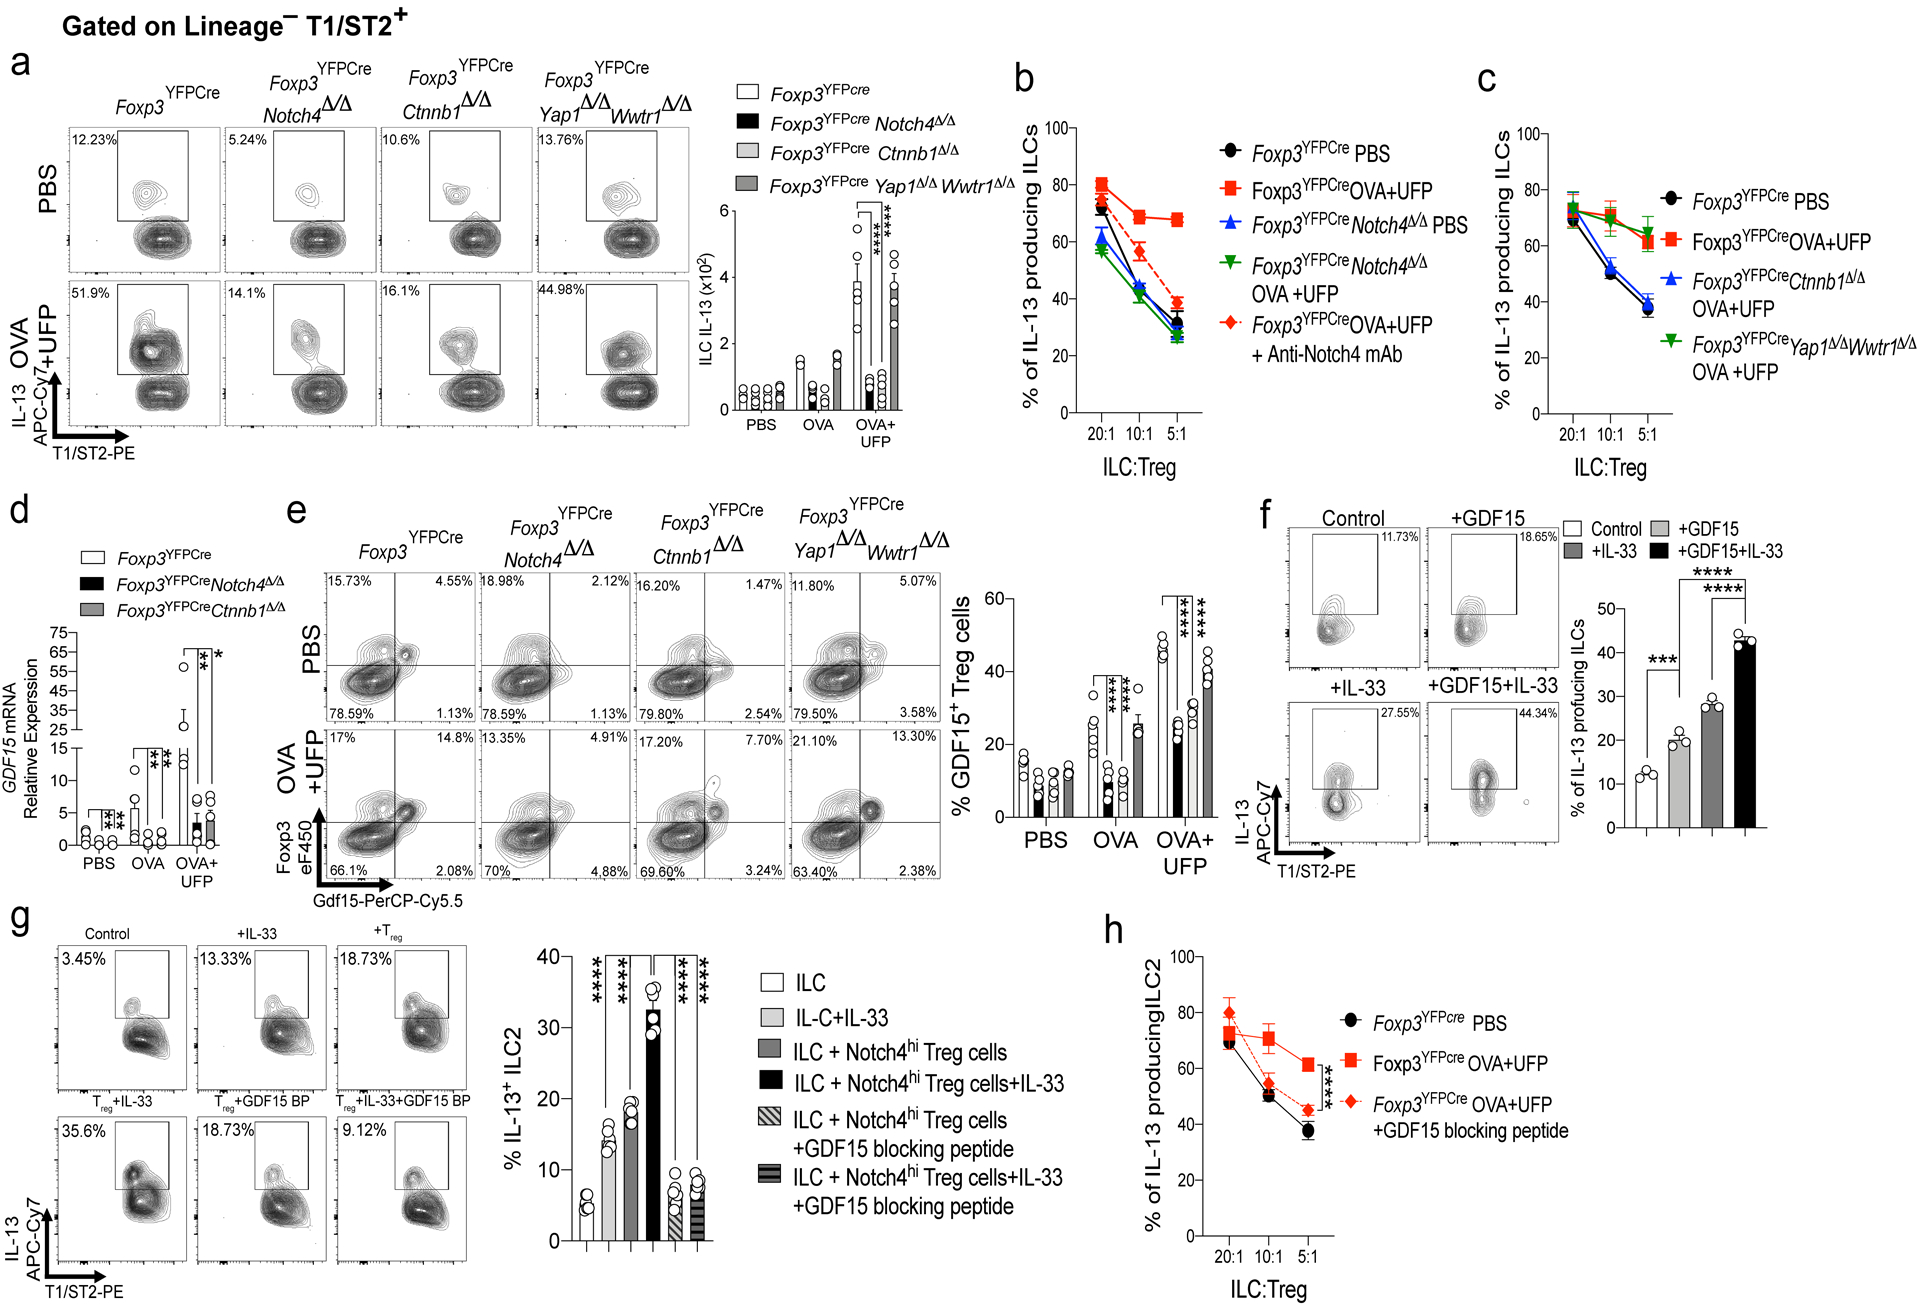
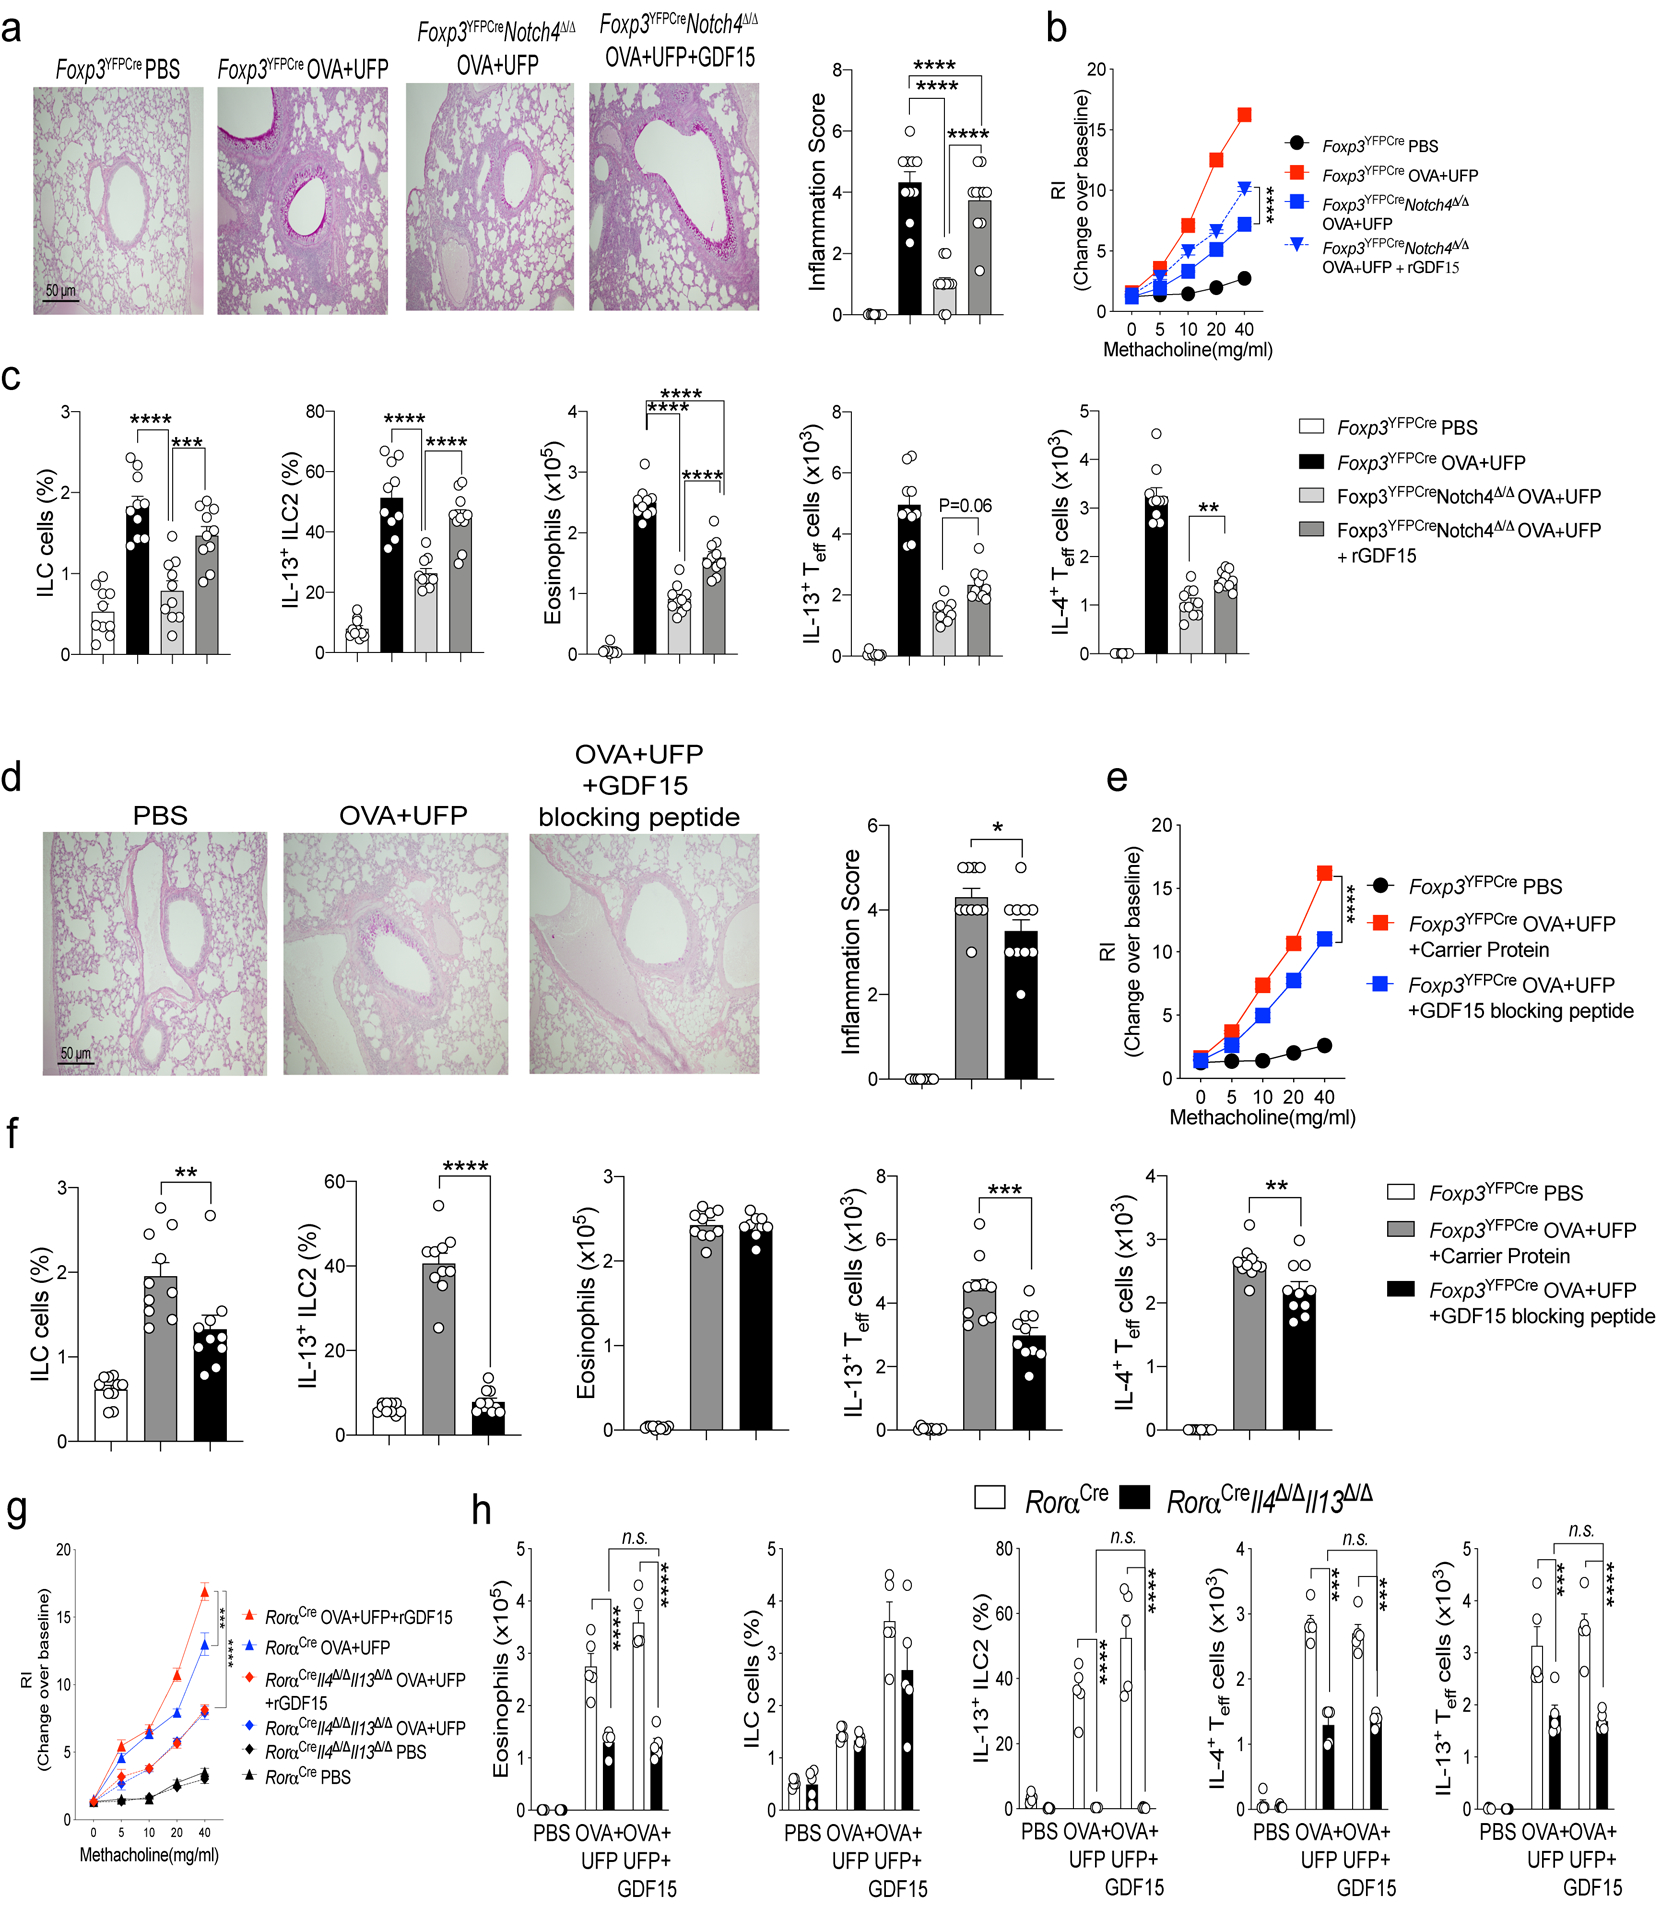
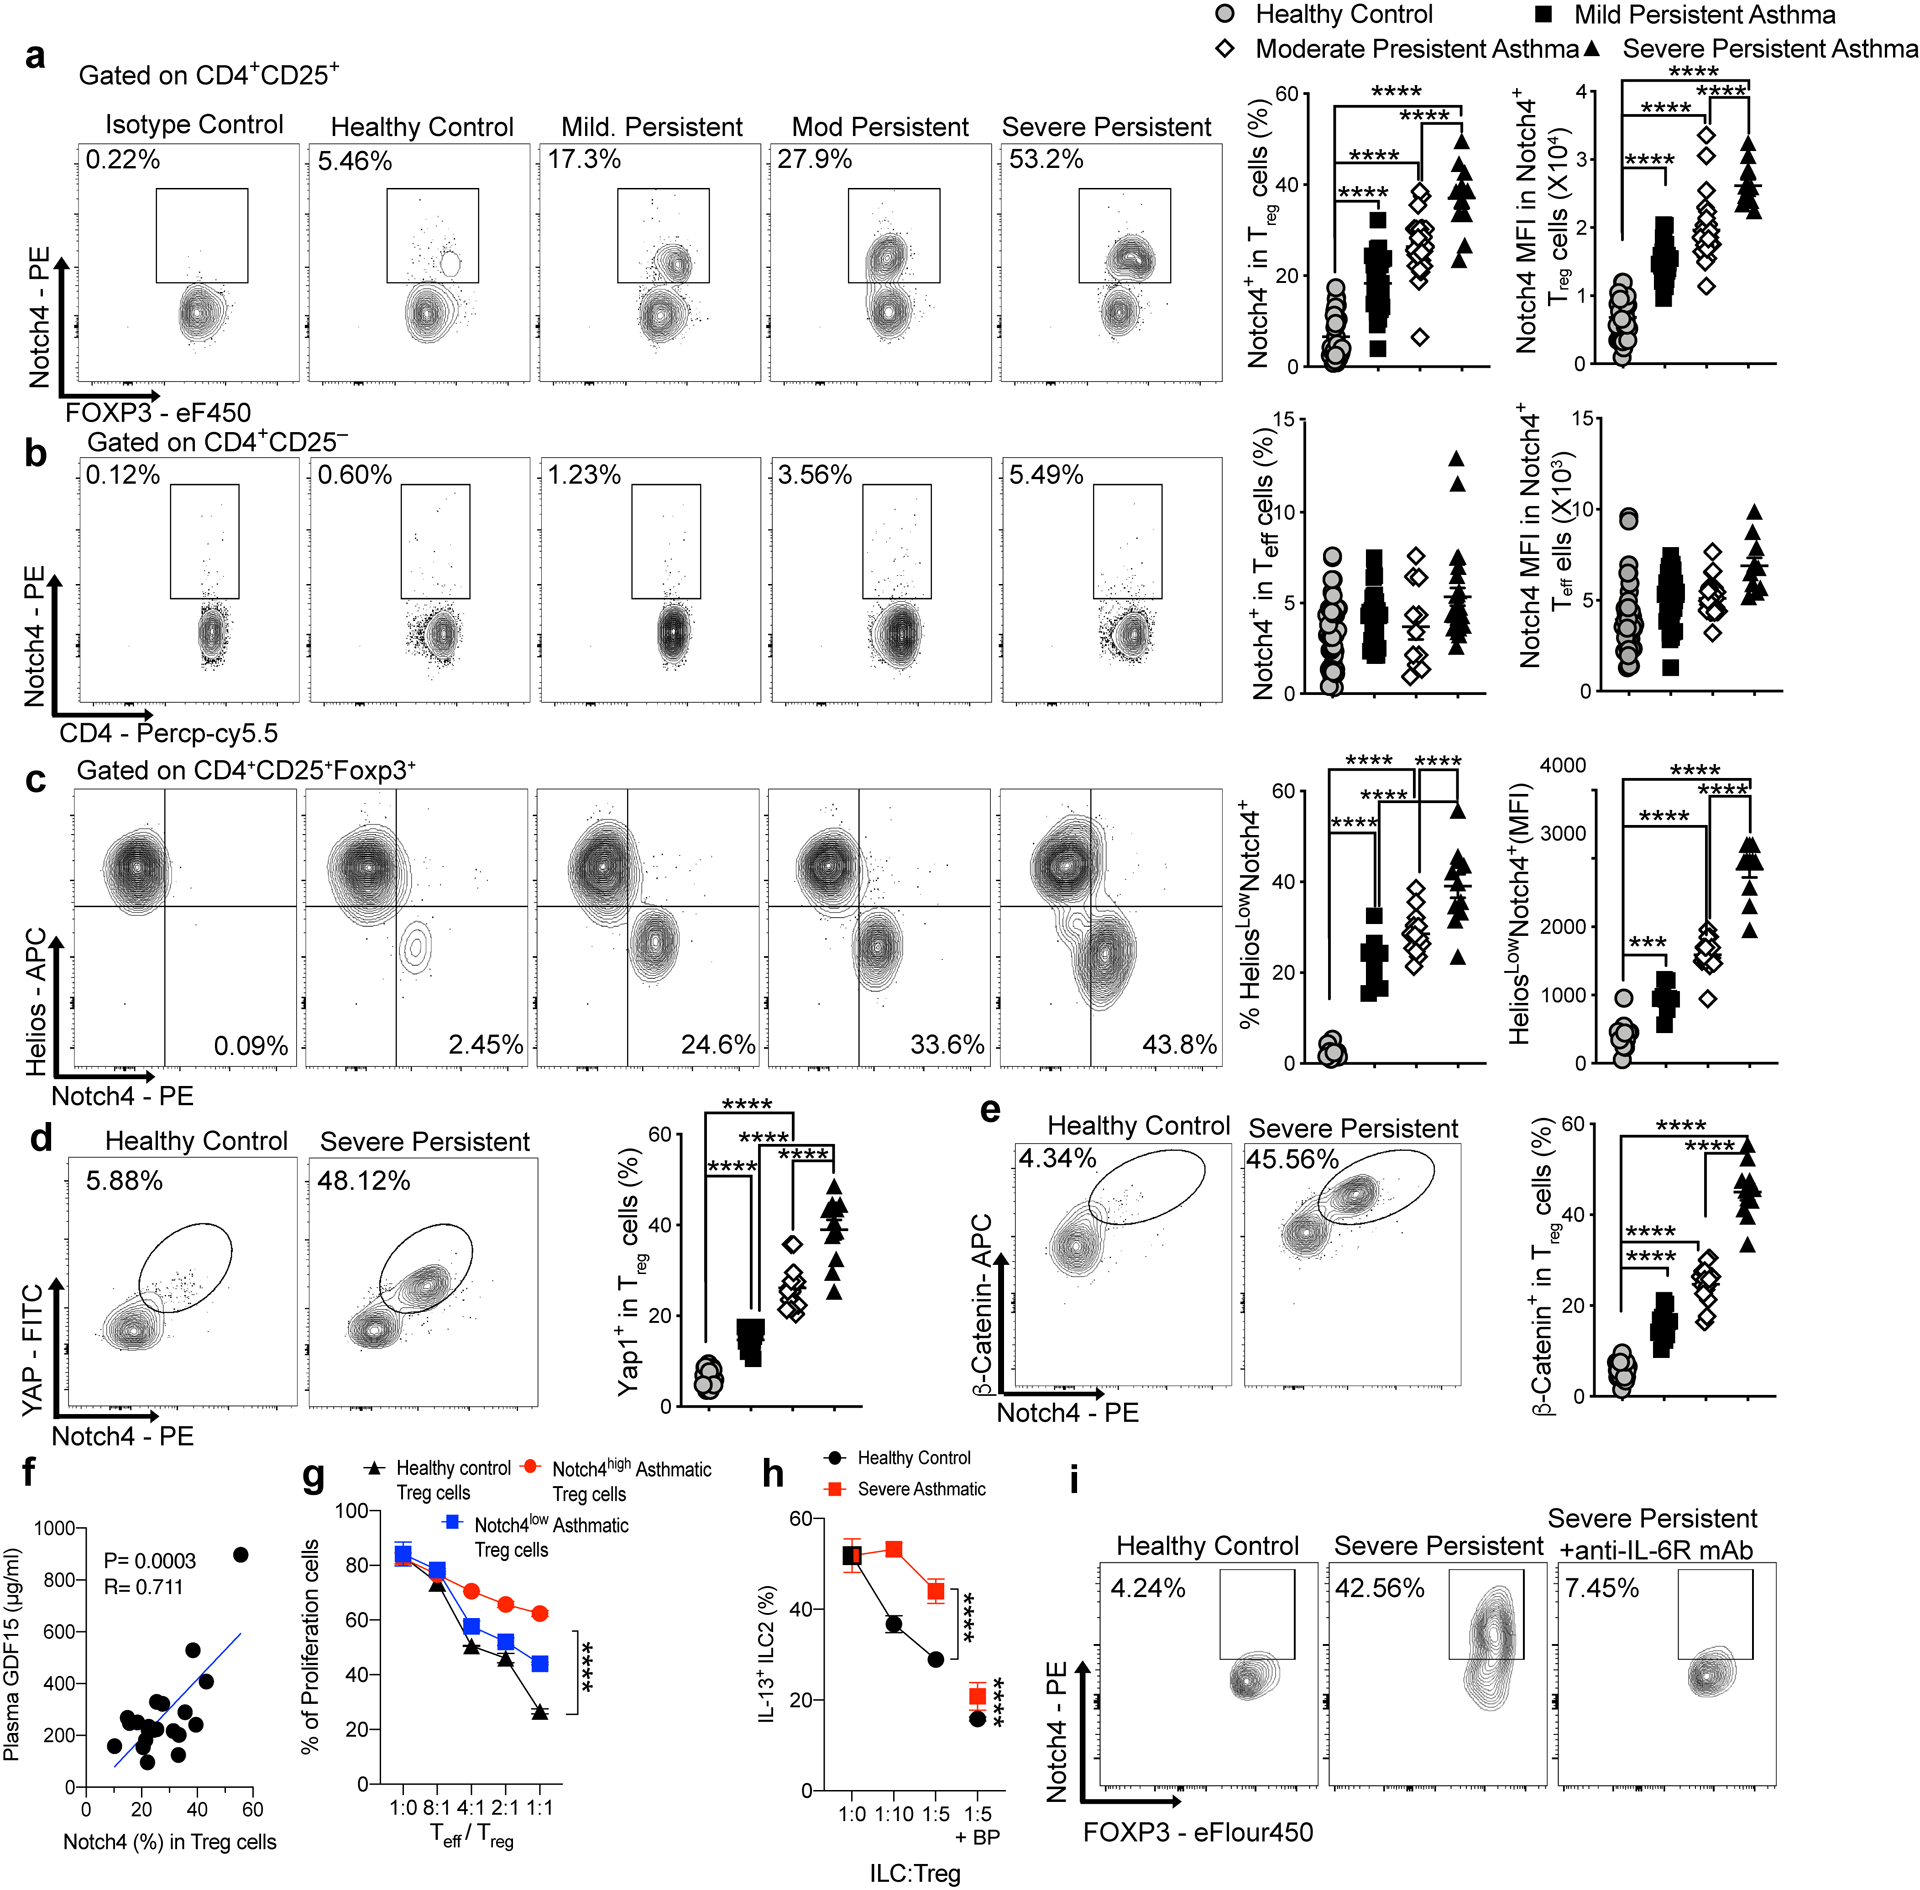
Elucidating the mechanisms that sustain asthmatic inflammation is critical for precision therapies. We found that interleukin-6- and STAT3 transcription factor-dependent upregulation of Notch4 receptor on lung tissue regulatory T (Treg) cells is necessary for allergens and particulate matter pollutants to promote airway inflammation. Notch4 subverted Treg cells into the type 2 and type 17 helper (TH2 and TH17) effector T cells by Wnt and Hippo pathway-dependent mechanisms. Wnt activation induced growth and differentiation factor 15 expression in Treg cells, which activated group 2 innate lymphoid cells to provide a feed-forward mechanism for aggravated inflammation. Notch4, Wnt and Hippo were upregulated in circulating Treg cells of individuals with asthma as a function of disease severity, in association with reduced Treg cell-mediated suppression. Our studies thus identify Notch4-mediated immune tolerance subversion as a fundamental mechanism that licenses tissue inflammation in asthma.


Figures

Extended Data Fig. 1
Extended Data Fig. 1. Notch4 expression on lung Treg cells in allergic airway inflammation
a-c, Flow cytometric analysis, cell frequencies and (MFI) of Notch1, 2 and 3 expression on lung Treg and Teff cells in Foxp3YFPCre (n=5). d, Cell frequencies of Notch4 expression on OT-II+CD4+Foxp3+ T cells generated in co-cultures with sham or OVA323–339+UFP-pulsed alveolar macrophages without or with IL-1β, IL-25, IL-33, TSLP or TNF (n=5). e, ChIP assays for the binding of STAT3 and control (IgG) antibodies to the Notch1, 2 and 3 promoters in lung Treg cells of OVA+UFP-treated Foxp3YFPCre, and Foxp3YFPCreStat3Δ/Δ mice (n=5). Each symbol represents one mouse. Numbers in flow plots indicate percentages. Error bars indicate SEM. Statistical tests: One-way ANOVA with Dunnett’s post hoc analysis (a-c); two-way ANOVA with Sidak’s post hoc analysis (d,e). **P<0.01, ***P<0.001, ****P<0.0001. Data representative of two or three independent experiments.
Extended Data Fig. 2
Extended Data Fig. 2. Notch4 expression on lung Treg cells licenses allergic airway inflammation
a, RT-PCR analysis of Notch4 expression in CD4Cre mice in B-cells and T-cells (n=5). b, RT-PCR analysis of Notch4 expression in Foxp3YFPCre mice in both Treg and Teff cells (n=5). c,d, IL-4 and IFN-γ expression in lung Foxp3+CD4+ Treg. (c) and Foxp3CD4+Teff cells. (d) derived from the respectively treated Foxp3YFPCre, CD4CreNotch4Δ/Δ and Foxp3YFPCreNotch4Δ/Δ mice (n=5). e, Airway hyperresponsiveness in Foxp3YFPCre sensitized either with PBS or OVA, then challenged with OVA+UFP following transfer of OTII+Foxp3YFPCre or OTII+Foxp3YFPCreNotch4Δ/Δ iTreg cells (n=5). f, Eosinophil numbers for the respective mouse groups (n=5). g, IL-4, IL-13, IL-17 and IFNγ expression in lung Foxp3CD4 Teff cells. Each symbol represents one mouse (n=5). Error bars indicate SEM. Statistical tests: two-way ANOVA with Sidak’s post hoc analysis (a,c,d); One-way ANOVA with Dunnett’s post hoc analysis (e,f). *P<0.05, **P<0.01, ***P<0.001, ****P<0.0001. Data representative of two or three independent experiments.
Extended Data Fig. 3
Extended Data Fig. 3. Allergic airway inflammatory responses in mice with Treg cell-specific Pofut1 or Rbpj1 deletion
a, Representative PAS-stained sections of lung tissues isolated from Foxp3YFPCre, Foxp3YFPCrePofut1Δ/Δ or Foxp3YFPCreRbpj1Δ/Δ mice segregated into PBS, OVA or OVA+UFP-treated groups (200X magnification). b, Inflammation scores in the respective lung tissues. c, AHR in the respective mouse groups in response to methacholine. d,e, serum total and OVA-specific IgE concentrations. f,g, absolute numbers of lung CD4+ T cells and eosinophils. h,i,IL-4, IL-13, IL-17 and IFNγ expression in lung Foxp3+CD4+ Treg (h) and Foxp3CD4+Teff cells (i). Each symbol represents an independent sample. Error bars indicate SEM. Statistical tests: two-way ANOVA with Sidak’s post hoc analysis (b-i). *P<0.05, **P<0.01, ***P<0.001, ****P<0.0001. Data representative of two or three independent experiments. n=5 mice per group.
Extended Data Fig. 4
Extended Data Fig. 4. Allergic airway inflammatory responses in mice with Treg cell-specific Notch1 or Notch2 deletion or global Notch3 deletion
a-c, AHR in Foxp3YFPCre, Foxp3YFPCreNotch1Δ/Δ, Foxp3YFPCreNotch2Δ/Δ, or Foxp3YFPCreNotch3–/– mice segregated into PBS, OVA or OVA+UFP-treated groups (200X magnification). d, serum OVA-specific IgE concentrations. e,f, absolute numbers of lung CD4+ T cells and eosinophils. g,h, IL-4, IL-13, and IL-17 expression in lung Foxp3CD4+Teff (g) and Foxp3+CD4+Treg cells (h). Each symbol represents an independent sample. Error bars indicate SEM. Statistical tests: two-way ANOVA with Sidak’s post hoc analysis a-h. Data representative of two or three independent experiments. n=5 mice per group.
Extended Data Fig. 5
Extended Data Fig. 5. Treg cell-specific Il6r and stat3 deletions attenuate allergic airway inflammation
a, Representative PAS-stained sections of lung tissues isolated from Foxp3YFPCre, Foxp3YFPCreIl6rΔ/Δ or Foxp3YFPCreStat3Δ/Δ mice segregated into PBS, OVA or OVA+UFP-treated groups (200X magnification). b, Inflammation scores in the respective lung tissues. c, AHR in the respective mouse groups in response to methacholine. d,e, serum total and OVA-specific IgE concentrations. f,g, absolute numbers of lung CD4+ T cells and eosinophils. h,i, IL-13 and IL-17 expression in lung Foxp3+CD4+ Treg (h) and Foxp3CD4+ Teff cells (i). Each symbol represents an independent sample. Error bars indicate SEM. Statistical tests: two-way ANOVA with Sidak’s post hoc analysis (b-i). *P<0.05, *P<0.05, **P<0.01, ***P<0.001, ****P<0.0001. Data representative of two or three independent experiments. n=5 mice per group.
Extended Data Fig. 6
Extended Data Fig. 6. Treg cell-specific Notch4 deletion rescues HDM induced allergic airway inflammation
a, scheme of the house dust mite (HDM) airway inflammation protocol. b, Representative PAS-stained sections of lung tissues isolated from Foxp3YFPCre or Foxp3YFPCreNotch4Δ/Δ mice segregated into PBS, OVA or OVA+UFP-treated groups (200X magnification). c, Inflammation scores in the respective lung tissues. d, AHR in the respective mouse groups in response to methacholine. e, serum total IgE concentrations. (f-h), absolute numbers of lung CD4+ T cells, neutrophils and eosinophils. i,k, IL-4, IL-13, IL-17 and IFNγ expression in lung Foxp3+CD4+ Treg (i) and Foxp3CD4+ Teff cells (k). Each symbol represents an independent sample. Numbers in flow plots indicate percentages. Error bars indicate SEM. Statistical tests: two-way ANOVA with Sidak’s post hoc analysis (c-k). **P<0.01, ***P<0.001, ****P<0.0001. Data representative of two or three independent experiments. n=5 mice per group.
Extended Data Fig. 7
Extended Data Fig. 7. Treg cell-specific Notch4 deletion rescues chronic allergic airway inflammation
a, Scheme for the chronic airway inflammation mouse protocol b, Representative Sirius-Red-stained sections of lung tissues isolated from Foxp3YFPCre or Foxp3YFPCreNotch4Δ/Δ mice segregated into PBS, OVA or OVA+UFP-treated groups (200X magnification). c, Collagen disposition measurement in the respective lung tissues. d, AHR in the respective mouse groups in response to methacholine. e,f, absolute numbers of lung CD4+ T cells and eosinophils. g,h, IL-4, IL-13, and IL-17 expression in lung Foxp3+CD4+ Treg (g) and Foxp3CD4+Teff cells (h). i, Serum OVA-specific IgE titers in the respective groups. Each symbol represents an independent sample. Error bars indicate SEM. Statistical tests: two-way ANOVA with Sidak’s post hoc analysis (c-h). *P<0.05, ****P<0.0001. Data representative of two or three independent experiments. n=5 mice per group.
Extended Data Fig. 8
Extended Data Fig. 8. Notch receptor expression in human Treg and Teff cells
a,b, Flow cytometric analysis, cell frequencies and mean fluorescence intensity (MFI) of Notch1, 2 and 3 expression in peripheral blood Treg cells (a) and Teff cells (b) of control and asthmatic subjects, the latter segregated for asthma severity (control n=22, M.P n= 15, Mod n= 16. S.P n=11). c, Flow cytometric analysis and cell frequencies of Notch4 peripheral blood Treg cells of healthy control, food allergy (FA), eczema and FA+eczema (Control n=37, FA n= 28, Eczema n=10 and FA+Eczema n=20) d, Serum GDF15 concentrations in asthmatic subjects plotted as a function of Notch4 expression on circulating Treg cells (n=73) e, Cell frequencies of Notch4 expression in peripheral blood Treg cells in healthy subjects, allergic and non-allergic asthmatics (control = 56, non-allergic n=21, allergic n=85). Error bars indicate SEM. Statistical tests: One-way ANOVA with Dunnett’s post hoc analysis. (a-c,e); simple regression analysis (d). ***P<0.001, ****P<0.0001. Data representative of two or three independent experiments.
Fig. 1.
Fig. 1.. Notch4 expression on lung Treg cells in allergic airway inflammation.
a, RT-PCR of Notch1-4 transcripts in lung Treg and Teff cells isolated from PBS, OVA and OVA+UFP mouse groups (n=5). b,c, Flow cytometric analysis, cell frequencies and mean fluorescence intensity (MFI) of Notch4 expression on lung Treg and Teff cells in the respective treated groups (n=15). d, Flow cytometric analysis and cell frequencies of Notch4 expression on OT-II+CD4+Foxp3+ T cells generated in co-cultures with sham or OVA323–339+UFP-pulsed alveolar macrophages without or with IL-6 or anti-IL-6R mAb (n=5). e, Flow cytometric analysis and cell frequencies of Notch4+Helios and Helios+ lung Treg cells isolated from the respective treated groups (n=5). f, Flow cytometric analysis and cell frequencies of Notch4 expression on in vitro differentiated Treg cells derived from naive CD4+ T cells isolated from Foxp3YFPCre, Foxp3YFPCreIl6rΔ/Δ and Foxp3YFPCreStat3Δ/Δ mice and either untreated or treated with IL-6 (n=6). g, ChIP assays for the binding of STAT3 and control (IgG) antibodies to the Notch4 promoter in lung Treg cells of OVA+UFP-treated Foxp3YFPCre, and Foxp3YFPCreStat3Δ/Δ mice (n=6). Each symbol represents one mouse. Numbers in flow plots indicate percentages. Error bars indicate SEM. Statistical tests: One-way ANOVA with Dunnett’s post hoc analysis (b,c,f); two-way ANOVA with Sidak’s post hoc analysis (a,d,e,g). *P<0.05, ***P<0.001, ****P<0.0001. Data representative of two or three independent experiments.
Fig. 2.
Fig. 2.. Notch4 expression on lung Treg cells licenses allergic airway inflammation.
a, Representative PAS-stained sections of lung tissues isolated from Foxp3YFPCre, CD4CreNotch4Δ/Δ or Foxp3YFPCreNotch4Δ/Δ mice segregated into PBS, OVA or OVA+UFP-treated groups (200X magnification). b, Inflammation scores in the respective lung tissues. c, AHR in the respective mouse groups in response to methacholine. (d,e) serum total and OVA-specific IgE concentrations. f,g, absolute numbers of lung CD4+ T cells and eosinophils. (h,i) IL-13 and IL-17 expression in lung Foxp3+CD4+ Treg (h), and Foxp3CD4+ Teff cells. (i). Each symbol represents an independent sample. Numbers in flow plots indicate percentages. Error bars indicate SEM. Statistical tests: two-way ANOVA with Sidak’s post hoc analysis (b-i). **P<0.01, ***P<0.001, ****P<0.0001. Data representative of two or three independent experiments. (White bars n=15), (black bars n=5) and (grey bars n=15).
Fig. 3.
Fig. 3.. Notch4-dependent transcriptional programs in lung Treg cells.
a, Volcano plot of differential gene expression in Foxp3YFPCre versus Foxp3YFPCreNotch4Δ/Δ Treg cells treated with OVA+UFP. FDR, false discovery rate; log2FC, log2(fold change). b, Enrichment pathway analysis of Hippo and Wnt pathways. c, Flow cytometric analysis and cell frequencies of Yap1 expression on lung Treg cells in the respective treated groups (n=5). d, Flow cytometric analysis and cell frequencies of β-Catenin expression on lung Treg cells in the respective treated groups (n=5). e, representative histogram, cell frequencies and MFI of phospho-Mob1 expression on lung Treg cells in the respective treated groups (light grey bar n= 4, dark grey bar n=4, light red bar n=5 and dark red bar n=4). f, representative histogram, cell frequencies and MFI of phospho-Lats1 T1079 expression on lung Treg cells in the respective treated groups (light grey bar n= 4, dark grey bar n=4, light red bar n=5 and dark red bar n=4). Each symbol represents an independent sample. Numbers in flow plots indicate percentages. Error bars indicate SEM. Statistical tests: two-way ANOVA with Sidak’s post hoc analysis (c,d); one-way ANOVA with Dunnett’s post hoc analysis (e,f). ***P<0.001, ****P<0.0001.
Fig. 4.
Fig. 4.. Regulation of allergic airway inflammation by Notch4-dependent Hippo and Wnt pathway.
a,e,i, AHR in the respectively treated Foxp3YFPCreWwtr1Δ/ΔYap1Δ/Δ (a), Foxp3YFPCreCtnnb1Δ/Δ mice (e) and Foxp3YFPCreWwtr1Δ/ΔYap1Δ/ΔCtnnb1Δ/Δ (i) compared to control Foxp3YFPCre mice in response to methacholine (a, n=15, e, and i n=5). b,f, and j OVA specific IgE titers (b, n=15, f, and j n=5) (c,d, g,h, k) Absolute lung tissue eosinophils and IL-4+, IL-13+ and IL-17+ Teff and Treg cells in Foxp3YFPCreWwtr1Δ/ΔYap1Δ/Δ, Foxp3YFPCreCtnnb1Δ/Δ and Foxp3YFPCreWwtr1Δ/ΔYap1Δ/ΔCtnnb1Δ/Δ mice compared to control Foxp3YFPCre mice (c,d, n=15 g,h, k n=5). Each symbol represents an independent sample. Numbers in flow plots indicate percentages. Error bars indicate SEM. Statistical tests: two-way ANOVA with Sidak’s post hoc analysis (a-k). *P<0.05, **P<0.01, ***P<0.001, ****P<0.0001. Data representative of two or three independent experiments.
Fig. 5.
Fig. 5.. Notch4 destabilizes Treg cell in a Hippo pathway-dependent manner.
a, flow cytometric analysis and frequencies of exTreg (GFP+YFP) cells, plotted as a fraction of exTreg to total Treg (GFP+) cells in lung tissue (n=5). b,c, Flow cytometric analysis and frequencies of IL-13 (n=5) (b) and IL-17 (n=5) (c) producing exTreg cells in lung tissues. d, Methylation status of CpG motifs of the foxp3 CNS2 region in Treg cells isolated from lung tissue of sham versus OVA+UFP–sensitized and challenged mice of the respectively indicated genotypes. Numbers on the left side indicate the position of the respective motifs. e, Global methylation status of Foxp3 CNS2 in the respective Treg cell populations (white bar n=5, black bar n=6, dark grey bar n=5, light grey bar n=4, grey line bar n=4 and grey line bar n=6). f-h, In vitro suppression of the proliferation of WT responder CD4+ T cells (Teff) by the respective Treg cell populations (panel f, black line n=3, red line n=6, blue line n=6, green line n=3), (panel g, black line n=3 , green line n=3, red line n=3, blue line n=3) and (panel h, black line n=3, green line n=3, red line n=3, blue line n=3). Each symbol represents an independent sample. Numbers in flow plots indicate percentages. Error bars indicate SEM. Statistical tests: two-way ANOVA with Sidak’s post hoc analysis (a-c) and (f-h); One-way ANOVA with Dunnett’s post hoc analysis (e), **P<0.01, ****P<0.0001. Data representative of two or three independent experiments.
Fig. 6.
Fig. 6.. Notch4 promotes ILC2 activation via a GDF15-dependent mechanism
a, flow cytometric analysis and frequencies of IL13+ ILC2 (LineageT1/ST2+ cells) in mice of respective genotypes treated as indicated (n=5). b,c, In vitro suppression assays using ILC2 from OVA+UFP-treated Foxp3YFPCre mice and lung Treg cells of the respective genotypes, treated as indicated (n=4) . d, GDF15 transcripts in Treg cells of Foxp3YFPCre, Foxp3YFPCreNotch4Δ/Δ and Foxp3YFPCreCtnnb1Δ/Δ (n=5). e, flow cytometric analysis and frequencies of GDF15+ lung Treg cells in the respective mouse genotypes treated as indicated (n=5). f, flow cytometric analysis and frequencies of IL-13 induced in naive ILC2 stimulated with IL-33, GDF15 or both (n=3). g, IL-13 expression in naive ILC2 incubated with Notch4hi Treg cells from OVA+UFP treated mice without or with blocking GDF15 peptide (n=6). h, In vitro suppression assays using lung Treg cells and ILC2 isolated from OVA+UFP-treated Foxp3YFPCre mice and incubated without or with GDF15 blocking peptide (n=4). Each symbol represents an independent sample. Numbers in flow plots indicate percentages. Error bars indicate SEM. Statistical tests: two-way ANOVA with Sidak’s post hoc analysis (a-e,h); One-way ANOVA with Dunnett’s post hoc analysis (f,g). *P<0.05, **P<0.01, ***P<0.001, ****P<0.0001. Data representative of two or three independent experiments.
Fig. 7.
Fig. 7.. GDF15 regulates ILC2 response in airway inflammation.
a,d, Representative PAS-stained sections of lung tissues isolated from Foxp3YFPCre and Foxp3YFPCreNotch4Δ/Δ with either PBS or OVA+UFP, the latter either alone or supplemented with GDF15 or GDF15 blocking peptide, as indicated (200X magnification), Inflammation score for the respective mouse groups (n=10). b,e, AHR in Foxp3YFPCre and Foxp3YFPCreNotch4Δ/Δ treated as indicated (n=10). c, f, Frequencies and absolute numbers of ILC2, eosinophils, IL-4, and IL-13, expression in lung Foxp3CD4+ Teff cells in the respective groups (n=10) g, AHR in RoraCre and RoraCreIl4/Il13Δ/Δ treated as indicated (n=5). h, Frequencies and absolute numbers of eosinophils, ILC2, IL-4, and IL-13, expression in lung Foxp3CD4+ Teff cells in the respective groups (n=5). Error bars indicate SEM. Statistical tests. One-way ANOVA with Dunnett’s post hoc analysis. (a,c,d,f), two-way ANOVA with Sidak’s post hoc analysis (b,e,g,h); *P<0.05, **P<0.01, ***P<0.001, ****P<0.0001. Data representative of two or three independent experiments.
Fig. 8.
Fig. 8.. Notch4 expression on circulating Treg cells segregates with asthma severity.
a,b, Flow cytometric analysis, cell frequencies and MFI of Notch4 expression on circulating Treg cells (a) and Teff cells (b) of control and asthmatic subjects, the latter segregated for asthma severity (control: n=39; mild n=31; moderate: n=27; severe: n=11). c, flow cytometric analysis, cell frequencies and MFI of Notch4 expression on Helios+ versus Helios circulating Treg cells of control and asthmatic subjects (control: n=13; mild n=9, moderate n=14; severe: n=11). d,e, Flow cytometric analysis, cell frequencies and MFI of Yap (d) and β-catenin (e) expression on circulating Treg cells of control and severe asthmatic subjects (control n=24; mild n=15; moderate n=15; severe: n=11). f, Serum GDF15 concentrations in moderate and severe asthmatic subjects plotted as a function of Notch4 expression on circulating Treg cells (n=21). g, In vitro suppression third party CD4+ T cells (Teff) by the Notch4hi versus Notch4lo Treg cells from severe asthmatics compared to Treg cells of control subjects (n=2 subjects, 3 replicates per dilution per subject). h, In vitro suppression assays of ILC2 activation using circulating Notch4hi Treg cells of asthmatics subjects and control Treg cells of healthy controls, incubated at the indicated Treg cell:ILC2 ratios without or with GDF15 blocking peptide (n=5). i, Flow cytometric analysis of Notch4 expression in Treg cells of a healthy control and a severe asthmatic before and after treatment with anti-IL-6R mAb (n=1). Error bars indicate SEM. Statistical tests: One-way ANOVA with Dunnett’s post hoc analysis (a-e); simple linear regression analysis (f); two-way ANOVA with Sidak’s post hoc analysis (g,h); ***P<0.001, ****P<0.0001. Data representative of two or three independent experiments.

Comment in

References

    1. Lambrecht BN & Hammad H The immunology of asthma. Nat Immunol 16, 45–56 (2015). - PubMed
    1. Martinez FD & Vercelli D Asthma. Lancet 382, 1360–1372 (2013). - PMC - PubMed
    1. Noval Rivas M & Chatila TA Regulatory T cells in allergic diseases. J Allergy Clin Immunol 138, 639–652 (2016). - PMC - PubMed
    1. Krishnamoorthy N et al. Early infection with respiratory syncytial virus impairs regulatory T cell function and increases susceptibility to allergic asthma. Nat Med 18, 1525–1530 (2012). - PMC - PubMed
    1. Noval Rivas M et al. Regulatory T cell reprogramming toward a Th2-cell-like lineage impairs oral tolerance and promotes food allergy. Immunity 42, 512–523 (2015). - PMC - PubMed

Publication types

MeSH terms