. 2020 Oct;21(10):1232-1243.
doi: 10.1038/s41590-020-0770-x. Epub 2020 Sep 14.

A dynamic CD2-rich compartment at the outer edge of the immunological synapse boosts and integrates signals

Collaborators, Affiliations

A dynamic CD2-rich compartment at the outer edge of the immunological synapse boosts and integrates signals

Philippos Demetriou et al. Nat Immunol. 2020 Oct.

Erratum in

Abstract

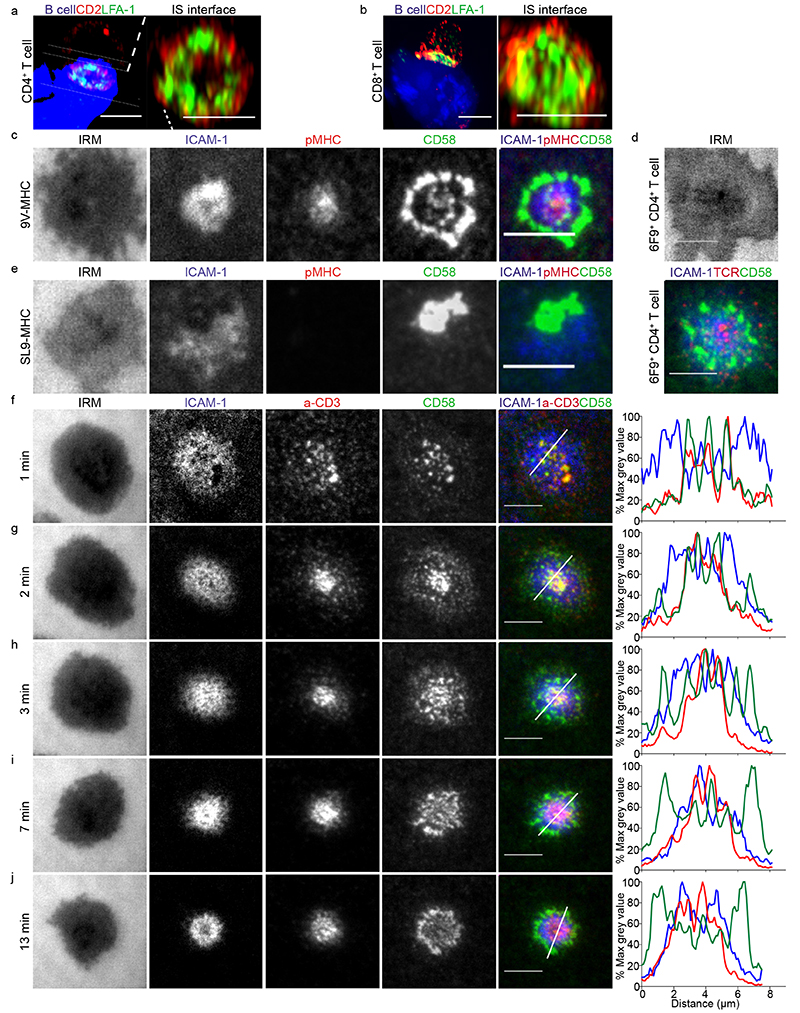
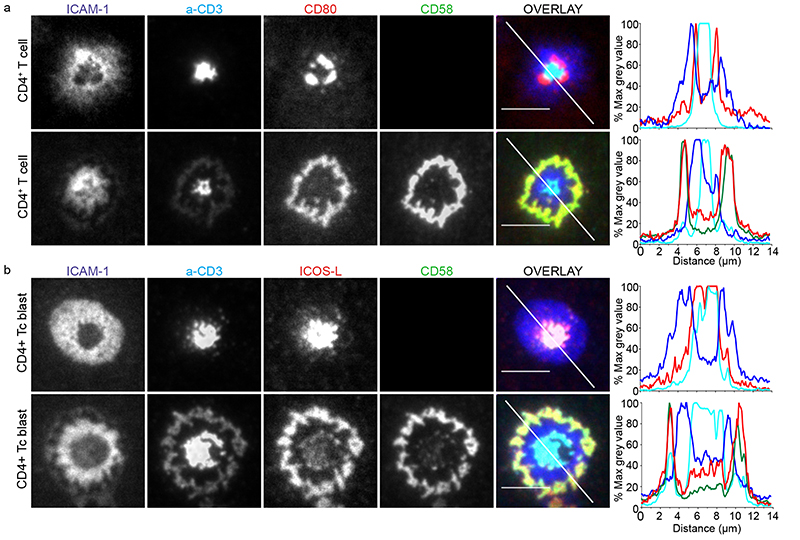
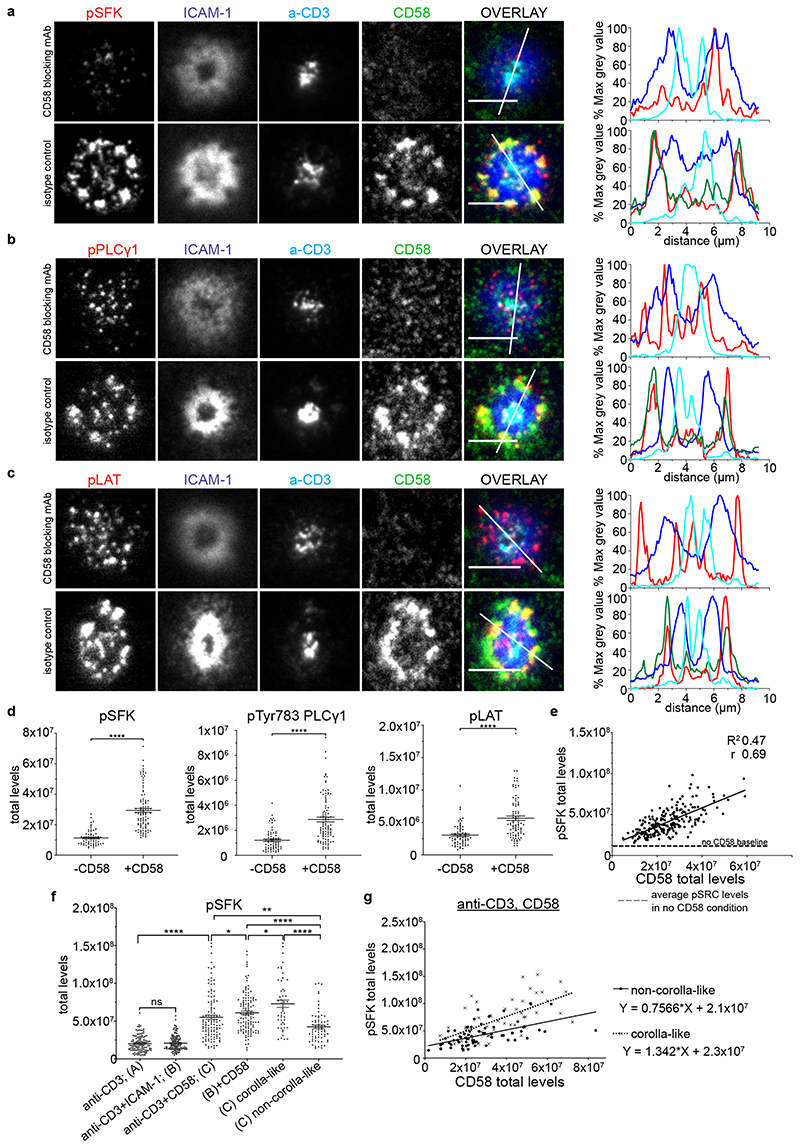
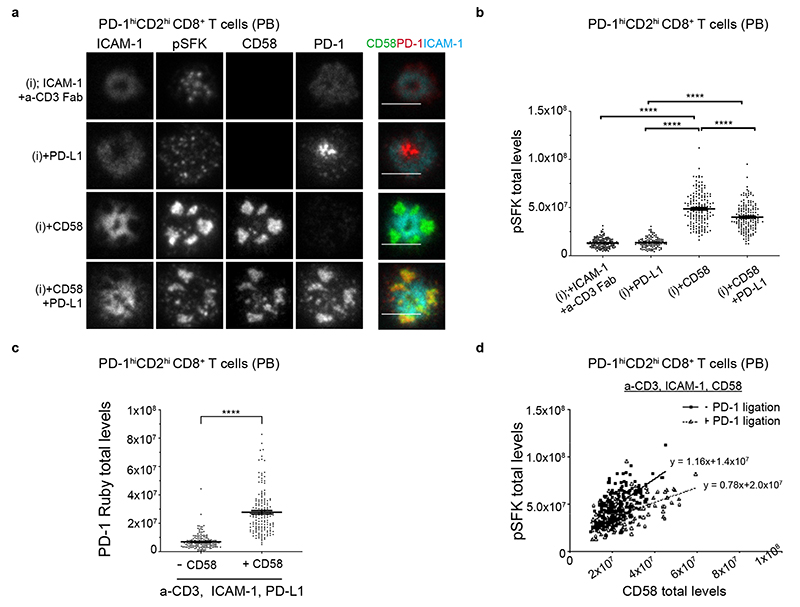
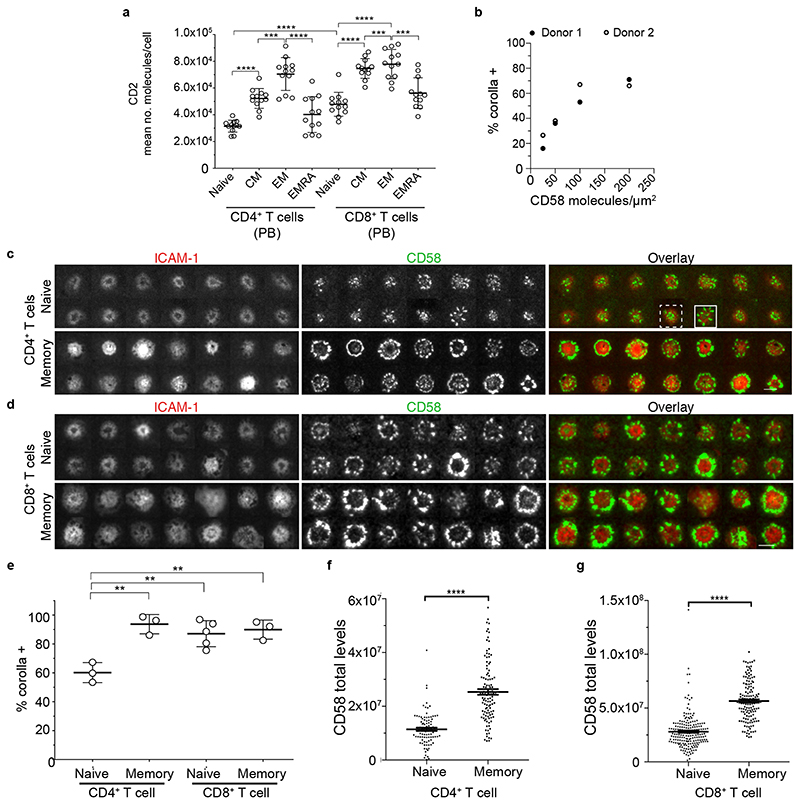
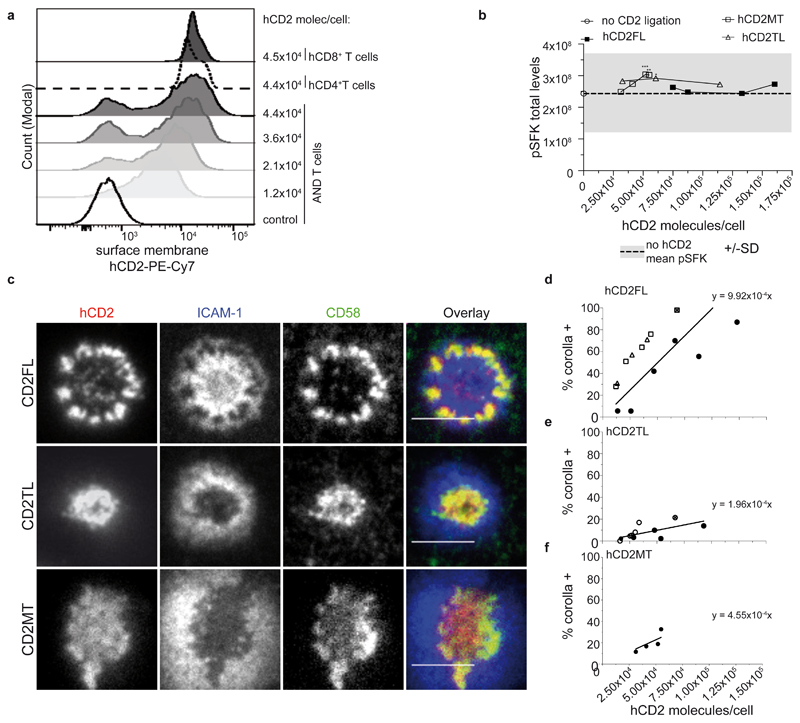
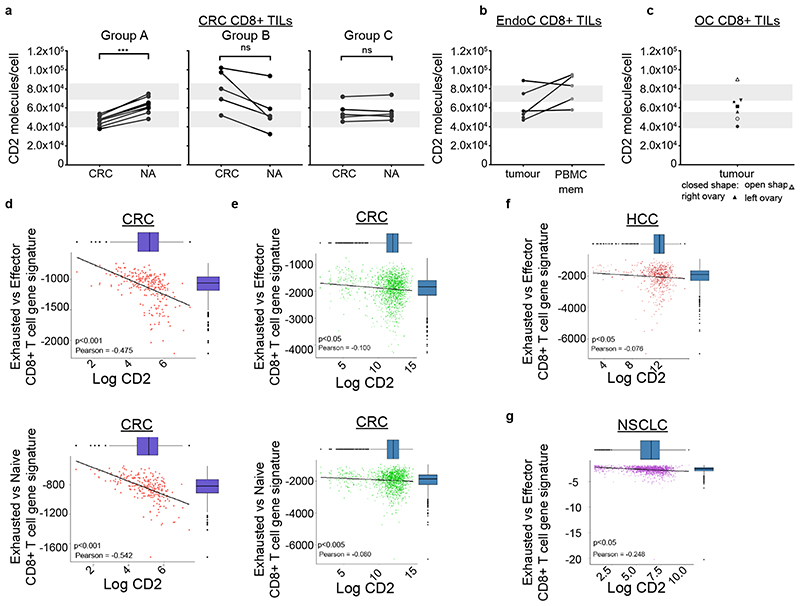
The CD2-CD58 recognition system promotes adhesion and signaling and counters exhaustion in human T cells. We found that CD2 localized to the outer edge of the mature immunological synapse, with cellular or artificial APC, in a pattern we refer to as a 'CD2 corolla'. The corolla captured engaged CD28, ICOS, CD226 and SLAM-F1 co-stimulators. The corolla amplified active phosphorylated Src-family kinases (pSFK), LAT and PLC-γ over T cell receptor (TCR) alone. CD2-CD58 interactions in the corolla boosted signaling by 77% as compared with central CD2-CD58 interactions. Engaged PD-1 invaded the CD2 corolla and buffered CD2-mediated amplification of TCR signaling. CD2 numbers and motifs in its cytoplasmic tail controlled corolla formation. CD8+ tumor-infiltrating lymphocytes displayed low expression of CD2 in the majority of people with colorectal, endometrial or ovarian cancer. CD2 downregulation may attenuate antitumor T cell responses, with implications for checkpoint immunotherapies.


Conflict of interest statement

Competing Interests

The authors declare no competing interests

Figures

Fig. 1
Fig. 1. A unique ring pattern, “corolla”, formed by CD2-CD58 interactions in the IS.
a-b) 3D rendering images (IMARIS software) of T:B cell conjugates and enlarged 1 μm thick slice (white solid lines) of the T:B cell IS interface. 6F9+ CD4+ T cells (a) and 1G4+ CD8+ T cells (b), were conjugated with EBV-transformed B cells (blue-volumetric dye) pulsed with 1 μM MAGE-3A243-258 or 1μM NY-ESO-9V157-165 peptide, respectively, for 25-30 min. CD2 (red) and LFA-1-α-subunit (green) staining shown. Images were captured on an Airyscan confocal microscope (ZEISS). Representative images are shown from two independent experiments (n=25 conjugates). c) 1G4+ CD8+ T cells, fixed 15 min post-incubation on ICAM-1 (200/μm2), CD58 (200/μm2) reconstituted SLBs, in addition to NY-ESO-9V/HLA-A2 (30/μm2). Cells were imaged with TIRFM. d) 6F9+ CD4+ T cells, treated the same as in (c) but on MAGE-A3/HLA-DP4 (30/μm2) instead. 6F9+ TCR CD4+ T cells were stained with a fluorescently labeled anti-mouse TCRβ Fab (H57 clone) prior to SLB incubation. e) Same as in (c) but T cells were incubated on GAG-SL9/HLA-A2 (30/μm2) instead. f-j) CD4+ T cells, incubated on ICAM-1 (200/μm2), anti-CD3 Fab (30/μm2), CD58 (200/μm2) reconstituted SLBs. Cells were imaged at 4s intervals with TIRFM. Representative images within 13 min from initial contact are shown. Histograms depict the intensity profiles on the diagonal white lines in overlay images. Raw pixel intensity signal normalized to maximum intensity pixel of each channel. A representative experiment of three independent experiments with either CD4+ or CD8+ T cells is shown. IRM, interference reflection microscopy, signal shows the spreading phase of the cell. Scale bar, 5 μm.
Fig. 2
Fig. 2. The corolla organizes multiple costimulatory receptor interactions.
a) Human CD4+ T cells incubated on ICAM-1 (200/μm2), anti-CD3 Fab (30/μm2), CD80 (100/μm2) without (top) or with CD58 (200/μm2) (bottom) reconstituted SLBs and fixed at 15 min. b) Activated human CD4+ T cell blasts incubated on ICAM-1 (200/μm2), anti-CD3 Fab (30/μm2), ICOS-L (100/μm2) without (top) or with CD58 (200/μm2) (bottom) reconstituted SLBs and fixed 15 min. Histograms depict the intensity profiles on the diagonal white lines in overlay images. Raw pixel intensity signal normalized to maximum intensity pixel of each channel. Cells were imaged with TIRFM and representative images are shown from four independent experiments. Scale bar, 5 μm.
Fig. 3
Fig. 3. CD2 corolla boosts CD2-dependent TCR signal amplification.
Representative images of CD8+ T cells (n=3 independent experiments) incubated on ICAM-1 (200/μm2), anti-CD3 Fab (30/μm2) and CD58 (200/μm2) reconstituted SLBs, fixed 15 min post-incubation, followed by permeabilization, blocking and intracellular staining for phosphorylated Src kinases, pSFK (a), pTYR783PLCγ1, pPLCγ1 (b) or pTYR171LAT, pLAT in (c). SLBs were previously incubated with blocking anti-CD58 mAb (TS2/9 clone) or an isotype control. Same results were obtained when CD58 was omitted instead of using CD58 blocking mAb. Cells were imaged with TIRFM. Scale bar, 5 μm. Histograms depict the intensity profiles on the diagonal white lines in overlay images. y-axis; raw pixel intensity signal normalized to maximum intensity pixel of each channel. The CD58 signal was omitted in CD58 blocking conditions for clarity. d) Levels of pSFK, pPLCγ1 and pLAT for an average of 80 cells/condition shown in (a-c). ****, p value <0.0001 with unpaired two-tailed Mann Whitney test. A representative of three experiments is shown. Error bars, Mean±SEM. e) pSFK and CD58 levels in single cell synapses for CD8+ T cells treated as in (a); a representative experiment out of three. There is positive correlation between the two parameters with Pearson r 0.69; R2 0.47; 95% CI; ****, p<0.0001; y-intercept 1.32x10, slope 1.123; - - - -, dashed line represents the mean pSFK levels (1.15x10) from a population of single T cells (n=213 cells), in the absence of CD58. f) Levels of pSFK from T cells incubated on four different ligand SLB compositions based on anti-CD3 Fab (A) and anti-CD3, ICAM-1 (B) ±CD58, (n=121,145, 119, 124 cells, respectively and one out of three independent donors shown) reconstituted SLBs, fixed 15 min post-incubation, followed by permeabilization, blocking and intracellular staining for phosphorylated Src kinases (pSFK) and imaged with TIRFM. Error bars, Mean±SEM. *, p<0.05; **, p<0.007; ****, p<0.0001. with unpaired two-tailed Mann Whitney test. g) Comparison of the slopes of pSFK vs CD58 for non-corolla-like and corolla-like synapses in CD8+ T cells treated on anti-CD3, CD58 reconstituted SLBs, as in (f). A representative donor out of three; n=70 and 51 cells per category; statistically significant difference in the slopes, p=0.023. All three donors showed the same trend and two of them had significant p values (0.023, 0.0072, 0.0861) for the difference in the slopes of the relationship between CD58 and pSFK.
Fig. 4
Fig. 4. Regulation of signaling in the corolla by PD-1 engagement.
a) Representative images of memory CD8+ T cells transfected with TIL-like levels of PD-1-Ruby and incubated on four different ligand compositions based on ICAM-1 and anti-CD3 Fab (i) ±CD58 and ±PD-L1 in SLBs, fixed 15 min post-incubation, followed by permeabilization, blocking and intracellular staining for pSFK and imaged with TIRFM. T cells expressed, on average, 1.5x10 molecules/cell. Overlay image merges signals from ICAM-1, CD58 and PD-1 to assess the localization of CD58 and PD-1 relative to ICAM-1 and to each other. Scale bar, 5 μm. b) pSFK levels at the IS of single memory PD-1hiCD2hiCD8+ T cells from experiment in (a), n=141, 111, 161, 157 cells per condition. Representative donor out of three is shown. ****, p<0.0001 with non-parametric two-tailed Mann Whitney test. Error bars, Mean±SEM. c) PD-1-Ruby levels accumulating in the synapse of PD-1hiCD2hiCD8+ T cells from experiment shown in (a) in a-CD3 Fab, ICAM-1, PD-L1±CD58 conditions; representative example shown. ****, p<0.0001. Error bars, Mean±SEM d) Plot of CD58 vs pSFK without (n=161 cells) and with PD-L1 (n=157) in SLB from donor in (a); significant difference in slopes, p<0.0001; all three donors showed the same trend and two had significant p values (p<0.0001, p=00.46, p=0.1765) for the difference in the slopes of the two regression lines.
Fig. 5
Fig. 5. Number of CD2 per human T cell predicts CD58 engagement and corolla formation.
a) After gating on single and live cells, CD4+CD3+ (left) or CD8+CD3+ (right) cells were selected and divided into naive (CD62L+CD45RA+), central memory (CD62L+CD45RA-), effector memory (CD62L-CD45RA-) and effector memory that reexpressed CD45RA (CD62L-CD45RA+) to determine average CD2 absolute number per cell. Error bars, Mean±SD b) The percentage of human CD8+ T cells that formed a CD2 corolla (% corolla+) in experiments on ICAM-1, anti-CD3 presenting SLBs with titrated levels of CD58. Data from 2 donors. c) A random image selection of naive (CD62L+CD45RA-) or memory (CD45RA-) CD4+ T cells incubated on ICAM-1 (200/μm2), anti-CD3 Fab (30/μm2) and CD58 (200/μm2) reconstituted SLBs, fixed at 15 min and imaged with TIRFM; examples of corolla positive (solid line rectangle) and corolla negative (dashed line rectangle) are shown. d) Same as in (c) but with CD8+ T cells. e) Percentage of T cells forming an IS with a CD2 corolla (corolla+) in experiments as in (c-d), was determined for naive and memory T cell subsets. Circles represent donors. **, p value <0.006, unpaired two-tailed t-test with Welch’s correction. For number of cells analyzed/subset see Supplementary Table 6. Error bars, Mean±SD. Quantification (from experiments as in (c-d)) of total CD58 accumulation in the IS of CD4+ (f) (n=91 and 110 cells, respectively) and CD8+ (g) T cell subsets (n=199 and 140, respectively). ****, p value <0.0001 with unpaired two-tailed non-parametric Mann Whitney test. A representative of three experiments is shown. Error bars, Mean±SEM.
Fig. 6
Fig. 6. CD2 expression determines corolla formation independent of signaling.
a) The histograms show an example of AND T cells transfected with different levels of human CD2 (hCD2FL; full length protein) and compared to CD2 levels found in PB T cells from healthy individuals. Control cells were stained untransfected AND T cells (empty solid line histogram). b) Mean pSFK levels of AND T cells expressing either human CD2 full length (hCD2FL), hCD2p.240_351del (hCD2TL), or hCD2 p.PR329AA (hCD2MT) at different levels, on ICAM-1 (200/μm2), MCC-I-Ek (30/μm2) and CD58 (200/μm2) reconstituted SLBs, stained for pSFK and imaged with TIRFM. Dashed line represents mean pSFK levels AND T cells on ICAM-1, pMHC to which rest of conditions were compared to. *, p<0.05; **, p=0.0012, ***, p=0.001 with unpaired two-tailed non-parametric Mann Whitney test. For number of cells per data point see Supplementary Table 6. c) Representative images of AND T cells expressing either hCD2FL, hCD2MT or hCD2TL incubated on ICAM-1 (200/μm2), MCC-I-Ek (30/μm2) and CD58 (200/μm2) reconstituted SLBs, fixed 15 min post-incubation and imaged with TIRFM. Scale bar, 5 μm. d-f) The percentage of hCD2FL-, hCD2TM- or hCD2MT-expressing AND T cells that formed a CD2 corolla (% corolla+) in experiments such as in (c) over a range of hCD2FL (d) n= 4 independent experiments, hCD2TM expression (e) n=3 and hCD2MT (f) n=1. At least 30 cells were considered/data point. 95% CI of regression lines for FL, 7.15x10⁻⁴ to 12.69x10⁻⁴, line is significantly non-zero, F=59.76, p<0.0001; for TM 1.17x10⁻⁴ to 2.75x10⁻⁴, line is significantly non-zero, F=30.83, p=0.0002, MT, 2.62x10⁻⁴ to 6.48x10⁻⁴, line is significantly non-zero, F=56.21, p=0.0049. Each different symbol represents one data point from an individual experiment. See statistical analysis section for slope comparison test.
Fig. 7
Fig. 7. CD8+ TILs from cancer patients can express considerable low levels of CD2.
a) The mean number of CD2 molecules/cell per CRC patient, for the CD8+ TILs from tumor (CRC) compared to matched normal adjacent tissue (NA). Patients were grouped in three separate groups (Group A, n=8; Group B, n=5; Group C, n=6) based on CD2 level change of tumor T cells relative to NA. ***, p=0.0007 with unpaired two-tailed t test with Welch’s correction. b) The mean number of CD2 molecules/cell per endometrial cancer (EndoC) patient (n=6 independent patients), for the CD8+ TILs compared to memory CD8+ T cells in matched patient PBMCs (one donor without matched PBMCs). c) The mean number of CD2 molecules/cell per ovarian cancer (OC) patient (n=5 independent patients) in CD8+ TILs. For a-c, grey bars represent the average CD2 levels (mean±SD) expressed in memory (top) and naive (bottom) CD3+CD8+ T cells found in blood from healthy individuals. d) The correlation between exhausted CD8+ T cell gene signature and CD2 expression from whole transcriptomic analysis of CRC patients from The Cancer Genome Atlas (TCGA) is shown (n=255, independent patients) for (top) “exhausted vs effector CD8+ T cell gene signature” and (left) “exhausted vs naive CD8+ T cell gene signature”. Pearson r -0.475, -0.542, respectively; p<0.001 for both e) The correlation between exhausted CD8+ T cell gene signature and CD2 expression from publically available single cell transcriptomic dataset from CRC patients. The correlation was investigated in both exhaustion gene signatures (GSE 41867, top panel - exhausted vs. effector CD8 T cells, Pearson r -0.100, p<0.05, left panel-exhausted vs. naive CD8 T cells, Pearson r -0.542; p<0.005). f,g) The correlation between exhausted CD8+ T cell gene signature and CD2 expression from publically available single cell transcriptomic dataset from hepatocellular carcinoma (HCC) patients (Pearson r -0.076, p<0.05) and non-small cell lung cancer (NSLCC) patients (Pearson r -0.248, p<0.05). The correlation was investigated in both exhaustion gene signatures (signatures (GSE 41867, exhausted vs. effector CD8 T cells shown only). Statistical analyses for (d-g) see section “Data analysis - CD8 exhausted T cell subpopulations” in Methods.

References

    1. Sanchez-Madrid F, et al. Three distinct antigens associated with human T-lymphocyte-mediated cytolysis: LFA-1, LFA-2, and LFA-3. Proc Natl Acad Sci U S A. 1982;79:7489–7493. - PMC - PubMed
    1. Sanders ME, et al. Human memory T lymphocytes express increased levels of three cell adhesion molecules (LFA-3, CD2, and LFA-1) and three other molecules (UCHL1, CDw29, and Pgp-1) and have enhanced IFN-gamma production. J Immunol. 1988;140:1401–1407. - PubMed
    1. Davis SJ, van der Merwe PA. The kinetic-segregation model: TCR triggering and beyond. Nature immunology. 2006;7:803–809. - PubMed
    1. Carmo AM, Mason DW, Beyers AD. Physical association of the cytoplasmic domain of CD2 with the tyrosine kinases p56lck and p59fyn. European journal of immunology. 1993;23:2196–2201. - PubMed
    1. Dustin ML, et al. A novel adapter protein orchestrates receptor patterning and cytoskeletal polarity in T cell contacts. Cell. 1998;94:667–677. - PubMed

Publication types