. 2021 Feb;17(2):169-177.
doi: 10.1038/s41589-020-0640-8. Epub 2020 Sep 14.

MYPT1 O-GlcNAc modification regulates sphingosine-1-phosphate mediated contraction

Affiliations

MYPT1 O-GlcNAc modification regulates sphingosine-1-phosphate mediated contraction

Nichole J Pedowitz et al. Nat Chem Biol. 2021 Feb.

Abstract

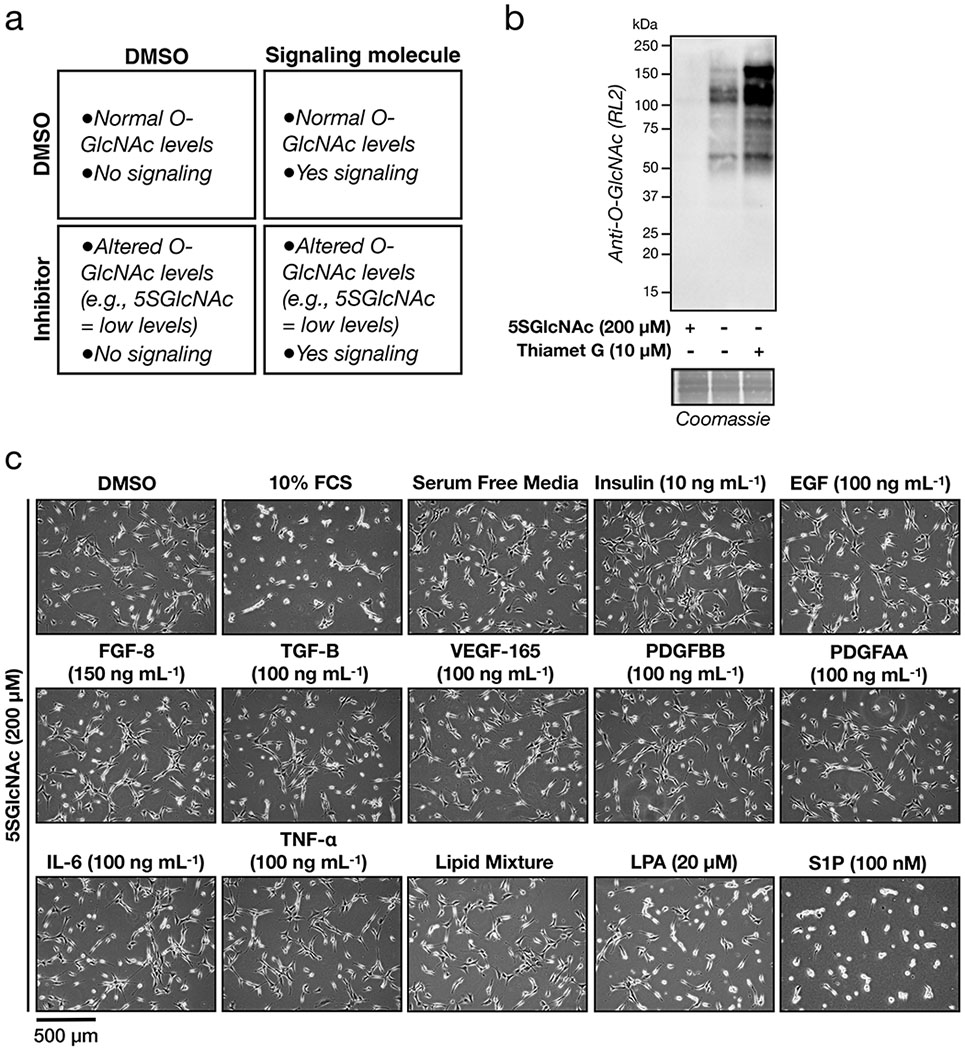
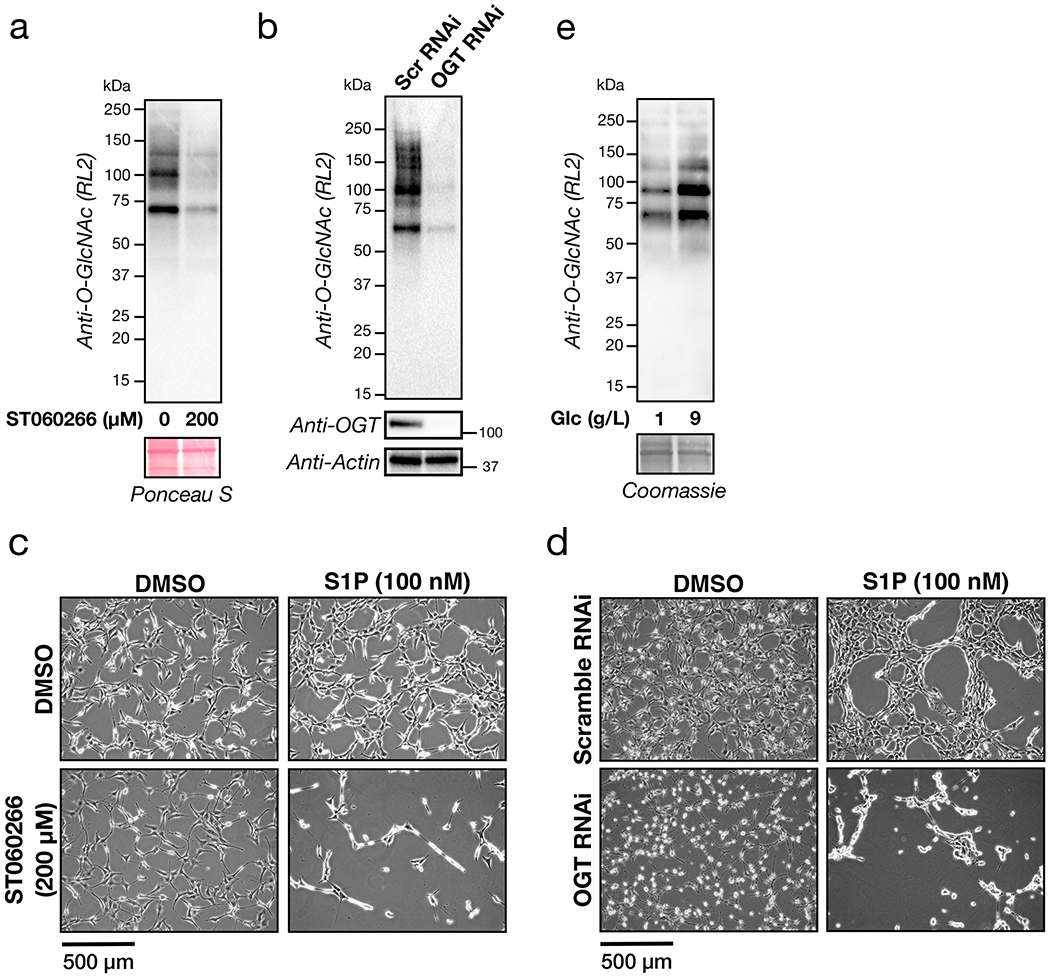
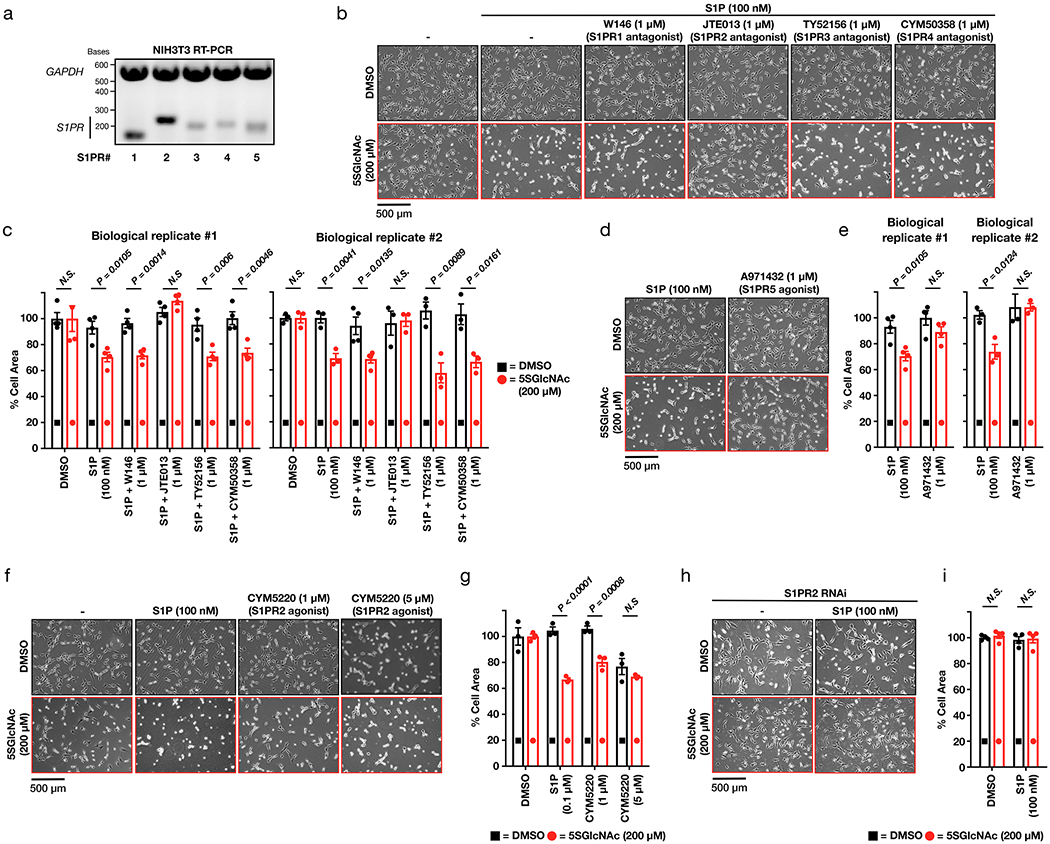
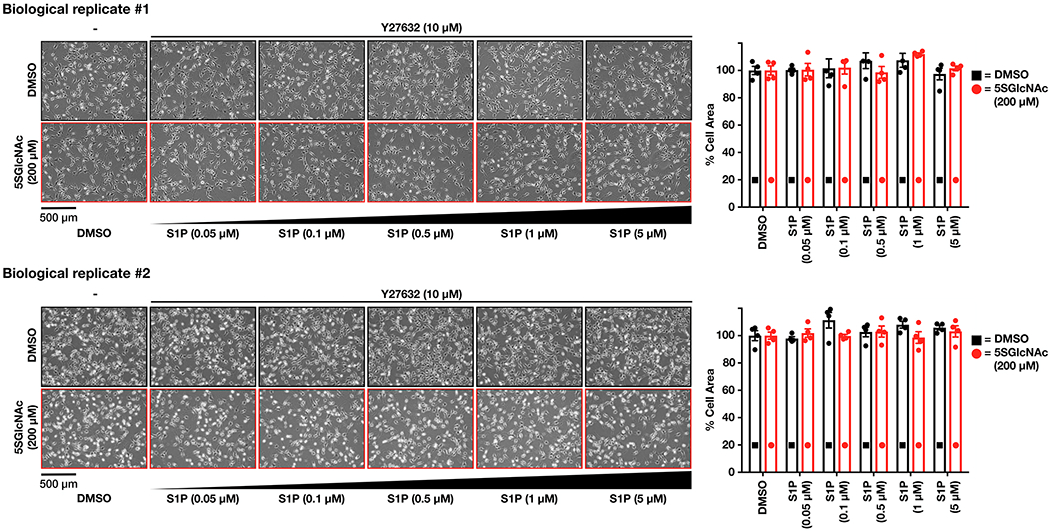
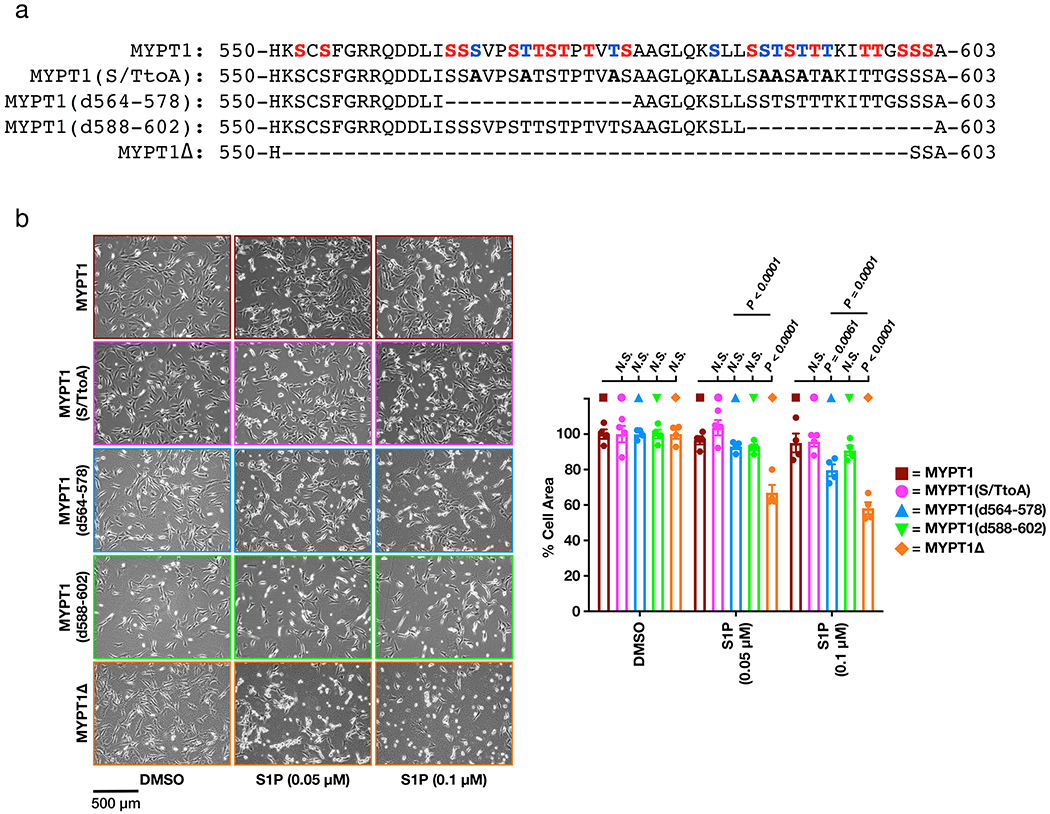
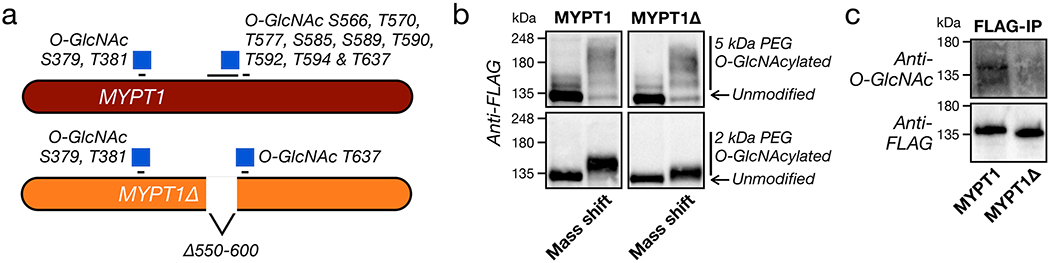
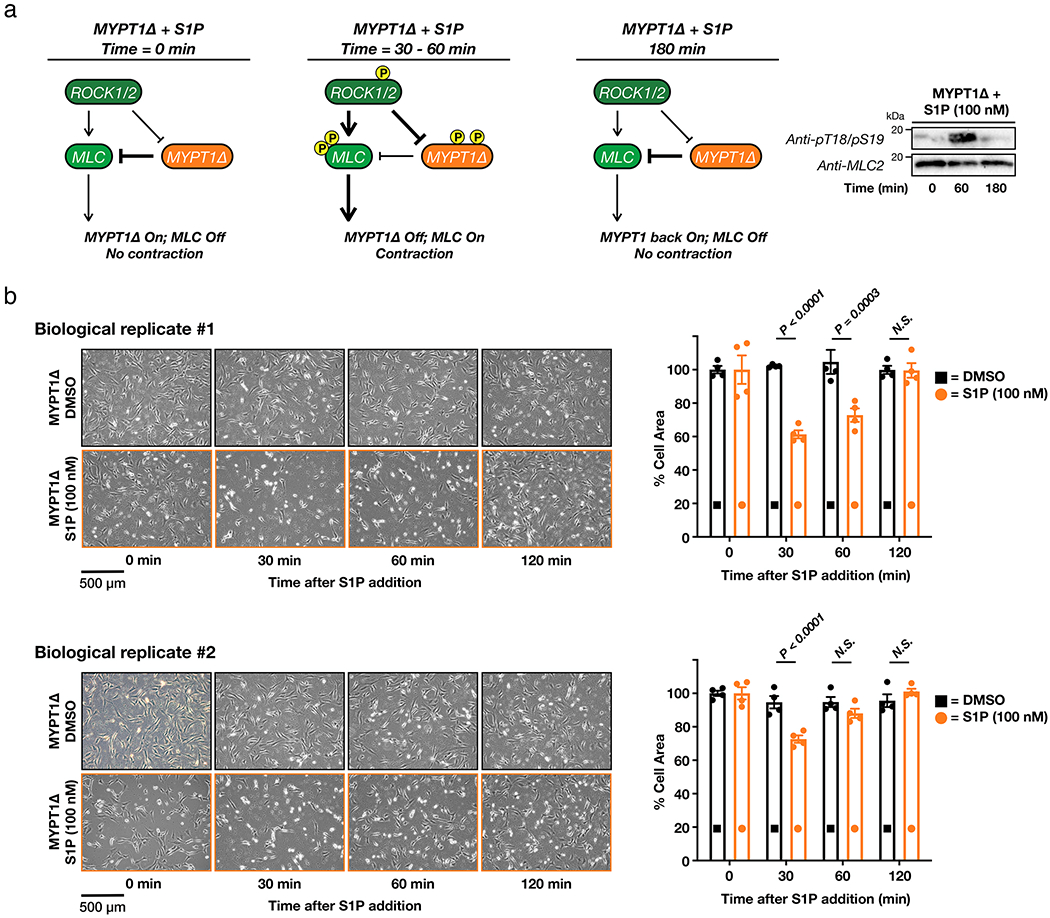
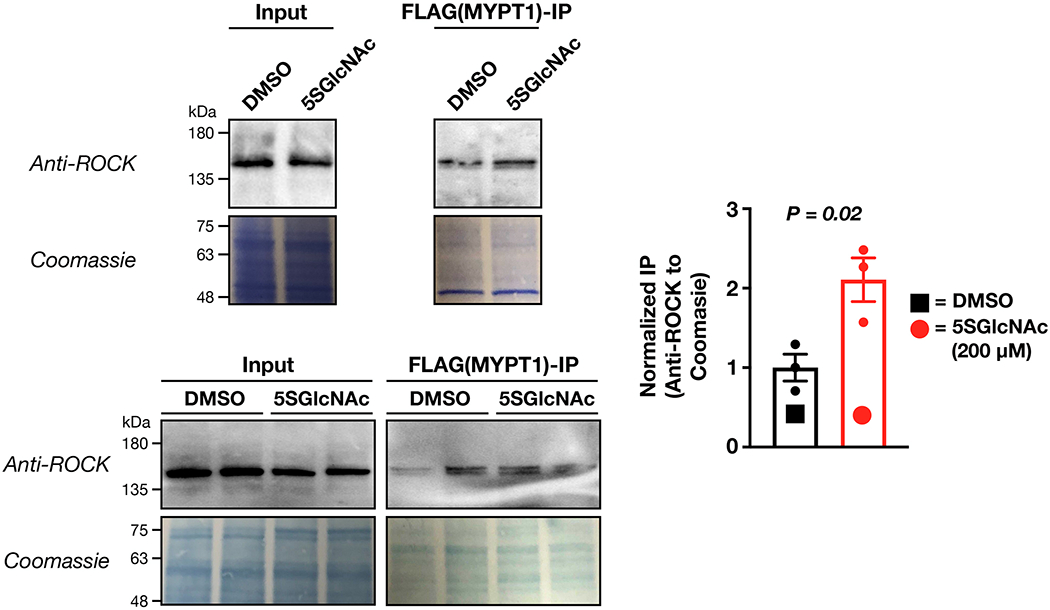
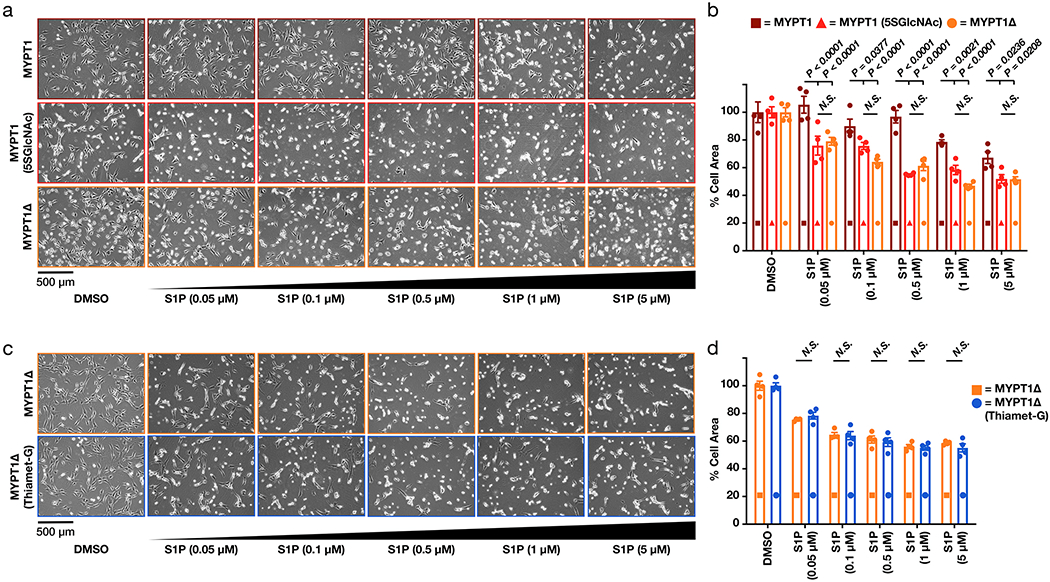
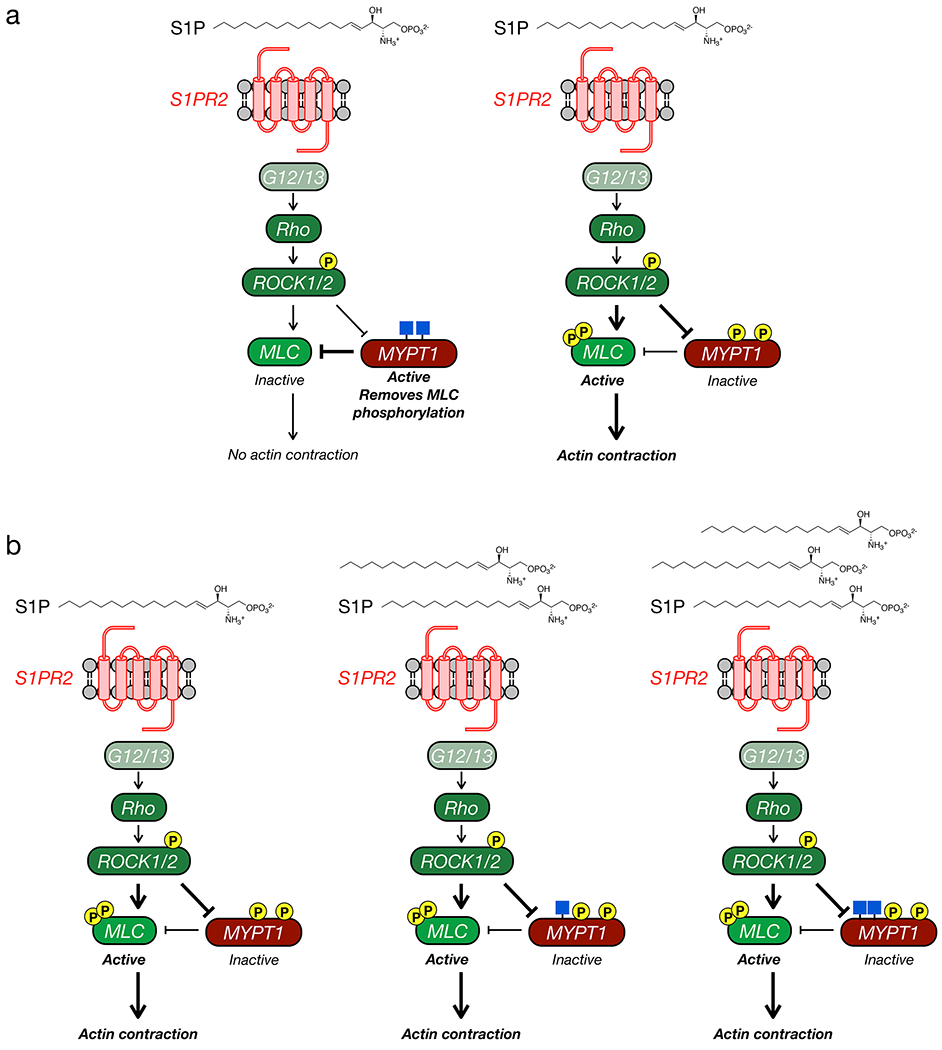
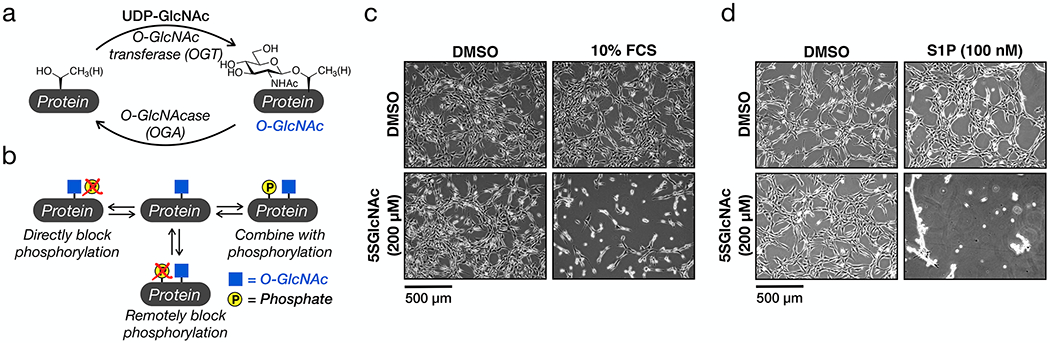
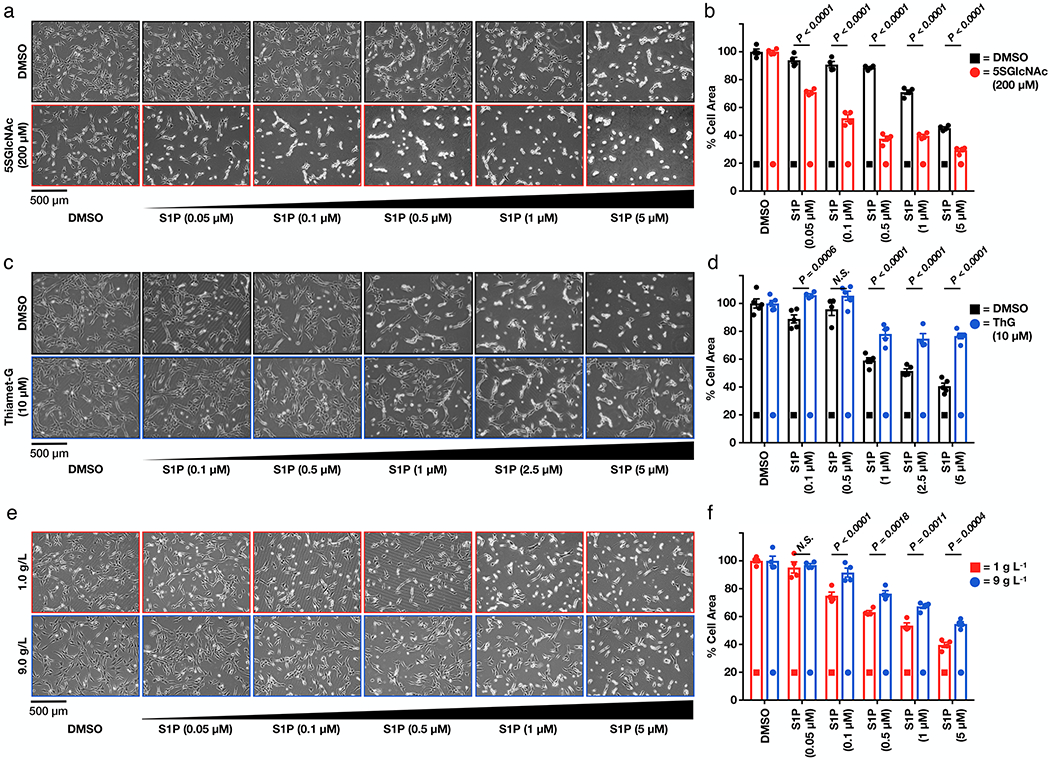
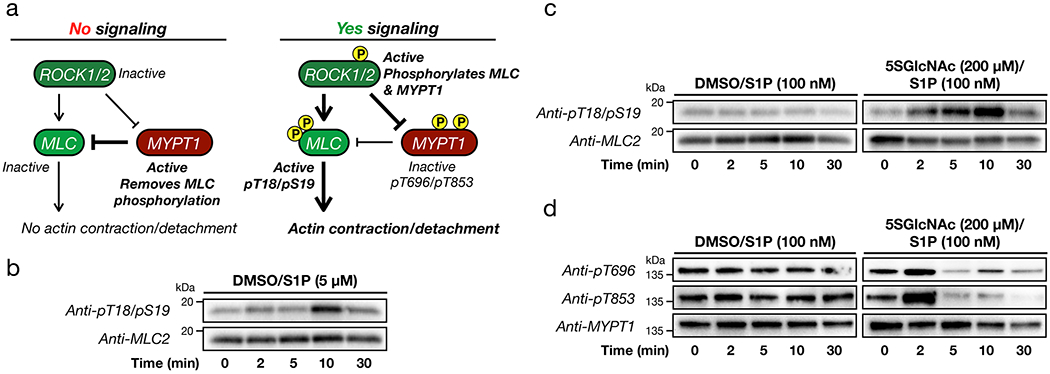
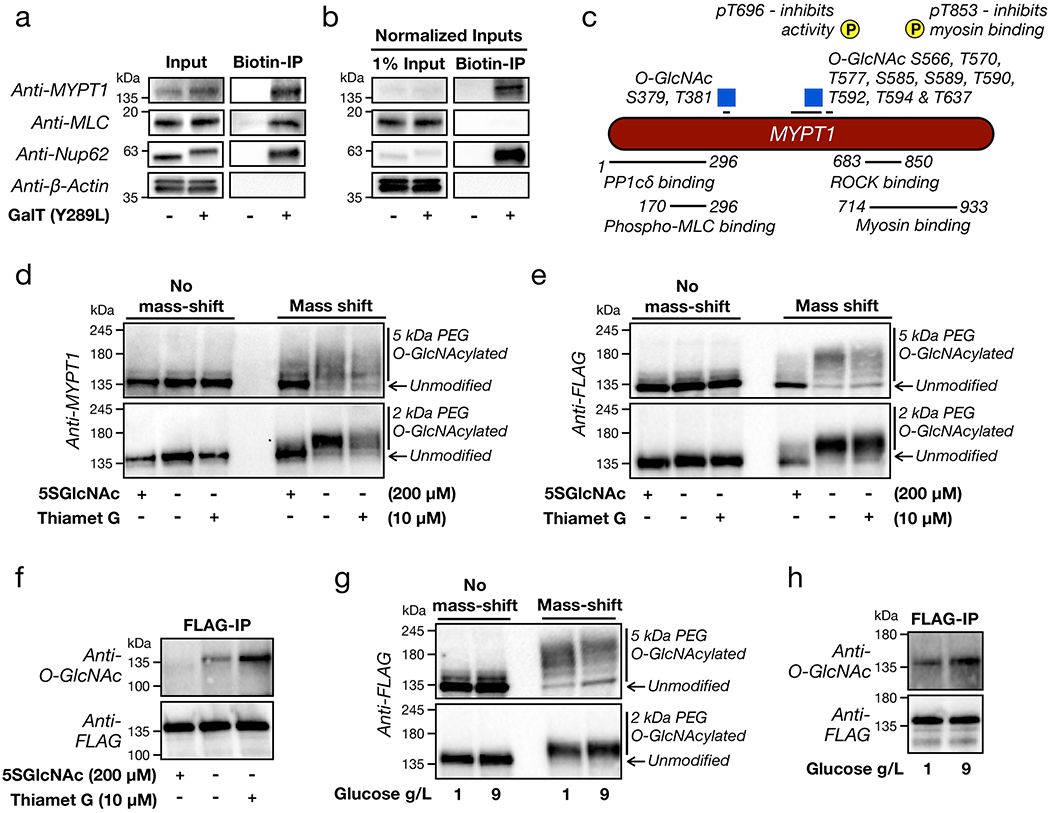
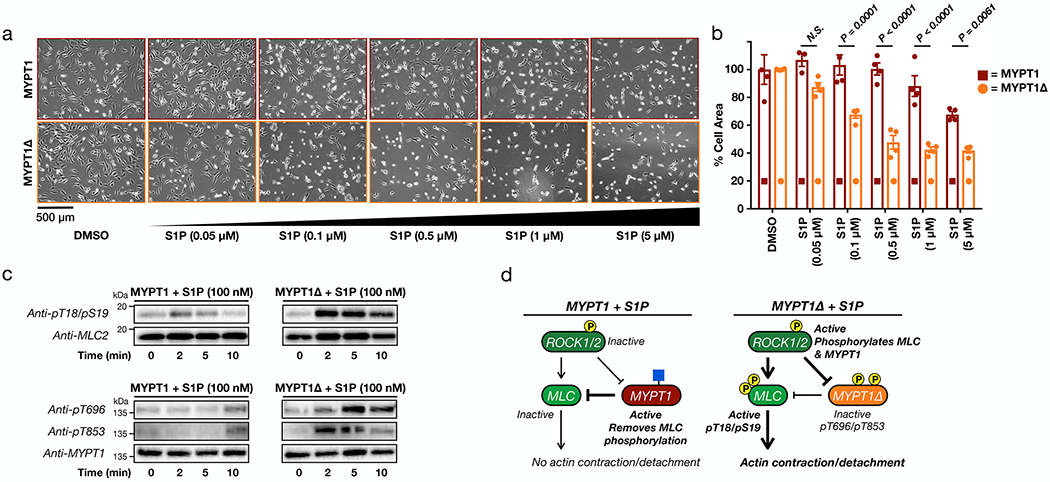
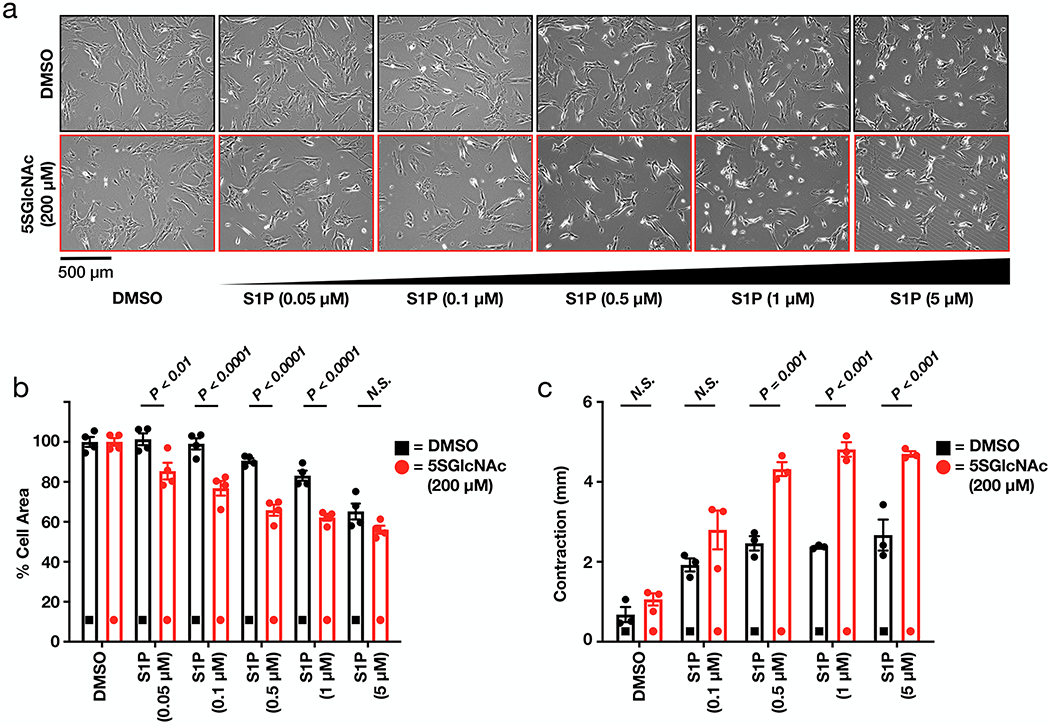
Many intracellular proteins are modified by N-acetylglucosamine, a post-translational modification termed O-GlcNAc. This modification is found on serine and threonine side chains and has the potential to regulate signaling pathways through interplay with phosphorylation. Here, we discover and characterize one such example. We find that O-GlcNAc levels control the sensitivity of fibroblasts to actin contraction induced by the signaling lipid sphingosine-1-phosphate (S1P), culminating in the phosphorylation of myosin light chain (MLC) and cellular contraction. Specifically, O-GlcNAc modification of the phosphatase subunit MYPT1 inhibits this pathway by blocking MYPT1 phosphorylation, maintaining its activity and causing the dephosphorylation of MLC. Finally, we demonstrate that O-GlcNAc levels alter the sensitivity of primary human dermal fibroblasts in a collagen-matrix model of wound healing. Our findings have important implications for the role of O-GlcNAc in fibroblast motility and differentiation, particularly in diabetic wound healing.


Conflict of interest statement

COMPETING FINANCIAL INTERESTS

The authors declare no competing financial interests.

Figures

Extended Data Figure 1.
Extended Data Figure 1.. Modulating O-GlcNAcylation levels and identification of S1P.
a) Schematic layout of our general experimental conditions. b) O-GlcNAc levels can be changed upon OGT or OGA inhibition. NIH3T3 cells were treated with either the OGT inhibitor 5SGlcNAc, the OGA inhibitor Thiamet G, or DMSO vehicle respectively before the O-GlcNAc levels were analyzed by Western blotting. c) Only serum- or S1P-treatment results in notable cell contraction when O-GlcNAc levels have been lowered. NIH3T3 cells were treated with DMSO or 5SGlcNAc. The indicated signaling molecules were then added, and the contraction phenotype was then visualized using bright-field microscopy. The data in b-c is representative of 2 biological replicates.
Extended Data Figure 2.
Extended Data Figure 2.. O-GlcNAc controls the sensitivity of fibroblasts to sphingosine-1-phosphate (S1P) mediated cell contraction.
a) O-GlcNAc levels can be changed upon OGT inhibition. NIH3T3 cells were treated with either the OGT inhibitor ST060266 or DMSO vehicle respectively before the O-GlcNAc levels were analyzed by Western blotting. b) O-GlcNAc levels can be lowered by OGT RNAi. NIH3T3 cells were transfected with RNAi targeting OGT or a scrambled sequence before analysis by Western blotting. c) NIH3T3 cells were treated with the indicated combinations of DMSO, the OGT inhibitor ST060266 (200 μM) and/or S1P. The contraction phenotype was then visualized using bright-field microscopy. d) NIH3T3 cells were transfected with either scramble or OGT-targeted RNAi for 48 h before addition of either DMSO or S1P. The contraction phenotype was then visualized using bright-field microscopy. e) O-GlcNAc levels can be changed by culturing cells in different glucose concentrations. NIH3T3 cells were cultured in the indicated concentrations of glucose before analysis by Western blotting. The data in a-e is representative of at least 2 biological replicates.
Extended Data Figure 3.
Extended Data Figure 3.. Signaling through the second S1P receptor, S1PR2, is responsible for the contraction phenotype.
a) NIH3T3 cells can express all five S1P GPCRs (S1PR1 to 5). mRNA was collected from NIH3T3 cells before being subjected to RT-PCR and visualization on an DNA-agarose gel. These data are representative of 2 biological replicates. b) Antagonizing S1PR2, but not the other receptors, inhibits S1P-mediated cell contraction. NIH3T3 cells were treated with either DMSO or 5SGlcNAc. The same cells were then treated with either additional DMSO or the indicated selective antagonists followed by S1P. The contraction phenotype was then visualized using bright-field microscopy. c) Quantitation of the data in (b). Results are the mean ± SEM of the relative culture plate area taken-up by cells in at least three randomly selected frames. Statistical significance was determined using a 2-tailed student’s t-test. d) S1PR5 agonism does not induce cell contraction. NIH3T3 cells were treated with either DMSO or 5SGlcNAc. The same cells were then treated with either S1P or the S1PR5-selective agonist A971432. The contraction phenotype was then visualized using bright-field microscopy. e) Quantitation of the data in (d). Results are the mean ± SEM of the relative culture plate area taken-up by cells in at least three randomly selected frames. Statistical significance was determined using a 2-tailed student’s t-test. f) Lowering O-GlcNAc levels increases the sensitivity of NIH3T3 cells to S1PR2 induced cell contraction. NIH3T3 cells were treated with either DMSO or 5SGlcNAc before addition of the indicated concentrations of the S1PR2-selective agonist CYM5220. The contraction phenotype was then visualized using bright-field microscopy. g) Quantitation of the data in (f). Results are the mean ± SEM of the relative culture plate area taken-up by cells in four randomly selected frames. Statistical significance was determined using a 2-way ANOVA test followed by Sidak’s multiple comparisons test. h) S1PR2 knockdown using siRNA blocks contraction phenotype. NIH3T3 cells were transfected with either scramble or S1Pr2-targeted RNAi before addition of DMSO or S1P. The contraction phenotype was then visualized using bright-field microscopy. i). Quantitation of the data in (h). Results are the mean ± SEM of the relative culture plate area taken-up by cells in three randomly selected frames. Statistical significance was determined using a 2-way ANOVA test followed by Sidak’s multiple comparisons test.
Extended Data Figure 4.
Extended Data Figure 4.. Inhibition of Rho kinase (ROCK1/2) blocks S1P-mediated cell contraction.
NIH3T3 cells were treated with either DMSO or 5SGlcNAc. The same cells were then treated with either additional DMSO or the ROCK1/2 inhibitor Y27632 followed by the indicated concentrations of S1P. The contraction phenotype was then visualized using bright-field microscopy. The results were then quantified and are presented as mean ± SEM of the relative culture plate area taken-up by cells in four randomly selected frames.
Extended Data Figure 5.
Extended Data Figure 5.. Analysis of MYPT1 mutants shows that deletion of the serine/threonine domain sensitizes cells to S1P-mediated contraction.
a) Sequence alignment of MYPT1 and the different mutants tested here. Red indicates potential O-GlcNAc modification sites (S or T), and blue indicates O-GlcNAc sites previously identified by mass spectrometry. MYTP1(S/TtoA) mutates all of the previously identified O-GlcNAc sites, MYPT1(d564-578) deletes the first serine/threonine rich region, MYPT1(d588-602) deletes the second serine/threonine rich region, and MYPT1Δ deletes the entire serine/threonine rich domain. b) MYPT1Δ, and to a lesser extent MYPT1(d564-578), sensitizes cells to S1P-mediated contraction. NIH3T3 cells expressing the indicated MYPT1 proteins and the endogenous copy was removed by RNAi. DMSO or S1P was then added and the contraction of the cells was measured. Results are the mean ± SEM of the relative culture plate area taken-up by cells in four randomly selected frames. Statistical significance was determined using a 2-way ANOVA test followed by Sidak’s multiple comparisons test.
Extended Data Figure 6.
Extended Data Figure 6.. Deletion of the MYPT1 serine/threonine rich domain yields MYPT1Δ with reduced O-GlcNAc modification.
a) Schematic of the MYPT1Δ protein, which lacks the major O-GlcNAc region of the protein. b&c) MYPT1Δ loses a notable amount of O-GlcNAc. The O-GlcNAc levels of FLAG-tagged MYPT1 or MYPT1Δ were analyzed using mass-shifting or IP-Western blot. The data in are representative of at least 2 biological replicates.
Extended Data Figure 7.
Extended Data Figure 7.. MYPT1Δ is an active phosphatase that can dephosphorylate MLC and return cells to a relaxed state.
a) If MYPT1Δ is an active phosphatase, we expect that it will become phosphorylated and deactivated by ROCK after S1P treatment but will return to a desphosphorylated and active state after a longer period of time. This will result in MLC dephosphorylation and relaxation of the cells. This is exactly what we observed by Western blotting. These data are representative of 2 biological replicates. b) Cells expressing MYPT1Δ return to a relaxed state over 180 min. The contraction phenotype was visualized using bright-field microscopy. The results were then quantified and are presented as mean ± SEM of the relative culture plate area taken-up by cells in four randomly selected frames. Statistical significance was determined using a 2-way ANOVA test followed by Sidak’s multiple comparisons test.
Extended Data Figure 8.
Extended Data Figure 8.. O-GlcNAc blocks the interaction between MYPT1 and ROCK.
NIH3T3 cells expressing flag-tagged MYPT1 were treated with either DMSO or 5SGlcNAc (200 μM). An anti-flag co-immunoprecipitation was then performed using the Catch and Release system (Thermo). ROCK enrichment was detected by Western blotting and normalized to overall protein capture (Coomassie staining). The results were quantities and presented as mean ± SEM of the normalized ROCK levels (n = 3 biological replicates). Statistical significance was determined using a 2-tailed, unpaired Student’s t-test.
Extended Data Figure 9.
Extended Data Figure 9.. Direct MYPT1 O-GlcNAcylation is largely responsible for the phenotype.
a) NIH3T3 cells stably expressing either MYPT1 or MYTP1Δ were transfected with RNAi to downregulate endogenous MYTP1. MYTP1-expressing cells were then treated with either DMSO or 5SGlcNAc. Cells under all three sets of conditions were then treated with the indicated concentrations of S1P. The contraction phenotype was visualized using bright-field microscopy. The results were then quantified and are presented as mean ± SEM of the relative culture plate area taken-up by cells in four randomly selected frames. Statistical significance was determined using a 2-way ANOVA test followed by Sidak’s multiple comparisons test. b) NIH3T3 cells stably expressing either MYPT1 or MYTP1Δ were transfected with RNAi to downregulate endogenous MYTP1. MYTP1-expressing cells were then treated with either DMSO or Thiamet-G. Cells under all three sets of conditions were then treated with the indicated concentrations of S1P. The contraction phenotype was visualized using bright-field microscopy. The results were then quantified and are presented as mean ± SEM of the relative culture plate area taken-up by cells in four randomly selected frames. Statistical significance was determined using a 2-way ANOVA test followed by Sidak’s multiple comparisons test.
Extended Data Figure 10.
Extended Data Figure 10.. Our experimental model.
a) MYPT1 O-GlcNAcylation inhibits its phosphorylation by ROCK1/2. This maintains MYPT1 phosphatase activity, resulting in inactive MLC and no actin contraction. Loss of O-GlcNAc enables ROCK1/2 to phosphorylate and deactivate MYTP1. b) Therefore, MYPT1 O-GlcNAcylation levels control the sensitivity of cells to the concentration of S1P, where more MYTP1 O-GlcNAcylation requires more S1P to illicit actin contraction and cell detachment.
Figure 1.
Figure 1.. O-GlcNAc controls the sensitivity of fibroblasts to sphingosine-1-phosphate (S1P) mediated cell contraction.
a) O-GlcNAcylation is the dynamic addition to N-acetylglucosamine to serine and threonine residues of intracellular proteins. b) O-GlcNAcylation has its own functions but can also antagonize phosphorylation, both directly and remotely, as well as combine with phosphorylation to illicit biological outcomes. c) NIH3T3 cells were treated with the indicated combinations of DMSO, the OGT inhibitor 5SGlcNAc, and/or 10% FCS. The contraction phenotype was then visualized using bright-field microscopy. d) NIH3T3 cells were treated with the indicated combinations of DMSO, 5SGlcNAc, and/or S1P. The contraction phenotype was then visualized using bright-field microscopy. The data in c and d is representative of at least two biological replicates.
Figure 2.
Figure 2.. O-GlcNAc controls the sensitivity of cells to S1P-mediated contraction.
a) Lowering O-GlcNAc levels increases the sensitivity of NIH3T3 cells to S1P induced cell contraction. NIH3T3 cells were pre-treated with either DMSO or 5SGlcNAc before addition of the indicated concentrations of S1P. The contraction phenotype was then visualized using bright-field microscopy. b) Quantitation of the data in (a). Results are the mean ± SEM of the relative culture plate area taken-up by cells in four randomly selected frames. Statistical significance was determined using a 2-way ANOVA test followed by Sidak’s multiple comparisons test. c) Raising O-GlcNAc levels decreases the sensitivity of NIH3T3 cells to S1P induced cell contraction. NIH3T3 cells that had been treated with either DMSO or Thiamet-G before addition of the indicated concentrations of S1P. The contraction phenotype was then visualized using bright-field microscopy. d) Quantitation of the data in (c). Results are the mean ± SEM of the relative culture plate area taken-up by cells in at least four randomly selected frames. Statistical significance was determined using a 2-way ANOVA test followed by Sidak’s multiple comparisons test. e) Glucose concentration controls the sensitivity of NIH3T3 cells to S1P induced cell contraction. NIH3T3 cells were cultured in the indicated amounts of glucose before addition of the indicated concentrations of S1P. The contraction phenotype was then visualized using bright-field microscopy. f) Quantitation of the data in (e). Results are the mean ± SEM of the relative culture plate area taken-up by cells in four randomly selected frames. Statistical significance was determined using a 2-way ANOVA test followed by Sidak’s multiple comparisons test.
Figure 3.
Figure 3.. O-GlcNAc levels control S1P-mediated phosphorylation of MLC and MYPT1.
a) Schematic of the ROCK-signaling pathway that can result in cellular contraction. Under no or low signaling conditions ROCK does not phosphorylate MLC or MYPT1, and MYPT1 remains active to dephosphorylate MLC. Upon induction of signaling, ROCK phosphorylates both MLC to activate contraction and MYPT1 to inactivate dephosphorylation, effectively pushing on the gas and cutting the brake. b) MLC is phosphorylated under high S1P signaling. NIH3T3 cells were treated with S1P for the indicated lengths of time. MLC phosphorylation, and thus activation, was visualized using Western blotting. c) MLC is phosphorylated under low S1P signaling when O-GlcNAc levels are reduced. NIH3T3 cells were treated with either DMSO or 5SGlcNAc followed by S1P for the indicated lengths of time. MLC phosphorylation, and thus its activation, was visualized using Western blotting. d) MYPT1 is phosphorylated under low S1P signaling when O-GlcNAc levels are reduced. NIH3T3 cells were treated with either DMSO or 5SGlcNAc followed by S1P for the indicated lengths of time. MYPT1 phosphorylation, and thus its deactivation, was visualized using Western blotting. The data in b-d is representative of 2 biological replicates.
Figure 4.
Figure 4.. MYPT1 is heavily and dynamically O-GlcNAc modified near its ROCK-binding domain.
a) MLC and MYPT1 are both O-GlcNAc modified. O-GlcNAc modified proteins from NIH3T3 cells were enriched using chemoenzymatic labelling and analyzed by Western blotting. Nucleoporin 62 (Nup62) is a known, heavily O-GlcNAc modified protein, and β-actin serves as a negative control. b) MYPT1 is highly O-GlcNAc modified, while MLC is not. the samples in (a) were normalized for inputs and analyzed by Western blotting. c) Schematic of identified MYPT1 O-GlcNAc sites, as well as the two deactivating phosphorylation sites and regions of MYPT1 responsible for critical protein-protein interactions. d) Endogenous MYPT1 is heavily and dynamically O-GlcNAc modified. NIH3T3 cells were treated with either 5SGlcNAc, Thiamet-G, or DMSO vehicle. The O-GlcNAc modified proteins were then subjected to chemoenzymatic modification and then “mass-shifted” by PEGylation causing the modified fraction of proteins to run at higher molecular weights when analyzed by Western blotting. e-h) NIH3T3 cells stably expressing FLAG-tagged MYTP1 were treated under the indicated conditions before analysis by either mass-shifting or IP-Western blot. The data in a, b, & d-i are representative of at least 2 biological replicates.
Figure 5.
Figure 5.. MYPT1 O-GlcNAc modification prevents its phosphorylation and deactivation, thereby inhibiting S1P-mediated contraction.
a) MYTP1Δ expression sensitizes cells to S1P-mediated contraction. NIH3T3 cells stably expressing either MYPT1 or MYTP1Δ were transfected with RNAi to downregulate endogenous MYTP1. They were then treated with the indicated concentrations of S1P. The contraction phenotype was visualized using bright-field microscopy. b) Quantitation of the data in (a). Results are the mean ± SEM of the relative culture plate area taken-up by cells in at least three randomly selected frames. Statistical significance was determined using a 2-way ANOVA test followed by Sidak’s multiple comparisons test. c) MYPT1Δ is more readily phosphorylated upon low S1P signaling. NIH3T3 cells stably expressing either MYPT1 or MYTP1Δ were transfected with RNAi to downregulate endogenous MYTP1. They were then treated with S1P for the indicated lengths of time. MLC and MYPT1/MYPT1Δ phosphorylation were analyzed by Western blotting. These data are representative of 2 biological replicates. d) Our model. When MYPT1 is O-GlcNAc modified it is more resistant to phosphorylation and deactivation, thus maintaining the brakes on contraction. When MYTP1 O-GlcNAc is lost, it is phosphorylated, resulting in MLC phosphorylation and contraction.
Figure 6.
Figure 6.. O-GlcNAc controls S1P-mediated collagen matrix contraction.
a) Lowering O-GlcNAc levels increases the sensitivity of human dermal fibroblasts to S1P induced cell contraction in 2D culture. Fibroblasts were pre-treated with either DMSO or 5SGlcNAc before addition of the indicated concentrations of S1P. The contraction phenotype was then visualized using bright-field microscopy. b) Quantitation of the data in (a) Results are the mean ± SEM of the relative culture plate area taken-up by cells in four randomly selected frames. Statistical significance was determined using a 2-way ANOVA test followed by Sidak’s multiple comparisons test. c) Lowering O-GlcNAc increased the contraction of stressed collagen matrices in response to S1P. Contraction in millimeters was quantified as change in each matrix diameter from the initiation (t = 0 min) to termination (t = 30 min) of the assay. Results are the mean ± SEM of the millimeters contracted from three separate experiments. Statistical significance was determined using a 2-way ANOVA test followed by Sidak’s multiple comparisons test.

References

    1. Yang X & Qian K Protein O-GlcNAcylation: emerging mechanisms and functions. Nat Rev Mol Cell Biol 18, 452–465 (2017). - PMC - PubMed
    1. Zachara NE Critical observations that shaped our understanding of the function(s) of intracellular glycosylation (O‐Glc NAc). FEBS Lett 592, 3950–3975 (2018). - PMC - PubMed
    1. King DT, Males A, Davies GJ & Vocadlo DJ Molecular mechanisms regulating O-linked N-acetylglucosamine (O-GlcNAc)–processing enzymes. Current Opinion in Chemical Biology 53, 131–144 (2019). - PubMed
    1. Hart GW Nutrient regulation of signaling and transcription. J Biol Chem 294, 2211–2231 (2019). - PMC - PubMed
    1. Marshall S, Bacote V & Traxinger RR Discovery of a metabolic pathway mediating glucose-induced desensitization of the glucose transport system. Role of hexosamine biosynthesis in the induction of insulin resistance. 266, 4706–4712 (1991). - PubMed

Publication types

MeSH terms