. 2020 Oct;52(10):1036-1045.
doi: 10.1038/s41588-020-0684-4. Epub 2020 Sep 14.

Complex genetic signatures in immune cells underlie autoimmunity and inform therapy

Affiliations

Complex genetic signatures in immune cells underlie autoimmunity and inform therapy

Valeria Orrù et al. Nat Genet. 2020 Oct.

Erratum in

Abstract

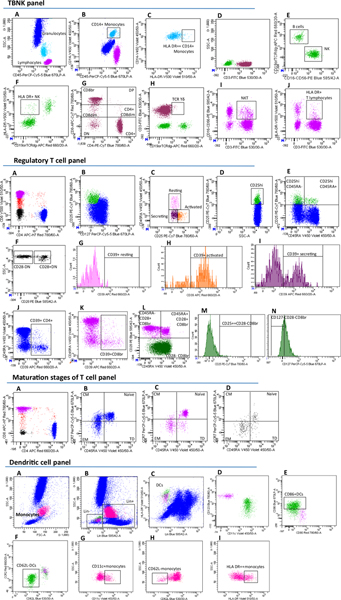
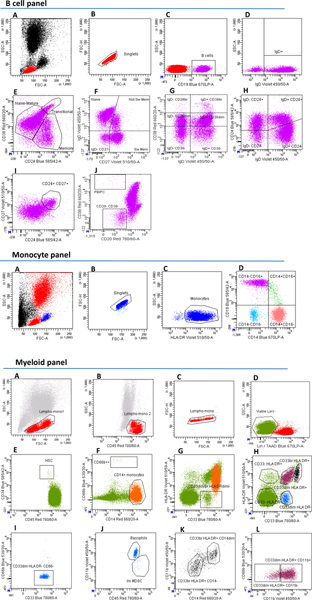
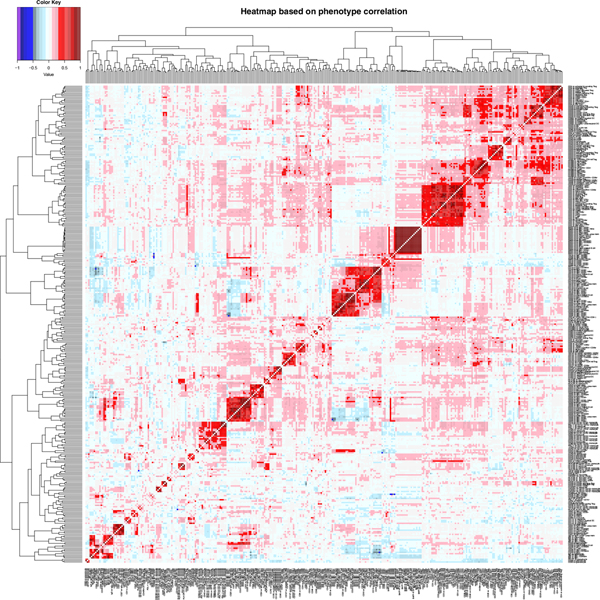
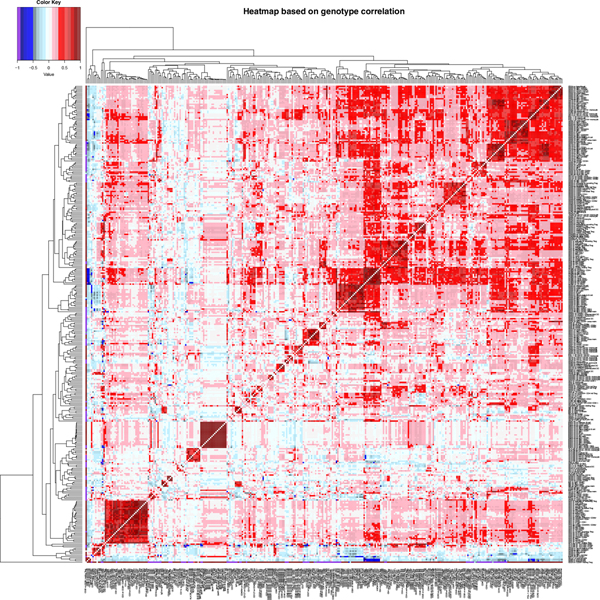
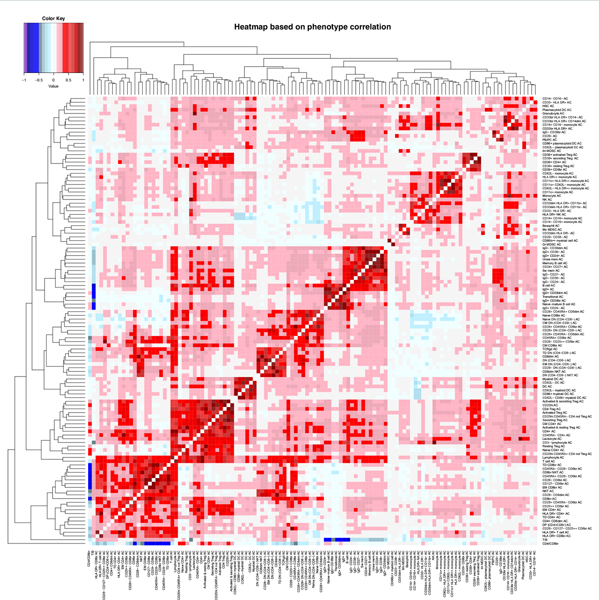
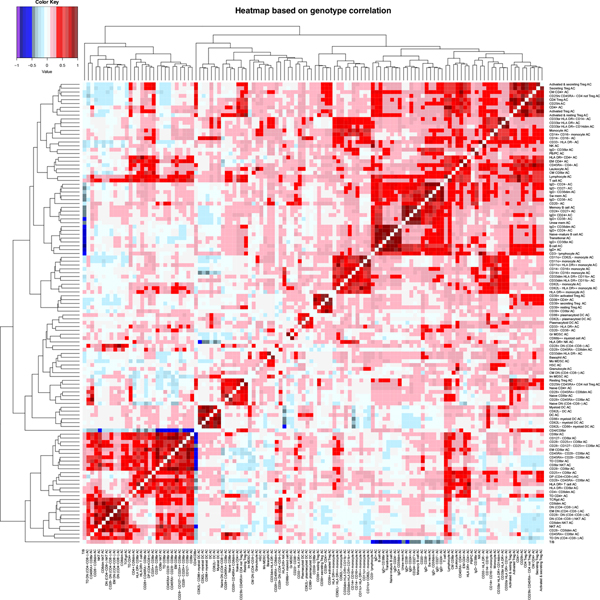
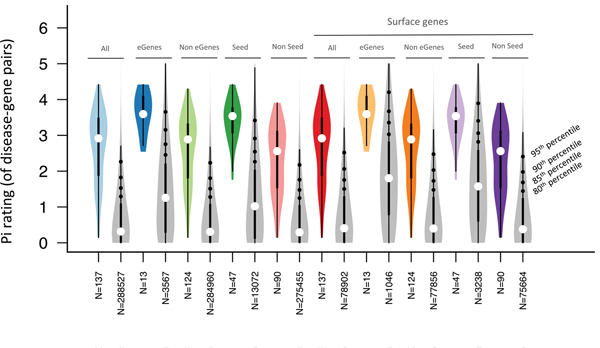
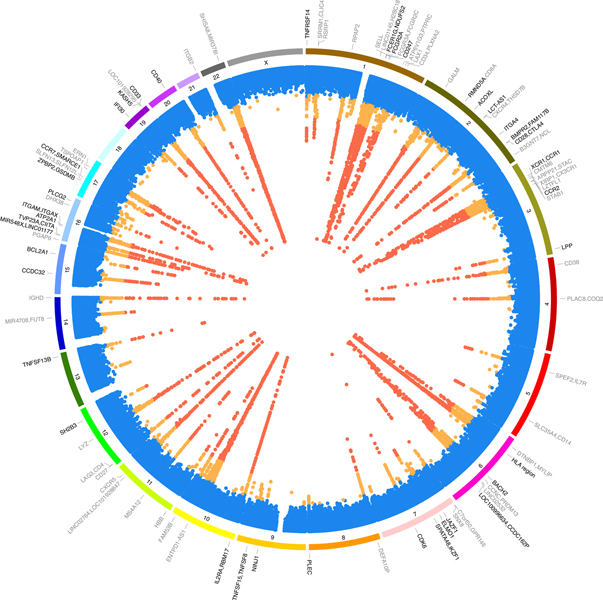
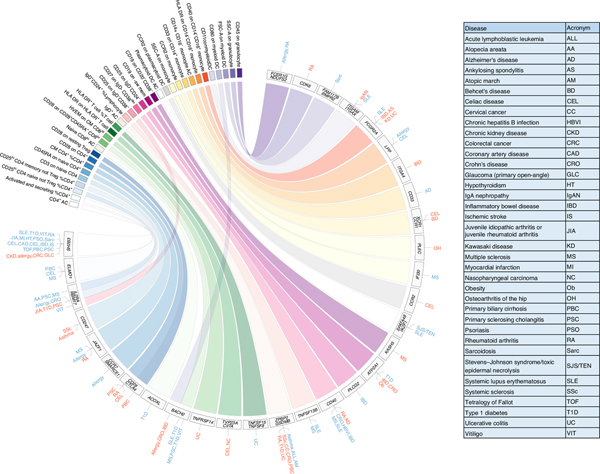
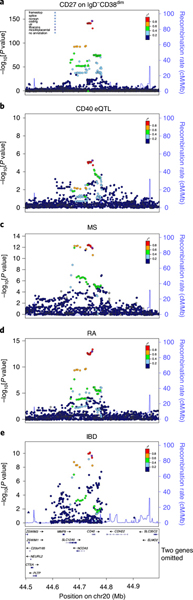
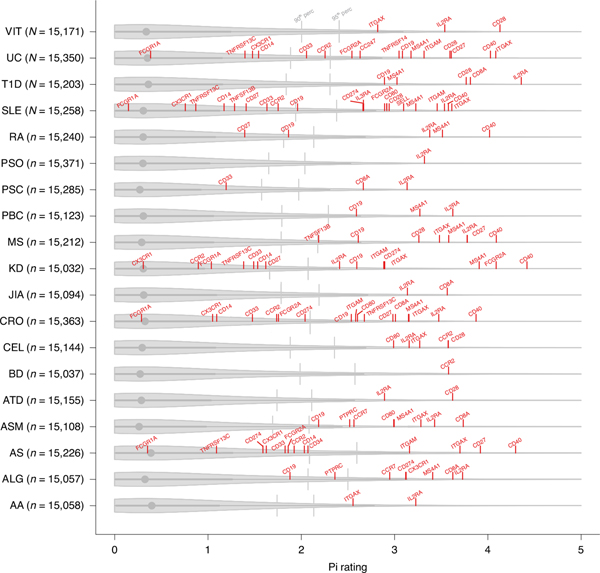
We report on the influence of ~22 million variants on 731 immune cell traits in a cohort of 3,757 Sardinians. We detected 122 significant (P < 1.28 × 10⁻¹¹) independent association signals for 459 cell traits at 70 loci (53 of them novel) identifying several molecules and mechanisms involved in cell regulation. Furthermore, 53 signals at 36 loci overlapped with previously reported disease-associated signals, predominantly for autoimmune disorders, highlighting intermediate phenotypes in pathogenesis. Collectively, our findings illustrate complex genetic regulation of immune cells with highly selective effects on autoimmune disease risk at the cell-subtype level. These results identify drug-targetable pathways informing the design of more specific treatments for autoimmune diseases.


Conflict of interest statement

Competing interests

The authors declare no competing interests.

Figures

Extended Data Fig. 1 |
Extended Data Fig. 1 |. Flow cytometry gating strategy of TBNK, regulatory T cell, maturation stages of T cell, and dendritic cell antibody panel.
TBNK panel. a, Lymphocytes (violet) and granulocytes (blue). b, CD14+ monocytes (light blue). c, HLA DR++CD14+ monocytes. d, CD3+ (T cells, purple) and CD3− (green) lymphocytes. e, B and NK cells are CD19+ and CD16/CD56+, respectively. f, HLA DR+ NK cells. g, T cells are divided based on CD4 and CD8 expression. h, TCR-ϒδ+ T cells. i, NKT are CD3+ and CD16/CD56+. j, HLA DR+ T cells. HLA DR+CD4 and HLA DR+CD8 subsets are obtained by intersecting HLA DR+ T cell with CD4+ and CD8br lymphocytes. Regulatory T cell panel. a, CD4+ (blue) and CD8+ (violet) lymphocytes. b, CD4+ Tregs (green) are CD25high CD127low. c, Resting (CD45RA+CD25++, pink), activated (CD45RA-CD25+++, orange) and secreting (CD45RA-CD25++, purple) CD4+ Tregs. D-E) CD25hiCD4+ lymphocytes are divided based on CD45RA expression. F) CD4-CD8− T cells (DN, black) are divided in CD28+ and CD28−. G-H-I-J-K) CD39 expression on Treg subsets, CD4 and CD8br T cells, respectively. L) CD8br cells division based on CD45RA vs CD28 expression. M-N) CD25++CD28-CD8br and CD127-CD28-CD8br identification. Maturation stages of T cell panel. a, CD4+ (blue), CD8br (violet) and CD4-CD8− (black) T cells are analyzed for CD45RA vs CCR7 (plots B-C-D, respectively) identifying naïve (CCR7+CD45RA+), central memory (CM, CCR7+CD45RA−), effector memory (EM, CCR7-CD45RA−), and terminally differentiated (TD, CCR7-CD45RA+) subsets. Dendritic cell antibody panel. a, Monocytes (pink). b, c, DCs are Lineage (Lin) negative and HLA DR+. d, Myeloid (green) and plasmacytoid (violet) DCs are CD11c+ and CD123+, respectively. e, f, CD86 and CD62L expression on cDC. G-H-I) CD11c, CD62L and HLA DR expression on monocytes.
Extended Data Fig. 2 |
Extended Data Fig. 2 |. Flow cytometry gating strategy of B cell, monocyte, myeloid cell antibody panel.
B cell panel. a-b, Lymphocyte (red). c, B lymphocytes (violet) are CD19+. d, IgD+ B cells. B cells classification based on e) CD24 vs CD38; f) CD27 vs IgD; g) IgD vs CD38; h) IgD vs CD24; i) CD24+CD27+ memory B cells. j, Plasma blasts/plasma cells (PB/PC) are CD20-CD38hi B cells. Monocyte panel. A-B-C) Monocyte (blue). D) Monocytes division into CD14+CD16− (classical), CD14-CD16+ (non-classical) and CD14+CD16+ (intermediate). Myeloid panel. A-B-C) Lympho-monocytes (red). d, Viable and myeloid-enriched cells (green) are obtained excluding lymphoid cells, which are lineage1 (Lin1) positive, and dead cells, which are 7-aminoactinomycin-D (7AAD) positive. e, Hematopoietic stem cells (HSC). f, CD14 vs CD66b expression and g) CD33 vs HLA DR expression on myeloid-enriched cells. The intersection of CD33dim/br HLA DRdim/− cells in g) with CD14+ monocytes (orange) in f) results in monocytic myeloid-derived dendritic cells (Mo MDSC). h, The deletion of CD14+ monocytes (orange) from cells in g) discriminates five subsets using CD33 vs HLA DR markers. i, CD66b+ cells were excluded from the CD33dim HLA DR− cells (blue) and j) the resulting CD33dimHLA DR-CD66− population was further divided into basophils and immature MDSC (Im MDSC) based on CD45 and CD11b expression. k, CD33br HLA DR+ cells (black) division into CD14 dim and CD14−. l, CD11b expression on CD33dim HLA DR+ cells (purple). Intersection of CD33dim HLA DR− in h) with CD66b++ cells in f) corresponds to granulocytic myeloid-derived dendritic cells (Gr MDSC).
Extended Data Fig. 3 |
Extended Data Fig. 3 |. Phenotypic correlation among expression level of surface markers.
Heatmap of phenotypic correlations for MFI pairs calculated using the Spearman coefficient. Dendrograms represent the clustering: short branches indicate strong phenotypic correlation between traits, whereas long branches weak correlation. Color gradations represent the correlation strength, with red indicating direct correlation (from 0 to +1) and blue inverse correlation (from 0 to −1).
Extended Data Fig. 4 |
Extended Data Fig. 4 |. Genetic correlation among expression level of surface markers.
Heatmap of genetic correlations for MFIs pairs calculated as previously described. The description of the figure is as for Extended Data Fig. 3.
Extended Data Fig. 5 |
Extended Data Fig. 5 |. Phenotypic correlation among cell levels.
Heatmap of phenotypic correlations for cell counts and T/B and CD4/CD8br ratios, calculated using the Spearman coefficient. The description of the figure is as for Extended Data Fig. 3.
Extended Data Fig. 6 |
Extended Data Fig. 6 |. Genetic correlation among absolute cell counts.
Heatmap of genetic correlations for cell counts and T/B and CD4/CD8br ratios, calculated as previously described. The description of the figure is as for Extended Data Fig. 3.
Extended Data Fig. 7 |
Extended Data Fig. 7 |. Drug target prioritization (Priority index, Pi) score of our drug targets candidates segmented by gene categories.
It is shown the distributions of the Pi-rating (computed in Fang et al., ) of our candidate genes (colored boxplots) segmented for different gene categories (“All” genes, “eGenes”, “Seed” genes and cell surface genes) with the relative background distributions (grey boxplots, that is that consider all the genes belonging to the respective category). eGenes means that the gene has an eQTL colocalizing with the disease; seed gene means that the genes have a genetic link to the disease (by eQTL, gene proximity or chromatin conformation) as defined in Fang et al., . The boxplot inside the violin plot reports a white circle indicating the median value, with the box limits indicating the upper and the lower quartiles. The whisker at the upper side of the box extends to the minimum between the interquartile range (IQR) x 1.5 and the overall maximum value of the data. The whisker at the bottom side of the box extends to the maximum between IQR x 1.5 and the overall minimum value of the data.
Fig. 1 |
Fig. 1 |. Schematic representation of the main leukocyte subsets assessed by GWAS.
The background colors indicate different cell groupings: T-cell populations are indicated in green, B cells in orange, DCs in yellow, monocytes in blue, other myeloid cells in violet, and hematopoietic stem cells in pink. The markers assessed for MFI are indicated within the light blue rectangles. TCRgd, gamma delta T cells; NK, natural killer cells; NKT, NK T cells; DN, CD4 CD8 T cells; DP, CD4+ CD8+ T cells; CM, central memory; EM, effector memory; HSCs, hematopoietic stem cells; Im MDSCs, immature myeloid-derived suppressor cells; Gr MDSCs, granulocytic MDSCs; Mo MDSCs, monocytic MDSCs; FSC, forward scatter; SSC, side scatter.
Fig. 2 |
Fig. 2 |. Genetic associations of the immune traits assessed.
The innermost track shows the lowest association P value among all traits for each locus. Significant variants (P < 1.28 × 10⁻¹¹) are in red, suggestive variants (P value ranging from 5 × 10⁻⁸ to 1.28 × 10⁻¹¹) in orange, and non-significant variants in blue. The middle track shows the chromosome number. The outermost track indicates the genes nearest to signals with P < 1.28 × 10⁻¹¹. Genes showing coincident genetic association with diseases are shown in bold font. The coincident associated genes are indicated even if in some instances their P values range from 5 × 10⁻⁸ to 1.28 × 10⁻¹¹. The summary statistics were obtained using a linear mixed association model. The significance threshold was calculated by applying a Bonferroni correction to the empirical significance threshold (P = 6.9 × 10⁻⁹) considering 539 independent tests.
Fig. 3 |
Fig. 3 |. Coincident genetic association between immune traits and diseases.
The circular plot shows the top immune traits in colored rectangles and the genes nearest the associated signals in gray rectangles. The pathologies linked to the immune traits via coincident genetic associations (P < 5.0 × 10⁻⁸) are listed radially to the associated gene. The pathologies for which the protective allele correlates with a reduction of an immune trait level are in blue, whereas those for which the protective allele correlates with an increase are in red. The HLA region is not included. The pathology acronyms are detailed in the table. The summary statistics for the immune traits were obtained using a linear mixed association model.
Fig. 4 |
Fig. 4 |. Regional association plots in the CD40 region.
The significance of the association (−log10[P value]; left y axis) for each trait is plotted relative to the genomic positions on the hg19/GRCh37 genomic build (x axis). The symbols reflect genomic functional annotations. SNPs are colored to reflect their LD with rs1883832 (indicated with a purple dot). a, Expression of CD27 on IgDCD38dim cells. The P values were obtained using a linear mixed association model. b, CD40 expression on leukocytes calculated using RNA-seq data from Pala et al.. ce, Association profiles for the autoimmune diseases MS (c), RA (d) and IBD (e). The data plotted in ce are from published results,,. Genes, position of exons and direction of transcription are noted below e. The plots were drawn using the standalone version of LocusZoom.
Fig. 5 |
Fig. 5 |. Drug target prioritization (priority index, Pi) score of our drug target candidates.
The red lines indicate the Pi rating of our drug target candidates for the respective diseases (listed in Supplementary Table 8A,B). The gray violin plots indicate the distribution of the Pi rating, for the respective diseases, of all the genes for which a Pi rating has been computed (number of genes indicated in parenthesis). The gray lines indicate the 90th and the 95th percentiles of the Pi rating values. IgD, HLA, CD45RA and CD3 have been excluded because the Pi rating was not available. Gene aliases: TNFRSF13C (BAFF-R), ITGAM (CD11b), ITGAX (CD11c), IL3RA (CD123), MS4A1 (CD20), IL2RA (CD25), PTPRC (CD45), SELL (CD62L), FCGR1A (CD64), CD8A (CD8), TNFRSF14 (HVEM), FCGR2A (CD32). The acronyms are as in Fig. 3; ATD, autoimmune thyroiditis; ALG, allergy; ASM, asthma. The boxplot inside the violin plot reports a circle indicating the median value, with the box limits indicating the upper and the lower quartiles. The whisker at the upper side of the box extends to the minimum between the interquartile range × 1.5 and the overall maximum value of the data. The whisker at the bottom side of the box extends to the maximum between the interquartile range × 1.5 and the overall minimum value of the data.

Comment in

Similar articles

Cited by

References

    1. Orrù V et al. Genetic variants regulating immune cell levels in health and disease. Cell 155, 242–256 (2013). - PMC - PubMed
    1. Roederer M et al. The genetic architecture of the human immune system: a bioresource for autoimmunity and disease pathogenesis. Cell 161, 387–403 (2015). - PMC - PubMed
    1. Aguirre-Gamboa R et al. Differential effects of environmental and genetic factors on T and B cell immune traits. Cell Rep. 17, 2474–2487 (2016). - PMC - PubMed
    1. Patin E et al. Natural variation in the parameters of innate immune cells is preferentially driven by genetic factors. Nat. Immunol. 19, 302–314 (2018). - PubMed
    1. Lagou V et al. Genetic architecture of adaptive immune system identifies key immune regulators. Cell Rep. 25, 798–810 (2018). - PMC - PubMed

Publication types

MeSH terms