. 2020 Aug 13;10(22):10262-10273.
doi: 10.7150/thno.49047. eCollection 2020.

An ultrasensitive hybridization chain reaction-amplified CRISPR-Cas12a aptasensor for extracellular vesicle surface protein quantification

Affiliations

An ultrasensitive hybridization chain reaction-amplified CRISPR-Cas12a aptasensor for extracellular vesicle surface protein quantification

Shan Xing et al. Theranostics. .

Abstract

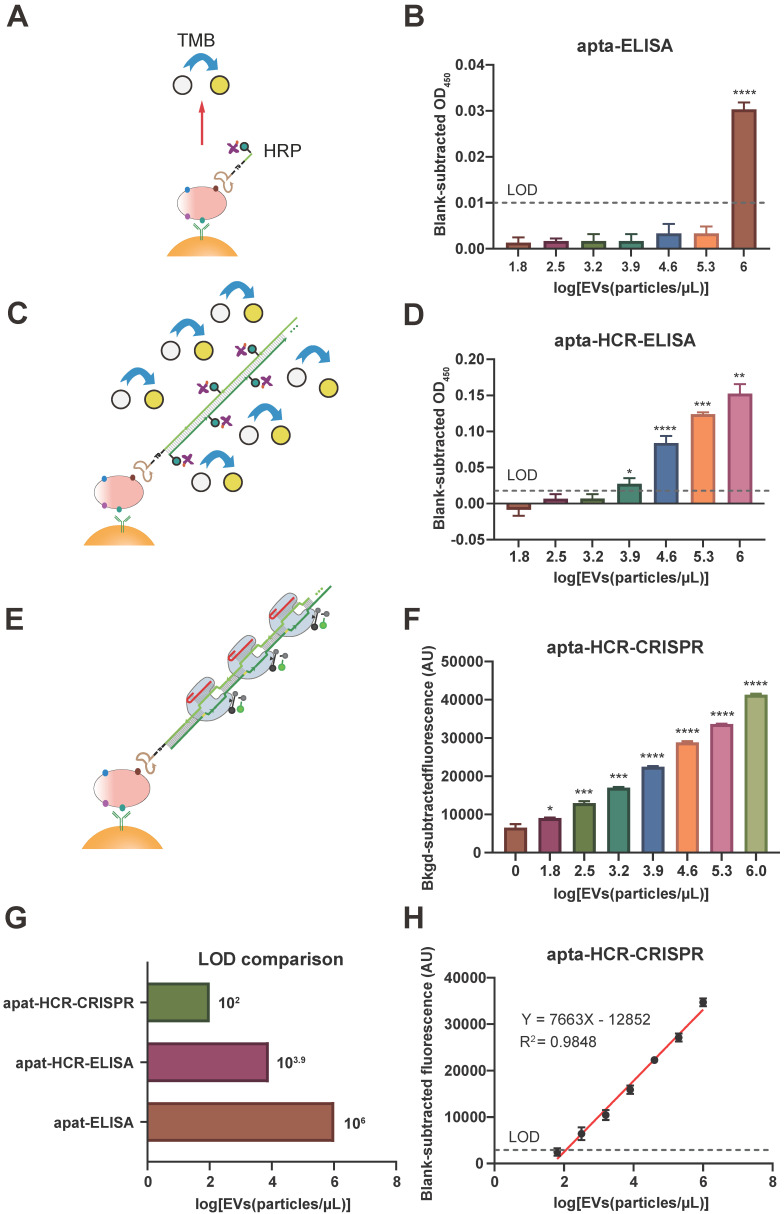
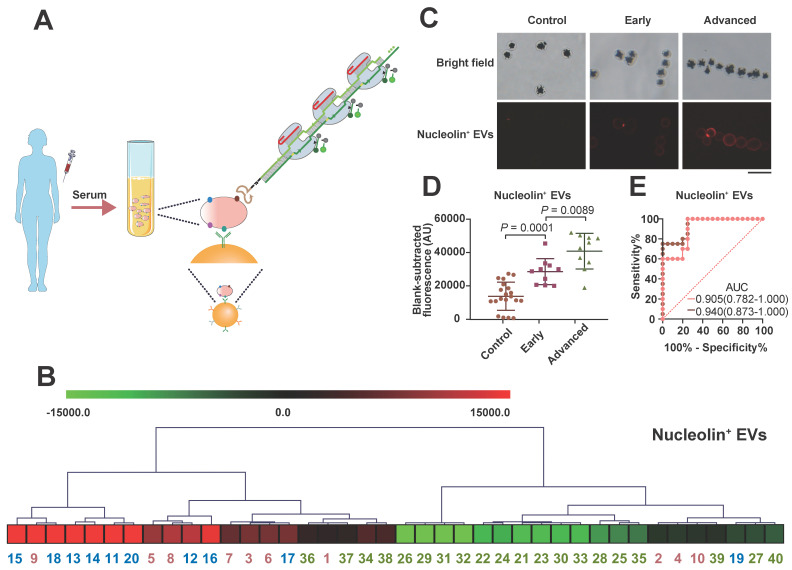
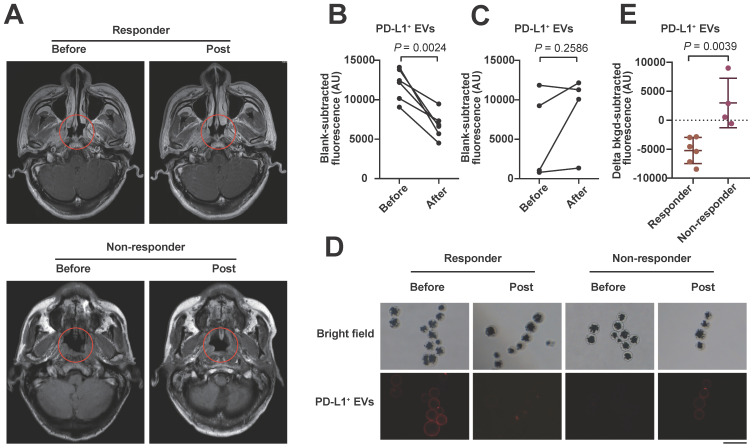
Tumor-derived extracellular vesicle (TEV) protein biomarkers facilitate cancer diagnosis and prognostic evaluations. However, the lack of reliable and convenient quantitative methods for evaluating TEV proteins prevents their clinical application. Methods: Here, based on dual amplification of hybridization chain reaction (HCR) and CRISPR-Cas12a, we developed the apta-HCR-CRISPR assay for direct high-sensitivity detection of TEV proteins. The TEV protein-targeted aptamer was amplified by HCR to produce a long-repeated sequence comprising multiple CRISPR RNA (crRNA) targetable barcodes, and the signals were further amplified by CRISPR-Cas12a collateral cleavage activities, resulting in a fluorescence signal. Results: The established strategy was verified by detecting the TEV protein markers nucleolin and programmed death ligand 1 (PD-L1). Both achieved limit of detection (LOD) values as low as 102 particles/µL, which is at least 104-fold more sensitive than aptamer-ELISA and 102-fold more sensitive than apta-HCR-ELISA. We directly applied our assay to a clinical analysis of circulating TEVs from 50 µL of serum, revealing potential applications of nucleolin+ TEVs for nasopharyngeal carcinoma cancer (NPC) diagnosis and PD-L1+ TEVs for therapeutic monitoring. Conclusion: The platform was simple and easy to operate, and this approach should be useful for the highly sensitive and versatile quantification of TEV proteins in clinical samples.

Keywords: Aptamer; CRISPR-Cas12a; Fluorescence; Hybridization chain reaction; Tumor-derived exosomes.


Conflict of interest statement

Competing Interests: The authors have declared that no competing interest exists.

Figures

Figure 1
Figure 1
Schematic of apta-HCR-CRISPR. The EVs are captured by a cocktail of anti-CD63-, anti-CD81- and anti-CD9 antibody-coated beads and recognized with H0. The formed antibody-EV-H0 complexes trigger HCR and generate long repetitive target sequences that are specifically recognized by the added crRNA/Cas12a duplex. Target-activated Cas12a trans-cleaves nearby ssDNA-FQ reporter, resulting in readable and accumulating fluorescence signal proportional to the concentration of target positive EVs.
Figure 2
Figure 2
Establishment of the HCR-CRISPR assay. (A) Agarose gel (left) and PAGE (right) images of the HCR nucleic acid amplification assay. Lane 1, 2.0 μM H1; lane 2, 2.0 μM H2; lane 3, 2.0 μM H1 and 2 μM H2 mixture; lane 4, NHCR, 0.5 μM nucleolin H0 mixed with a mixture of 2 μM H1 and 2 μM H2; lane 5, PHCR, 0.5 μM PD-L1 H0 mixed with a mixture of 2 μM H1 and 2 μM H2. (B) Diagram of the H1/H2 sequences within the HCR targeted by Cas12a and the respective crRNA. Highlighted bases indicate the 5′ PAM sequence. The same color represents a paired crRNA and PAM. (C) Observed FI of HCR-CRISPR using different crRNAs to target 1μL of nucleolin HCR (NHCR) products. The nonspecific (NS) crRNA controls showed a low or zero value after subtracting the background FI. The P values were calculated by comparison with the crRNA2 group using a one-way ANOVA followed by a Sidak multiple-comparisons test. *** and **** represent P < 0.001 and P < 0.0001, respectively. (D) Representative real-time fluorescence kinetic measurement of CRISPR-Cas12a using different targets: nucleolin H0 (NH0), PD-L1 H0 (PH0), H1, H2, NHCR and PD-L1 HCR (PHCR) products. Fluorescence measurements were taken every 5 min for 2 h. Error bars represent the mean ± SD, where n = 3. (E) Heterogeneous HCR-CRISPR mechanism. Real-time fluorescence kinetic measurement (F) and the observed FI (G) of the heterogeneous HCR-CRISPR. HCR (+): 50 nM H0 mixed with a mixture of 2 μM H1 and 2 μM H2; HCR (-): 0 nM H0 mixed with a mixture of 2 μM H1 and 2 μM H2. Unbound DNA sequences were discarded by washing three times. Error bars represent the mean ± SD, where n = 3. (H) Observed FI of CRISPR-Cas12a using 0.4 nM, 2 nM and 10 nM H2 dsDNA or duplicate consecutive H2 (H2-H2) as activators. dsDNA, double-stranded DNA. Error bars represent the mean ± SD, where n = 3. FI, fluorescence intensity. For G and H, statistical analyses were performed using a two-tailed Student's t-test.
Figure 3
Figure 3
Comparison of the apta-ELISA, apta-HCR-ELISA and apta-HCR-CRISPR assays. (A) apta-ELISA mechanism. In the apta-ELISA assay, EVs were added to the anti-CD63, anti-CD81 and anti-CD9 MBs, incubated with a biotinylated aptamer, and washed and resuspended in streptavidin-HRP. The reaction was launched by adding the substrate, and the OD was proportional to the original concentration of target positive EVs. (B) Detection of nucleolin+ EVs by apta-ELISA with serial concentrations of SUNE2 EVs spiked in PBS from 64-106 particles/µL. (C) apta-ELISA-HCR mechanism. EVs were added to the anti-CD63, anti-CD81 and anti-CD9 MBs, incubated with a biotinylated aptamer, and washed and resuspended in premixture HRP-labeled H1 and H2. The reaction was launched by adding the substrate, and the OD was proportional to the original concentration of target positive EVs. (D) Detection of nucleolin+ EVs by apta-HCR-ELISA with serial concentrations of SUNE2 EVs spiked in PBS from 64-106 particles/µL. (E) apta-HCR-CRISPR mechanism. Based on the apta-ELISA-HCR assay, the HCR products were targeted by Cas12a/crRNA duplex and triggered Cas12a to cleave the ssDNA-FQ reporter substrate, resulting in readable and accumulating FI proportional to the concentration of target positive EVs. (F) Detection of nucleolin+ EVs by apta-HCR- CRISPR with serial concentrations of SUNE2 EVs spiked in PBS from 64-106 particles/µL. (G) Comparison of the LOD of apta-HCR-CRISPR, apta-HCR-ELISA and apta-ELISA in detecting nucleolin+ EV spiked in PBS. (H) The concentration change in nucleolin+ EVs is linearly related to the FI through fitting curves, Y= 7663 lg (EVs) - 12852 (R2 = 0.9848). FI, fluorescence intensity. PBS served as a blank. The P values were calculated using a one-way ANOVA followed by a Sidak multiple-comparison with the former group. *, **, *** and **** represent P < 0.05, P < 0.01, P < 0.001 and P < 0.0001, respectively. Error bars represent the mean ± SD, where n = 3.
Figure 4
Figure 4
Detection of the EVs in spiked EV-depleted FBS using the apta-HCR-CRISPR assay. The FIs were blank subtracted. Statistical analyses were performed using a two-tailed Student's t-test. ns represents P > 0.05. Error bars represent the mean ± SD, where n = 3.
Figure 5
Figure 5
Serum sample detection of nucleolin+ EVs with the apta-HCR-CRISPR assay. (A) Mechanism of serum sample detection with the apta-HCR-CRISPR assay. (B) Non-supervised hierarchical clustering analysis of nucleolin+ EVs in early-stage and advanced-stage NPC patients and controls. Samples 1-10 were early-stage NPC, samples 11-20 were advanced-stage NPC, and samples 21-40 were the controls. (C) Representative immunofluorescence staining image of nucleolin proteins on serum EV membranes. Scale bar represents 100 µm. (D) Scatter plots of the nucleolin+ EV levels in the serum samples from the controls, early-stage NPC patients and advanced-stage NPC patients measured by the apta-HCR-CRISPR. The FIs measured for individual subjects were adjusted by the background and the blank. A statistical comparison of two groups was performed by a two-tailed Student's t-test. (E) ROC curve analysis evaluating the diagnostic power of nucleolin+ EVs to differentiate early-stage NPC (pink line) or early + advanced stage NPC (orange line) from controls.
Figure 6
Figure 6
Serum sample detection of PD-L1+ EVs with the apta-HCR-CRISPR assay. (A) Representative MRI diagram of patients with different therapy responses. Upper panel shows the MRI images of a responder who had been assessed as having stable disease (SD): before treatment (left) and post-treatment (right). Lower panel shows the MRI images of a non-responder who had been assessed as having progressive disease (PD): before treatment (left) and post-treatment (right). Trend graph of PD-L1+ EV levels detected in the responders (B) and non-responders (C) before and after 4-course anti-PD-1 therapy. Statistical analyses were performed using a two-sided paired t-test. (D) Representative immunofluorescence staining image of PD-L1 proteins on serum EV membranes. Scale bar represents 100 µm. (E) Comparison of the changes in the levels of serum EV PD-L1 after 4 courses of anti-PD-1 therapy between responders (n = 6) and non-responders (n = 4). Statistical analyses were performed using a two-tailed Student's t-test. Abbreviations: FI, fluorescence intensity.

References

    1. Colombo M, Raposo G, Thery C. Biogenesis, secretion, and intercellular interactions of exosomes and other extracellular vesicles. Annu Rev Cell Dev Biol. 2014;30:255–89. - PubMed
    1. Thery C, Zitvogel L, Amigorena S. Exosomes: composition, biogenesis and function. Nat Rev Immunol. 2002;2:569–79. - PubMed
    1. Abels ER, Breakefield XO. Introduction to Extracellular Vesicles: Biogenesis, RNA Cargo Selection, Content, Release, and Uptake. Cell Mol Neurobiol. 2016;36:301–12. - PMC - PubMed
    1. Gori A, Romanato A, Greta B, Strada A, Gagni P, Frigerio R. et al. Membrane-binding peptides for extracellular vesicles on-chip analysis. J Extracell Vesicles. 2020;9:1751428. - PMC - PubMed
    1. Mathieu M, Martin-Jaular L, Lavieu G, Thery C. Specificities of secretion and uptake of exosomes and other extracellular vesicles for cell-to-cell communication. Nat Cell Biol. 2019;21:9–17. - PubMed

Publication types

MeSH terms