

Multiplexed non-invasive tumor imaging of glucose metabolism and receptor-ligand engagement using dark quencher FRET acceptor
- PMID: 32929350
- PMCID: PMC7481426
- DOI: 10.7150/thno.45825
Multiplexed non-invasive tumor imaging of glucose metabolism and receptor-ligand engagement using dark quencher FRET acceptor
Abstract
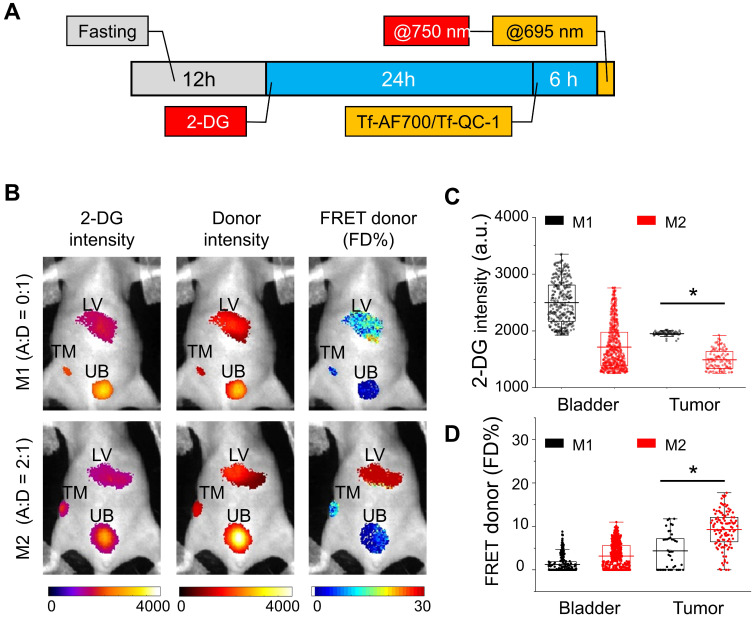
Rationale: Following an ever-increased focus on personalized medicine, there is a continuing need to develop preclinical molecular imaging modalities to guide the development and optimization of targeted therapies. Near-Infrared (NIR) Macroscopic Fluorescence Lifetime Förster Resonance Energy Transfer (MFLI-FRET) imaging offers a unique method to robustly quantify receptor-ligand engagement in live intact animals, which is critical to assess the delivery efficacy of therapeutics. However, to date, non-invasive imaging approaches that can simultaneously measure cellular drug delivery efficacy and metabolic response are lacking. A major challenge for the implementation of concurrent optical and MFLI-FRET in vivo whole-body preclinical imaging is the spectral crowding and cross-contamination between fluorescent probes. Methods: We report on a strategy that relies on a dark quencher enabling simultaneous assessment of receptor-ligand engagement and tumor metabolism in intact live mice. Several optical imaging approaches, such as in vitro NIR FLI microscopy (FLIM) and in vivo wide-field MFLI, were used to validate a novel donor-dark quencher FRET pair. IRDye 800CW 2-deoxyglucose (2-DG) imaging was multiplexed with MFLI-FRET of NIR-labeled transferrin FRET pair (Tf-AF700/Tf-QC-1) to monitor tumor metabolism and probe uptake in breast tumor xenografts in intact live nude mice. Immunohistochemistry was used to validate in vivo imaging results. Results: First, we establish that IRDye QC-1 (QC-1) is an effective NIR dark acceptor for the FRET-induced quenching of donor Alexa Fluor 700 (AF700). Second, we report on simultaneous in vivo imaging of the metabolic probe 2-DG and MFLI-FRET imaging of Tf-AF700/Tf-QC-1 uptake in tumors. Such multiplexed imaging revealed an inverse relationship between 2-DG uptake and Tf intracellular delivery, suggesting that 2-DG signal may predict the efficacy of intracellular targeted delivery. Conclusions: Overall, our methodology enables for the first time simultaneous non-invasive monitoring of intracellular drug delivery and metabolic response in preclinical studies.
Keywords: FRET; breast cancer; lifetime imaging; metabolism; target engagement.
© The author(s).
Conflict of interest statement
Competing Interests: The authors have declared that no competing interest exists.
Figures


 ; mean lifetime) in T47D cells treated with transferrin-Alexa Fluor700 (Tf-AF700) (acceptor: donor, A:D=0:1), Tf-AF700 and Tf-AF750 (A:D=2:1) or Tf-AF700 and Tf-QC-1 (A:D=2:1); pseudo-color range= 300-1,500 ps. Both fluorescence intensity and lifetime distributions show punctate endocytic structures containing transferrin receptor (TfR)-Tf complexes. Scale bar= 50 µm. (D) Representative fitting curves and instrument response function (IRF), the fluorescent lifetime decay in the single and double-labeled cells was determined by comparing the fitting of the decay data using both single- and double-exponential decay models. (E) Comparison of fluorescent lifetime distribution in T47D cells treated with Tf-AF700 (A:D=0:1), Tf-AF700 and Tf-AF750 (A:D=2:1) or Tf-AF700 and Tf-QC1 (A:D=2:1). (F) Comparison of FRET donor fraction (FD%) levels in T47D cells treated with Tf-AF700/Tf-AF750 or Tf-AF700/Tf-QC1 FRET pairs at various A:D ratios. Analysis was performed using 10 distinct pixel coordinates from 5 independent region of interests (ROIs). Error bars represent standard deviation. Statistical analysis of Tf-AF700/Tf-QC1 vs. Tf-AF700/Tf-AF750 FRET pairs at increasing A:D ratios (significant; p < 0.05) using repeated measures Anova is described in Table S4.


Similar articles
-
Fluorescence Lifetime Imaging for Quantification of Targeted Drug Delivery in Varying Tumor Microenvironments.Adv Sci (Weinh). 2025 Jan;12(3):e2403253. doi: 10.1002/advs.202403253. Epub 2024 Nov 27. Adv Sci (Weinh). 2025. PMID: 39600235 Free PMC article.
-
Quantitative imaging of receptor-ligand engagement in intact live animals.J Control Release. 2018 Sep 28;286:451-459. doi: 10.1016/j.jconrel.2018.07.032. Epub 2018 Jul 20. J Control Release. 2018. PMID: 30036545 Free PMC article.
-
Macroscopic Fluorescence Lifetime Imaging for Monitoring of Drug-Target Engagement.Methods Mol Biol. 2022;2394:837-856. doi: 10.1007/978-1-0716-1811-0_44. Methods Mol Biol. 2022. PMID: 35094361 Free PMC article.
-
[Development of Novel Dark Quenchers and Their Application to Imaging Probes].Yakugaku Zasshi. 2019;139(2):277-283. doi: 10.1248/yakushi.18-00174-3. Yakugaku Zasshi. 2019. PMID: 30713240 Review. Japanese.
-
Alexa Fluor 680-labeled transferrin-cationic (NBD-labeled DOPE-DOTAP) liposome-encapsulated gadopentetate dimeglumine complex.2007 Oct 18 [updated 2007 Dec 17]. In: Molecular Imaging and Contrast Agent Database (MICAD) [Internet]. Bethesda (MD): National Center for Biotechnology Information (US); 2004–2013. 2007 Oct 18 [updated 2007 Dec 17]. In: Molecular Imaging and Contrast Agent Database (MICAD) [Internet]. Bethesda (MD): National Center for Biotechnology Information (US); 2004–2013. PMID: 20641669 Free Books & Documents. Review.
Cited by
-
In vivo quantitative FRET small animal imaging: Intensity versus lifetime-based FRET.Biophys Rep (N Y). 2023 May 9;3(2):100110. doi: 10.1016/j.bpr.2023.100110. eCollection 2023 Jun 14. Biophys Rep (N Y). 2023. PMID: 37251213 Free PMC article.
-
Transferrin receptor in primary and metastatic breast cancer: Evaluation of expression and experimental modulation to improve molecular targeting.PLoS One. 2023 Dec 20;18(12):e0293700. doi: 10.1371/journal.pone.0293700. eCollection 2023. PLoS One. 2023. PMID: 38117806 Free PMC article.
-
Deep learning in macroscopic diffuse optical imaging.J Biomed Opt. 2022 Feb;27(2):020901. doi: 10.1117/1.JBO.27.2.020901. J Biomed Opt. 2022. PMID: 35218169 Free PMC article. Review.
-
Luminescence lifetime imaging of three-dimensional biological objects.J Cell Sci. 2021 May 1;134(9):1-17. doi: 10.1242/jcs.254763. Epub 2021 May 7. J Cell Sci. 2021. PMID: 33961054 Free PMC article.
-
Fluorescence Lifetime Imaging for Quantification of Targeted Drug Delivery in Varying Tumor Microenvironments.Adv Sci (Weinh). 2025 Jan;12(3):e2403253. doi: 10.1002/advs.202403253. Epub 2024 Nov 27. Adv Sci (Weinh). 2025. PMID: 39600235 Free PMC article.
References
-
- Waaijer SJH, Kok IC, Eisses B. et al. Molecular Imaging in Cancer Drug Development. J Nucl Med. 2018;59:726–32. - PubMed
Publication types
MeSH terms
Substances
Grants and funding
LinkOut - more resources
Full Text Sources
Miscellaneous
