. 2020 Aug 29;10(23):10729-10742.
doi: 10.7150/thno.46297. eCollection 2020.

The ERα-miR-575-p27 feedback loop regulates tamoxifen sensitivity in ER-positive Breast Cancer

Affiliations

The ERα-miR-575-p27 feedback loop regulates tamoxifen sensitivity in ER-positive Breast Cancer

Shu-Shu Liu et al. Theranostics. .

Abstract

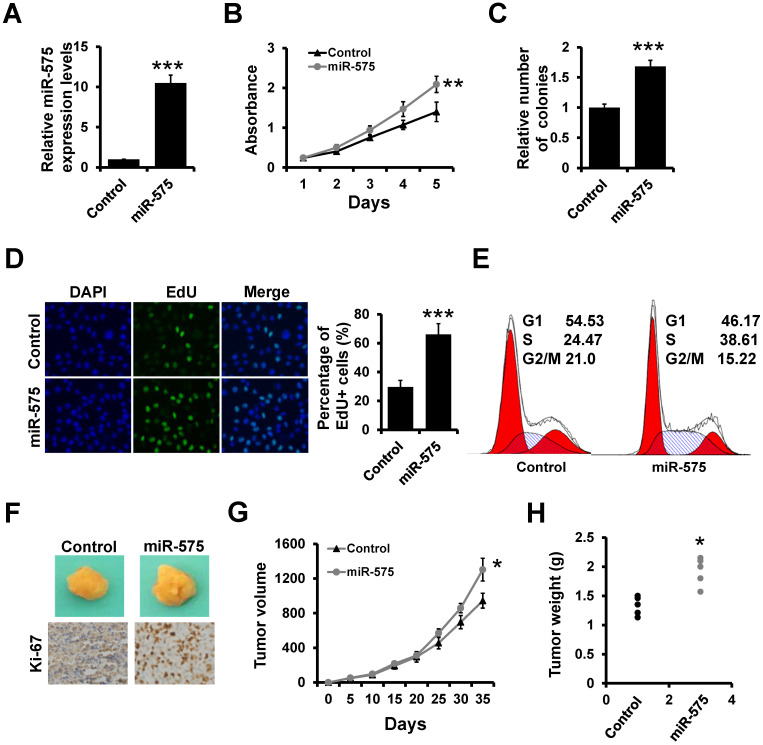
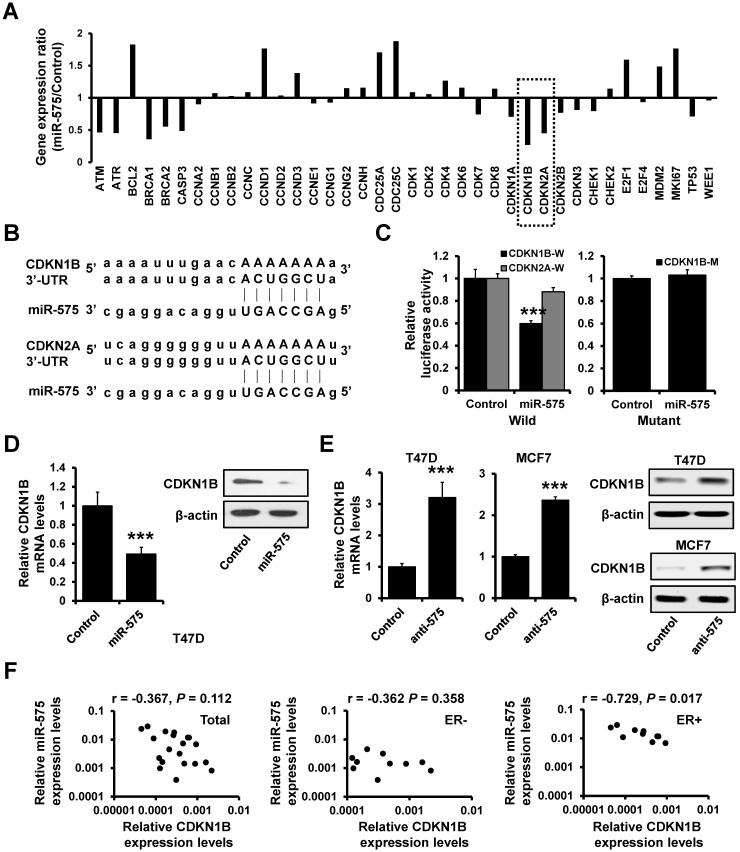
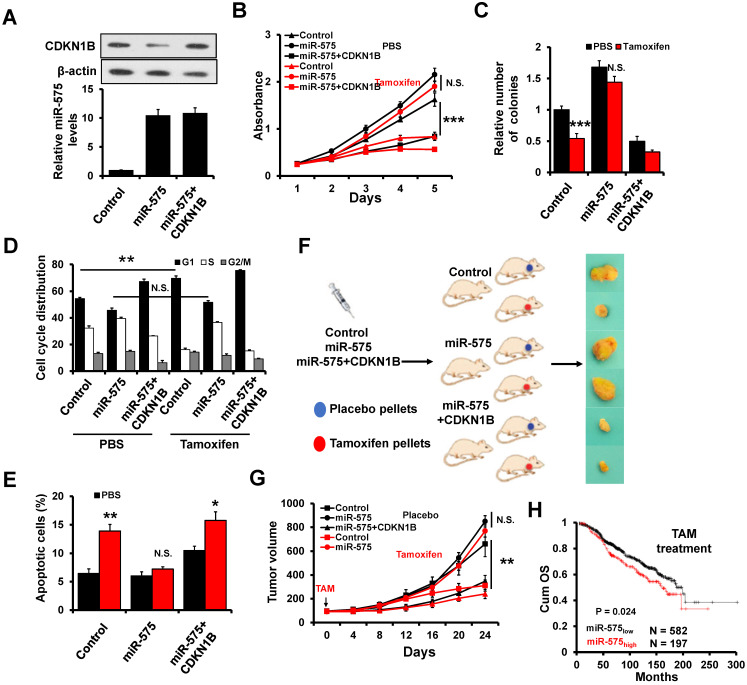
Background: Breast cancer is the most common malignancy, and approximately 70% of breast cancers are estrogen receptor-α (ERα) positive. The anti-estrogen tamoxifen is a highly effective and commonly used treatment for patients with ER+ breast cancer. However, 30% of breast cancer patients fail adjuvant tamoxifen therapy and most of metastatic breast cancer patients develop tamoxifen resistance. Although increasing evidence suggests that microRNA (miRNA) dysregulation influences tamoxifen sensitivity, the mechanism of the cross-talk between miRNA and ERα signaling remains unclear. miR-575 has been reported to be involved in carcinogenesis and progression, however, the role of miR-575 in breast cancer remains limited. The aim of this study was to understand the mechanism of miR-575 in breast cancer tamoxifen resistance. Method: RT-qPCR was employed to assess miR-575 expression in breast cancer tissues and cell lines. The association of miR-575 expression with overall survival in patients with breast cancer was evaluated with KM plotter. Additionally, the effects of miR-575 on breast cancer proliferation and tamoxifen sensitivity were investigated both in vitro and in vivo. Bioinformatic analyses and luciferase reporter assays were performed to validate CDKN1B and BRCA1 as direct targets of miR-31-5p. The ERα binding sites in the miR-575 promoter region was validated with ChIP and luciferase assays. ERα interactions with CDKN1B, cyclin D1 or BRCA1 were determined by IP analysis, and protein expression levels and localization were analyzed by western blotting and immunofluorescence, respectively. Results: miR-575 levels were higher in ER+ breast cancer than in ER- breast cancer and patients with high miR-575 expression had a significantly poorer outcome than those with low miR-575 expression. ERα bound the miR-575 promoter to activate its transcription, and tamoxifen treatment downregulated miR-575 expression in ER+ breast cancer. Overexpression of miR-575 decreased tamoxifen sensitivity by targeting CDKN1B and BRCA1. CDKN1B and BRCA1 were both able to antagonize ERα activity by inhibiting ERα nuclear translocation and interaction with cyclin D1. Furthermore, miR-575 expression was found to be upregulated in ER+ breast cancer cell with acquired tamoxifen resistance, whereas depletion of miR-575 partially re-sensitized these cells to tamoxifen by regulation of CDKN1B. Conclusions: Our data reveal the ERα-miR-575-CDKN1B feedback loop in ER+ breast cancer, suggesting that miR-575 can be used as a prognostic biomarker in patients with ER+ breast cancer, as well as a predictor or a promising target for tamoxifen sensitivity.

Keywords: miR-575 regulates ER+ breast cancer tamoxifen sensitivity.


Conflict of interest statement

Competing Interests: The authors have declared that no competing interest exists.

Figures

Figure 1
Figure 1
miR-575 expression is upregulated in ER+ breast cancer. A-C, Kaplan-Meier analysis of the overall survival of patients with different miR-575 expression levels, as determined using KM-plotter. All patients (A), ER positive (B), ER negative (C). D, RT-qPCR analysis of miR-575 expression in breast cancer specimens. ER-, ER negative; ER+, ≥75% positive nuclear staining. The P value was calculated with Mann-Whitney test. E, Expression of miR-575 or ERα in breast cancer cell lines determined by RT-qPCR or western blotting, respectively. The data shown in E is the mean ± s. d. for three independent replicates.
Figure 2
Figure 2
miR-575 promotes ER+ breast cancer proliferation both in vitro and in vivo. A, Expression of miR-575 in stable miR-575-overexpressed T47D cells, as well as the control cells by RT-qPCR. B-D, MTT (B), colony formation (B) and EdU (D) analyses of the proliferation of cells described in (A). E, Cell cycle analysis of cells described in (A). F, Representative photographs of tumors formed by miR-575-overexpressing T47D or control cells taken at the time of harvest. The expression of Ki-67 was examined by immunohistochemical staining. G, Tumor growth curves for xenograft mice injected with miR-575-overexpressing T47D or control cells at the indicated times. H, Weights of tumors formed by miR-575-overexpressing T47D and control cells at harvest time. The data shown in A-D and G are the mean ± s. d. for three independent replicates. Student's t-test for A-D, G-H. ***P < 0.001, **P < 0.01, *P < 0.05.
Figure 3
Figure 3
ERα transactivates the miR-575 expression. A, Expression levels of miR-575 and TFF1 in T47D cells at the indicated times after hormone deprivation were determined by RT-qPCR. B, T47D cells were cultured in hormone-deprived conditions for 5 days, and the expression levels of miR-575 and TFF1 at the indicated times following treatment with 10 nM E2 were determined by RT-qPCR. C, T47D cells were cultured in hormone-deprived conditions for 5 days and then treated with 10 nM E2 and/or 1 μM tamoxifen/fulvestrant for 48 h. The expression levels of miR-575 and TFF1 were determined by RT-qPCR. D, A schematic representation of the 4 kb upstream region of the miR-575 promoter is shown. The horizontal black lines define the amplicons used in ChIP analysis. E, ChIP analysis of the binding between ERα and the miR-575 promoter in T47D cells was performed after culture in hormone-deprived conditions for 5 days (0 h). The cells were subsequently treated with 10 nM E2 for 12 or 24 h, and cross-linked whole cell extracts were subjected to ChIP; the enrichment of miR-575 promoter DNA in the ERα-immunoprecipitated samples was examined by qPCR. F, Dual-luciferase reporter assays were used to analyze the regulation of miR-575 promoter activity by ERα. Several luciferase reporter plasmids containing different deletions in the miR-575 promoter region were co-transfected with an ERα-expressing plasmid into ER- 293FT cells (left) or with siRNAs targeting ERα into ER+ T47D cells (right). G, Dual-luciferase reporter assays were used to analyze the regulation of ERα-binding site-mutated miR-575 promoter activity by E2. Hormone-deprived 293FT or T47D cells were transfected with luciferase reporter plasmids containing either the wild-type or mutant miR-575 promoter and then treated with 1 or 10 nM E2 for 48 h. Mean ± s. d. for three independent replicates. Repeated-measure ANOVA for A-G.***P < 0.001, **P < 0.01, *P < 0.05.
Figure 4
Figure 4
CDKN1B is a target of miR-575. A, The expression levels of cell cycle-related genes were determined by using the RT2 Profiler PCR array. B, The predicted binding of miR-575 with the CDKN1B or CDKN2A 3'-UTR was determined with TargetScan. C, Dual-luciferase reporter analysis was performed to validate CDKN1B as a miR-575 target. The wild-type (W) 3'-UTR fragment containing the predicted miR-575 target site of CDKN1B or CDKN2A was fused downstream of the Luc gene (left), and a construct with the miR-575 binding site of CDKN1B mutated (M) was also created (right). The constructs were transfected into 293FT cells with or without miR-575 mimics and the luciferase activity was measure after 48 h. D-E, The expression levels of CDKN1B in miR-575-overexpressing T47D (D) or miR-575-depleted T47D and MCF7 cells (anti-575, E), as well as in control cells, were determined by RT-qPCR and western blotting. F, Correlation analysis between miR-575 and CDKN1B mRNA expression in breast cancer specimens examined by RT-qPCR. Mean ± s. d. for three independent replicates. Student's t-test for C-E. ***P < 0.001.
Figure 5
Figure 5
CDKN1B associates with ERα and decreases miR-575 expression. A, Effect of CDKN1B on the nuclear localization of ERα in T47D cells. Hormone-deprived T47D cells were transfected with a CDKN1B-expressing plasmid or vector control and treated with 10 nM E2 for 48 h. B, Effect of CDKN1B on the subcellular distribution of ERα in the cell lines described in (A), as revealed by subcellular fractionation and subsequent western blotting. The levels of cytosolic and nuclear proteins were confirmed by western blotting using an anti-Histone 3 antibody (nuclear fraction marker) or anti-β-actin antibody (cytosolic fraction marker). C, Association of CDKN1B with endogenous ERα in the cell lines described in (A). The cells were subjected to co-immunoprecipitation using a control normal IgG or an anti-CDKN1B antibody. The immunoprecipitants were subjected to western blotting using an anti-ERα antibody. D, Subcellular compartment-specific association of CDKN1B and ERα in the cell lines described in (A). Cytoplasmic and nuclear fractions were subjected to co-immunoprecipitation using a control normal IgG or an anti-CDKN1B antibody, and the immunoprecipitants were subjected to western blotting using an anti-ERα antibody. E, Expression of miR-575 in CDKN1B-transfected T47D (left) and MCF7 (right) cells, as well as in control cells, as determined by RT-qPCR. F, Expression levels of miR-575 in CDKN1B -transfected T47D and control cells determined by RT-qPCR. The cells were cultured in hormone-deprived conditions for 5 days and then treated with 10 nM E2 for 48 h. G, ChIP analysis of binding between ERα and the miR-575 promoter in CDKN1B -transfected T47D and control cells after culture in hormone-deprived conditions for 5 days (0 h). The cells were subsequently treated with 10 nM E2 for 12 or 24 h, and cross-linked whole-cell extracts were subjected to ChIP with a control normal IgG or an anti-ERα antibody; the enrichment of miR-575 promoter DNA in the ERα-immunoprecipitated samples was examined by qPCR. H, Dual-luciferase reporter analysis of the miR-575 promoter activity regulated by E2 in hormone-deprived CDKN1B-transfected T47D and control cells. Cells were transfected with luciferase reporter plasmids containing the wild-type miR-575 promoter and then treated with 1 or 10 nM E2 for 48 h. Mean ± s. d. for three independent replicates. Repeated-measure ANOVA for A, F-H. Student's t-test for E. ***P < 0.001, **P < 0.01, *P < 0.05.
Figure 6
Figure 6
BRCA1 interacts with ERα and is regulated by miR-575. A, The predicted binding of miR-575 with BRCA1 3'UTR was determined by TargetScan. B, Dual-luciferase reporter analysis was performed to validate BRCA1 as a miR-575 target. A 3'-UTR fragment containing the predicted miR-575 target site of BRCA1 was fused downstream of the Luc gene (left), and a construct with the miR-575 binding site of BRCA1 mutated was also created (right). The constructs were transfected into 293FT cells with or without miR-575 mimics and the luciferase activity was measure after 48 h. C-D, The expression levels of BRCA1 in miR-575-overexpressing T47D (C) or miR-575-depleted T47D and MCF7 cells (D), as well as in control cells were determined by RT-qPCR and western blotting. E, The interactions of ERα with BRCA1 or cyclin D1 were assessed in miR-575-overexpressing T47D, miR-575/BRCA1-overexpressing T47D and control cells. The cells were subjected to co-immunoprecipitation using a control normal IgG or an anti-ERα antibody, and the immunoprecipitants were subjected to western blotting using an anti-cyclin D1, anti-BCRA1 or anti-ERα antibody. F, The interactions of ERα with BRCA1 or cyclin D1 were determined in miR-575-depleted T47D and control cells. G, The expression of miR-575 in BRCA1-transfected T47D and control cells was determined by RT-qPCR. H, Dual-luciferase reporter assays were used to analyze the miR-575 promoter activity regulated by E2 in hormone-deprived BRCA1-transfected T47D and control cells. Cells were transfected with luciferase reporter plasmids containing the wild-type miR-575 promoter and then treated with 0, 1 or 10 nM E2 for 48 h. Mean ± s. d. for three independent replicates. Student's t-test for B-D, G. Repeated-measure ANOVA for H. ***P < 0.001, **P < 0.01, *P < 0.05.
Figure 7
Figure 7
miR-575 reduces tamoxifen sensitivity by regulating CDKN1B in ER+ breast cancer cells. A, The expression of miR-575 and CDKN1B in miR-575-overexpressed T47D, miR-575/p27-overexpressing T47D and control cells was determined by RT-qPCR and western blotting. B-C, Cell growth inhibition was determined by MTT (B) and colony formation (C) assays performed with the cell lines described in (A) treated with or without 1 μM tamoxifen. D, The cell cycle distribution of cell lines described in (A) treated with 1 μM tamoxifen was determined by flow cytometry analysis. E, The cell apoptosis of cell lines described in (A) was analyzed by flow cytometry analysis. F, A total of 1 × 10⁶ cells described in (A) were injected into the mammary fat pads of SCID mice. When the tumor volume was ~100 mm3, the mice were divided into two groups and treated with tamoxifen or placebo. Representative photos of the tumors formed by T47D-miR-575, T47D-miR-575/p27 or control cells at harvest time are shown. G, The tumor volumes of xenograft mice injected with T47D-miR-575, T47D-miR-575/CDKN1B or control cells and treated with tamoxifen or placebo at the indicated times. H, Kaplan-Meier analysis of the overall survival of tamoxifen-treated patients with different miR-575 expression levels, as determined using KM-plotter. Mean ± s. d. for three independent replicates. Repeated-measure ANOVA for B-D, E, G. ***P < 0.001, **P < 0.01, *P < 0.05, N.S. not significant.
Figure 8
Figure 8
Depletion of miR-575 reverses tamoxifen resistance in ER+ breast cancer cells. A, The expression of miR-575, CDKN1B and ERα in parental MCF7, miR-575-depleted MCF7/TamR and control cells determined by RT-qPCR and western blotting. B-C, Cell growth inhibition was determined by MTT (B) and colony formation (C) assays performed with cell lines described in (A) treated with 1 µM tamoxifen. D, The cell cycle distribution of cells described in (A) treated with 1 µM tamoxifen, as determined by flow cytometry analysis. E, Apoptosis of cell lines described in (A) treated with 1 µM tamoxifen, as determined by flow cytometry analysis. F, A total of 1 × 10⁶ cells described in (A) were injected into the mammary fat pads of SCID mice. When the tumor volume was ~100 mm3, the mice were treated with tamoxifen. Representative photos of the tumors formed by MCF7 parental, miR-575-depleted MCF7/TamR or control cells at harvest time are shown. G, Tumor growth curves of xenograft mice injected with parental MCF7, miR-575-depleted MCF7/TamR or control cells and treated with tamoxifen. Tumor volume was measured at the indicated times. H, A model of the role of miR-575 in tamoxifen sensitivity in ER+ breast cancer. Mean ± s. d. for three independent replicates. Repeated-measure ANOVA for A-E, G. ***P < 0.001, *P < 0.05.

Similar articles

Cited by

References

    1. Siegel RL, Miller KD, Jemal A. Cancer statistics, 2020. CA Cancer J Clin. 2020;70:7–30. - PubMed
    1. Katzenellenbogen JA, Mayne CG, Katzenellenbogen BS, Greene GL, Chandarlapaty S. Structural underpinnings of oestrogen receptor mutations in endocrine therapy resistance. Nat Rev Cancer. 2018;18:377–88. - PMC - PubMed
    1. Cittelly DM, Das PM, Salvo VA, Fonseca JP, Burow ME, Jones FE. Oncogenic HER2Δ 16 suppresses miR-15a/16 and deregulates BCL-2 to promote endocrine resistance of breast tumors. Carcinogenesis. 2010;31:2049–57. - PMC - PubMed
    1. Chen XS, Wang KS, Guo W, Li LY, Yu P, Sun XY. et al. UCH-L1-mediated Down-regulation of Estrogen Receptor alpha Contributes to Insensitivity to Endocrine Therapy for Breast Cancer. Theranostics. 2020;10:1833–48. - PMC - PubMed
    1. Bartel DP. MicroRNAs: target recognition and regulatory functions. Cell. 2009;136:215–33. - PMC - PubMed

Publication types

MeSH terms