. 2020 Dec 3;136(23):2607-2619.
doi: 10.1182/blood.2020005399.

Bone marrow regeneration requires mitochondrial transfer from donor Cx43-expressing hematopoietic progenitors to stroma

Affiliations

Bone marrow regeneration requires mitochondrial transfer from donor Cx43-expressing hematopoietic progenitors to stroma

Karin Golan et al. Blood. .

Abstract

The fate of hematopoietic stem and progenitor cells (HSPC) is tightly regulated by their bone marrow (BM) microenvironment (ME). BM transplantation (BMT) frequently requires irradiation preconditioning to ablate endogenous hematopoietic cells. Whether the stromal ME is damaged and how it recovers after irradiation is unknown. We report that BM mesenchymal stromal cells (MSC) undergo massive damage to their mitochondrial function after irradiation. Donor healthy HSPC transfer functional mitochondria to the stromal ME, thus improving mitochondria activity in recipient MSC. Mitochondrial transfer to MSC is cell-contact dependent and mediated by HSPC connexin-43 (Cx43). Hematopoietic Cx43-deficient chimeric mice show reduced mitochondria transfer, which was rescued upon re-expression of Cx43 in HSPC or culture with isolated mitochondria from Cx43 deficient HSPCs. Increased intracellular adenosine triphosphate levels activate the purinergic receptor P2RX7 and lead to reduced activity of adenosine 5'-monophosphate-activated protein kinase (AMPK) in HSPC, dramatically increasing mitochondria transfer to BM MSC. Host stromal ME recovery and donor HSPC engraftment were augmented after mitochondria transfer. Deficiency of Cx43 delayed mesenchymal and osteogenic regeneration while in vivo AMPK inhibition increased stromal recovery. As a consequence, the hematopoietic compartment reconstitution was improved because of the recovery of the supportive stromal ME. Our findings demonstrate that healthy donor HSPC not only reconstitute the hematopoietic system after transplantation, but also support and induce the metabolic recovery of their irradiated, damaged ME via mitochondria transfer. Understanding the mechanisms regulating stromal recovery after myeloablative stress are of high clinical interest to optimize BMT procedures and underscore the importance of accessory, non-HSC to accelerate hematopoietic engraftment.


Conflict of interest statement

Conflict-of-interest disclosure: The authors declare no competing financial interests.

Figures

None
Graphical abstract
Figure 1.
Figure 1.
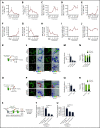
Lethal TBI induces mitochondrial damage in BM stromal precursor cells. (A-J) WT mice were lethally irradiated and Sca-1 (A, C, E, G, I) and Sca-1+ (B, D, F, H, J) BM stromal precursors were analyzed at the indicated time points postirradiation. (A-B) The number of Sca-1 and Sca-1+ BM stromal precursor cells in nonirradiated and irradiated mice. Mitochondrial mass (Mitotracker green staining) (C-D), mitochondrial ROS (MitoSox red staining) levels (E-F), mitochondrial transmembrane potential (TMRE staining) (G-H), and glucose uptake levels (I-J) in BM Sca-1 and Sca-1+ BM stromal precursors before and after irradiation. Data are presented as average of 3 to 7 mice per group. (K) Schematic illustration of in vivo irradiation experiment for stromal mitochondria imaging. (L) Representative confocal microscopy images showing mitochondrial (green) network in MSC cultured for 24 hours and 48 hours after in vivo lethal irradiation. The boxed area (a) and the respective high-magnification images show long, tubular mitochondria network in nonirradiated BM MSC. The boxed areas (b-c) and the respective high-magnification images demonstrate global mitochondrial fragmentation with loss of the long, tubular mitochondrial structures and presence of many small rounded mitochondria at 24 hours and 48 hours (red arrows), respectively. (M) Quantification of mean mitochondrial volume per surface in MSC after in vivo irradiation and culture. (N) Frequency of mitochondrial events with size higher or lower than 0.5 μm3 in volume. (O) Schematic illustration of in vitro irradiation experiment for stromal mitochondria imaging. (P) Representative confocal microscopy images showing mitochondrial (green) network in MSC cultured for 96 hours after in vitro irradiation. The boxed area (i) and the respective high-magnification images show long, tubular mitochondria network in nonirradiated BM MSC (similar to nonirradiated L). The boxed areas (ii) and the respective high-magnification images demonstrate again global mitochondrial fragmentation with loss of the long, tubular mitochondrial structures and presence of many small rounded mitochondria at 96 hours after in vitro irradiation of BM MSC (red arrows). (Q) Quantification of mean mitochondrial volume per surface in MSC after in vitro irradiation. (R) Frequency of mitochondrial events with size higher or lower than 0.5 μm3 in volume. Both in vivo and in vitro experiments were performed as 2 independent experiments. Mitochondrial network and volume were analyzed using Imaris surface building algorithm, and the statistical color coding of mitochondrial volume are shown. Scale bar, 2, 3, 5, and 10 µm. (S-U) Schematic illustration of lethally irradiated Dendra2-mito WT mice transplanted with WT BM cells and analyzed at 2 weeks and 1 month posttransplantation (S). Normalized mean fluorescence intensity level of Dendra2 mitochondria in Sca-1 (T) and Sca-1+ (U) BM stromal precursor cells were analyzed before irradiation, and 2 weeks and 1 month posttransplantation. Data are the average of 3 to 6 mice per group. All data are represented as mean ± SEM. Statistical significance was assessed using 1-way ANOVA except in panels Q and R where the 2-tailed Student t test was used. *P < .05, **P < .01, ***P < .001.
Figure 2.
Figure 2.
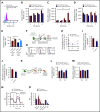
Donor hematopoietic cells transfer functional mitochondria to the irradiated host BM MSC following total body irradiation. (A-C) Schematic illustration of transplantation protocol. Lethally irradiated congenic WT mice transplanted with CD45+ BM cells obtained from Dendra2-mito WT mice and analyzed 2 weeks and 1 month posttransplantation (A). Representative histograms after 1 month posttransplantation (B) and quantified analyses (C) show the levels of Dendra2+ mitochondria transfer from donor HSPC to host BM-MSC (CD45/PDGFRα+/Sca-1). Data are the average of 3 to 5 mice per group. (D-F) Lethally irradiated WT Dendra2-mito mice transplanted with CD45+ BM cells obtained from congenic WT mice and analyzed 2 weeks and 1 month posttransplantation (D). Representative histograms after 1 month posttransplantation (E) and quantified summary (F) show the levels of Dendra2+ mitochondria transfer from host Dendra2-mito stromal cells to WT donor HSC (CD34/Lin/Sca-1+/c-Kit+). Data are the average of 3 to 6 mice per group. (G-I) BM MSC were cocultured with CD45+ cells isolated from Dendra2-mito WT mice for 16 hours, and the transfer of mitochondria from Dendra2-mito CD45+ cells to MSC was analyzed. Histograms (G) and bar diagram (H) representing the percentage of MSC containing donor-derived Dendra2+ mitochondria. (I) Relative quantification of mitochondrial content in stromal cells cocultured with or without Dendra2-mito CD45+ cells was analyzed by real-time polymerase chain reaction using ND1 gene belonging to mitochondrial DNA (mND1) and nuclear hexokinase 2 (nHK2) gene. n = 4-6 independent experiments. (J) Representative example of mitochondrial transfer kinetics followed for up to 225 min. Confocal spinning disk microscopy of hematopoietic Dendra2-mito cells cocultured with WT stromal precursors. Heat map shows the Dendra2 signal intensity. Images taken at indicated time points show the transfer of mitochondria from 1 hematopoietic cell (H) toward a neighboring stromal cell (S) after a long, thin hematopoietic cell extension. White arrows depict mitochondria moving away from H to S and red arrows depict mitochondria already transferred to S. (K) TEM images of mitochondria transfer in an in vivo setting. WT Dendra2-mito CD45+ cells were transplanted in lethally irradiated WT congenic mice and the transfer of Dendra2+ mitochondria from HSPC to MSC was analyzed 4 months posttransplantation. (a) Representative TEM images showing donor (D) and recipient (R) cells, and mitochondrial cristae. (b) Overlay of TEM image with identical fluorescent micrograph (correlative light electron microscopy, CLEM). (c) Fluorescent microscopy image showing donor CD45+ hematopoietic cells (red) and Dendra2+ mitochondria (green). Nuclei were counterstained with 4′,6-diamidino-2-phenylindole (DAPI) . The short white arrows in panels a-c show Dendra2+ mitochondria in donor CD45+ cells. The short red arrows in panel a-c represent donor Dendra2+ mitochondria in recipient stromal cells. The boxed areas (d, e, and f) in panel a are magnified in TEM image panels d, e and f, respectively. TEM magnification of mitochondria indicated by a long magenta arrow in panel d is presented in TEM micrograph (g). TEM magnification of mitochondria indicated by a long yellow arrow and a green arrow in panel e are presented in TEM micrographs panels h and i, respectively. TEM magnification of mitochondria indicated by a long red arrow in panel f is presented in TEM micrograph (j). All these mitochondrial images represent donor-derived Dendra2+ mitochondria which either persist in the hematopoietic (CD45+, red fluorescent) donor cell (d, g) or have been transferred to a recipient BM stromal cell (CD45, with no red fluorescence; in e, f, h, i, and j). TEM micrographs in panels g, h, i, and j provide morphological detail on mitochondrial cristae and membranes. Scale bar, 2 µm, 500 nm, and 200 nm. (L-M) Mitochondrial ROS levels (L) and (M) membrane potential in host MSC containing (Dendra2-mito+) or not (Dendra2-mito) donor-derived Dendra2+ mitochondria assessed at 1 month posttransplantation (n = 5 mice per group). All data are presented as mean ± SEM. Statistical significance was assessed using 2-tailed Student t test except in panels C and F, where one-way ANOVA was used. **P < .01, ***P < .001.
Figure 3.
Figure 3.
Mitochondrial transfer from Connexin 43 deficient donor HSPC to BM MSC is decreased. (A) Level of Dendra2-mito transfer from HSPC to BM stromal cells in coculture without contact in trans-wells of 0.3µm. (B-D) WT or H-Cx43Δ/Δ Dendra2-mito Lin-negative cells were cocultured on WT MSC and the transfer of Dendra2+ mitochondria in MSC was analyzed. Mean fluorescence intensity of Dendra2 in PDGFRα+ MSC after 2, 4, 8, and 16 hours of coculture (B). Mitochondrial ROS levels (C) and ΔΨm (D) in PDGFRα+ MSC containing donor-derived Dendra2+ mitochondria at different times of coculture. Data are the average of 3 to 6 independent experiments. (E) Lin-negative cells from WT or Vav1-cre Cx43fl/fl Dendra2-mito mice were transduced with empty or Cx43-full length (R-Cx43-FL) retrovirus vector, followed by coculture over WT stroma for 16 hours. Overexpression of R-Cx43-FL in Cx43Δ/Δ Dendra2+ HSPC rescue mitochondrial transfer in PDGFRα+ MSC. The frequency of mitochondria transfer in PDGFRα+ MSC was also increased in R-Cx43-FL transduced WT HSPC. Data are the average of 3 independent experiments. (F-J) Schematic illustration of lethally irradiated congenic WT CD45.1+ mice transplanted with WT or Cx43Δ/Δ Dendra2-mito Lin/CD51 cells and analyzed at days 10, 17, and 28 posttransplantation (F). Representative histograms (G) and bar diagram (H) show the frequency of BM Lin/CD45/PDGFRα+/Sca-1 MSC containing Dendra2+ mitochondria from donor hematopoiesis at the indicated days posttransplantation. Mitochondrial ROS levels (I), and ΔΨm (J) in WT and H-Cx43Δ/Δ chimeric mice BM Lin/CD45/PDGFRα+/Sca-1 MSC containing donor-derived Dendra2+ mitochondria after 28 days posttransplantation are shown. (n = 4-9 mice per group, 2 independent experiments). (K-M) Incorporation of isolated mitochondria from HSPC is independent of the expression of Cx43 in source HSPC. Dendra2+ mitochondria were isolated from WT and Cx43Δ/Δ Dendra2-mito Lin-negative cells and coculture over-irradiated (7.5 Gy) WT primary stroma for 24 and 48 hours (K). Bar graphs show the frequencies of PDGFRα+ MSC containing extracellular Dendra2+ mitochondria at indicated time points (L), and mitochondrial ROS production in PDGFRα+ MSC containing extracellular Dendra2+ mitochondria (M). Data are the average of 3 to 5 independent experiments. Dendra2+ mitochondria isolated from WT HSPC (WT mito). Dendra2+ mitochondria isolated from Cx43Δ/Δ HSPC (Cx43Δ/Δ mito). (N-O) BM Lin/CD45 cells containing donor-derived Dendra2+ mitochondrial were sorted from WT and H-CX43Δ/Δ chimeric mice (1 month posttransplantation) and mitochondrial OCR was measured by Seahorse XFe96-Analyzer using sequential injections of oligomycin, FCCP, and Rotenone (N). Quantification summary of mitochondrial OCR in WT and H-CX43Δ/Δ chimeric mice Lin/CD45 cells containing donor-derived mitochondria (data are the average of 3 independent experiments with 2 to 4 technical replicates) (O). All data represented as mean ± SEM. Statistical significance was assessed using 1-way ANOVA except in panels H, I, J, and O where 2-tailed Student t tests were used. *P < .05, **P < .01, ***P < .001. BHI, bioenergetic health index; FCCP, carbonyl cyanide 4-(trifluoromethoxy) phenylhydrazone; SRC, spare respiratory capacity.
Figure 4.
Figure 4.
AMPK inhibition in HSPC controls mitochondria transfer to BM MSC. (A) Primary BM MSC were irradiated (9.5 Gy or 20 Gy), and 48 hours postirradiation, were cocultured with CD45+ cells isolated from Dendra2-mito WT mice for 16 h at 37°C, and the transfer of mitochondria in MSC was analyzed. (B) Primary BM MSC or CD45+ cells isolated from Dendra2-mito WT mice were pretreated with Rejuvesol for 4 hours and washed with intact media. Rejuvesol-pretreated stromal or CD45+ cells were cocultured with CD45+ cells isolated from Dendra2-mito WT mice or WT primary MSC, respectively, for 16 hours, and the transfer of mitochondria in MSC was analyzed. (C) Primary BM MSC were cocultured with CD45+ cells isolated from Dendra2-mito WT mice with/without Rejuvesol and P2RX7 receptor inhibitor for 16 hours and the transfer of mitochondria in MSC was analyzed. (D-E) Primary BM MSC were cocultured with CD45+ cells isolated from Dendra2-mito WT mice with/without AMPK inhibitor (BML-275) or AMPK activator (AICAR) for 16 hours, and the transfer of mitochondria in MSC was analyzed. Representative plots (D) and quantification summary (E) shows the effect of AMPK inhibitor and activator on mitochondria transfer from HSPC to BM MSC. (F) Primary BM MSC or CD45+ cells isolated from Dendra2-mito WT mice were pretreated with AMPK inhibitor for 4 hours and washed with intact media. AMPK inhibitor–pretreated stromal and CD45+ cells were cocultured with CD45+ cells isolated from Dendra2-mito WT mice or WT stromal cells, respectively, for 16 hours and the transfer of mitochondria in MSC was analyzed. (G) Primary BM MSC were cocultured with CD45+ cells isolated from Dendra2-mito WT mice with/without AMPK inhibitor, P2RX7 receptor inhibitor and Rejuvesol for 16 hours, and the transfer of mitochondria in MSC was analyzed. (H-I) Schematic illustration of lethally irradiated congenic WT CD45.1+ mice transplanted with WT or Cx43Δ/Δ Dendra2-mito HSPC and treated with vehicle control or AMPK inhibitor (BML-275, 10 mg/kg, interperitoneally) on days 5, 6, and 7 posttransplantation, and analyzed 2.5 hours after the last dose (H). Transfer of Dendra2+ mitochondria from donor HSPC to BM Lin/CD45/PDGFRα+/Sca-1 cells in WT and H-Cx43Δ/Δ chimeric mice treated with vehicle control or AMPK inhibitor (I). n = 8 mice per group, 2 independent experiments. All in vitro data are the average of 4 to 6 independent experiments. Data represented as mean ± SEM and statistical significance was assessed using 1-way ANOVA. *P < .05, **P < .01 and ***P < .001.
Figure 5.
Figure 5.
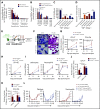
Mitochondria transfer from healthy hematopoietic progenitors boosts stromal cell proliferation and hematopoietic recovery following irradiation and transplantation. (A) Proliferation rates in WT and H-Cx43Δ/Δ chimeric mice that were injected with BrdU for 1 hour before analysis. Proliferation of BM Lin/CD45/PDGFRα+/Sca-1 MSC receiving (positive) or not (negative) Dendra2+ mitochondria from donor hematopoiesis was measured at 10, 17, and 28 days posttransplantation. Data are the average of 4 mice per group. (B) Dendra2+ mitochondria isolated from WT and Cx43Δ/Δ Dendra2-mito Lin-negative cells were cocultured over irradiated (7.5 Gy) WT stroma for 24 and 48 hours. Brdu uptake by MSC containing or not containing Dendra2+ mitochondria were analyzed at indicated times of coculture. Data are the average of 3 to 6 independent experiments. Dendra2+ mitochondria isolated from WT HSPC (WT mito), Dendra2+ mitochondria isolated from Cx43Δ/Δ HSPC (Cx43Δ/Δ mito). (C-D) Dendra2+ mitochondria isolated from WT and Cx43Δ/Δ Lin-negative cells were cocultured over irradiated (7.5 Gy) WT stroma. After 24 hours, MSC containing (Dendra2-mito+) or not (Dendra2-mito) extracellular Dendra2 mitochondria were FACS sorted and grown for 3 days. CFU-F (C), and apoptosis as measured by Annexin V staining (D) in Dendra2-mito+ and Dendra2-mito MSC are shown. Data are the average ± SEM of 3 independent experiments. (E-I) Schematic illustration of lethally irradiated congenic WT CD45.1+ mice that were transplanted with WT or Cx43Δ/Δ Dendra2-mito Lin/CD51 cells and analyzed at days 10, 17, and 28 posttransplantation (E). Representative example (F) and the frequency of BM CFU-F and CFU-Ob in donor, WT, and H-Cx43Δ/Δ chimeric mice at indicated time posttransplantation (G). BM ST-HSC (Lin/c-Kit+/Sca-1+/CD48/CD150) content in WT and H-Cx43Δ/Δ chimeric mice at days 10, 17, and 28 posttransplantation (H). Peripheral blood counts for leukocytes, neutrophils, and platelets in WT and H-Cx43Δ/Δ chimeric mice at indicated times posttransplantation (I). Data are presented as average ± standard deviation from 2 independent experiments using 4 to 8 mice per group. (J-L) Lethally irradiated WT mice transplanted with WT or Cx43Δ/Δ Dendra2-mito HSPC were treated with vehicle control or AMPK inhibitor (BML-275, 10 mg/kg, intraperitoneally) on days 5, 6, and 7 posttransplantation and analyzed. CFU-F (J) and CFU-Ob (K) in vehicle or AMPK inhibitor–pretreated WT and H-Cx43Δ/Δ chimeric mice on day 7 posttransplantation. Peripheral blood platelet and neutrophil counts in WT and H-Cx43Δ/Δ chimeric mice treated with vehicle control (DMSO) or AMPK inhibitor (BML-275) at indicated time points posttransplantation (L). Data are the average of 4 to 6 mice per group, 2 independent experiment. All data represented as mean ± SEM. Statistical significance was assessed using 2-tailed Student t test except in panels A, C-D where 1-way ANOVA was used. *P < .05, **P < .01, ***P < .001. Scale bar, 10 µm.

Comment in

References

    1. Wei Q, Frenette PS. Niches for hematopoietic stem cells and their progeny. Immunity. 2018;48(4):632-648. - PMC - PubMed
    1. Kfoury Y, Scadden DT. Mesenchymal cell contributions to the stem cell niche. Cell Stem Cell. 2015;16(3):239-253. - PubMed
    1. Morrison SJ, Scadden DT. The bone marrow niche for haematopoietic stem cells. Nature. 2014;505(7483):327-334. - PMC - PubMed
    1. Abbuehl JP, Tatarova Z, Held W, Huelsken J. Long-term engraftment of primary bone marrow stromal cells repairs niche damage and improves hematopoietic stem cell transplantation. Cell Stem Cell. 2017;21(2):241-255. - PubMed
    1. Zhao M, Tao F, Venkatraman A, et al. . N-cadherin-expressing bone and marrow stromal progenitor cells maintain reserve hematopoietic stem cells. Cell Rep. 2019;26(3):652-669. - PMC - PubMed

Publication types