Electrostatic interactions in the SH1-SH2 helix of human cardiac myosin modulate the time of strong actomyosin binding
- PMID: 32929610
- PMCID: PMC7956043
- DOI: 10.1007/s10974-020-09588-1
Electrostatic interactions in the SH1-SH2 helix of human cardiac myosin modulate the time of strong actomyosin binding
Abstract
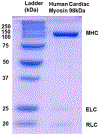
Two single mutations, R694N and E45Q, were introduced in the beta isoform of human cardiac myosin to remove permanent salt bridges E45:R694 and E98:R694 in the SH1-SH2 helix of the myosin head. Beta isoform-specific bridges E45:R694 and E98:R694 were discovered in the molecular dynamics simulations of the alpha and beta myosin isoforms. Alpha and beta isoforms exhibit different kinetics, ADP dissociates slower from actomyosin containing beta myosin isoform, therefore, beta myosin stays strongly bound to actin longer. We hypothesize that the electrostatic interactions in the SH1-SH2 helix modulate the affinity of ADP to actomyosin, and therefore, the time of the strong actomyosin binding. Wild type and the mutants of the myosin head construct (1-843 amino acid residues) were expressed in differentiated C2C12 cells, and the duration of the strongly bound state of actomyosin was characterized using transient kinetics spectrophotometry. All myosin constructs exhibited a fast rate of ATP binding to actomyosin and a slow rate of ADP dissociation, showing that ADP release limits the time of the strongly bound state of actomyosin. The mutant R694N showed a faster rate of ADP release from actomyosin, compared to the wild type and the E45Q mutant, thus indicating that electrostatic interactions within the SH1-SH2 helix region of human cardiac myosin modulate ADP release and thus, the duration of the strongly bound state of actomyosin.
Keywords: ADP; ATP; Actin; Electrostatics; Myosin; Salt bridge; Transient kinetics.
© 2020. Springer Nature Switzerland AG.
Conflict of interest statement
Conflict of interest
The authors declare that they have no conflicts of interest with the contents of this article.
Figures


Similar articles
-
Electrostatic interaction of loop 1 and backbone of human cardiac myosin regulates the rate of ATP induced actomyosin dissociation.J Muscle Res Cell Motil. 2022 Mar;43(1):1-8. doi: 10.1007/s10974-021-09611-z. Epub 2021 Nov 26. J Muscle Res Cell Motil. 2022. PMID: 34825297 Free PMC article.
-
The Local Environment of Loop Switch 1 Modulates the Rate of ATP-Induced Dissociation of Human Cardiac Actomyosin.Int J Mol Sci. 2022 Jan 22;23(3):1220. doi: 10.3390/ijms23031220. Int J Mol Sci. 2022. PMID: 35163146 Free PMC article.
-
Electrostatic interactions in the force-generating region of the human cardiac myosin modulate ADP dissociation from actomyosin.Biochem Biophys Res Commun. 2019 Feb 19;509(4):978-982. doi: 10.1016/j.bbrc.2019.01.045. Epub 2019 Jan 14. Biochem Biophys Res Commun. 2019. PMID: 30654937 Free PMC article.
-
Nucleotide-induced and actin-induced structural changes in SH1-SH2-modified myosin subfragment 1.J Muscle Res Cell Motil. 2007;28(1):67-78. doi: 10.1007/s10974-007-9108-7. Epub 2007 May 31. J Muscle Res Cell Motil. 2007. PMID: 17541712
-
Kinetics of the interaction between actin, ADP, and cardiac myosin-S1.J Biol Chem. 1984 Apr 25;259(8):5045-53. J Biol Chem. 1984. PMID: 6715335
Cited by
-
A novel kinetic model to demonstrate the independent effects of ATP and ADP/Pi concentrations on sarcomere function.PLoS Comput Biol. 2024 Aug 5;20(8):e1012321. doi: 10.1371/journal.pcbi.1012321. eCollection 2024 Aug. PLoS Comput Biol. 2024. PMID: 39102392 Free PMC article.
-
Virus-free transfection, transient expression, and purification of human cardiac myosin in mammalian muscle cells for biochemical and biophysical assays.Sci Rep. 2023 Mar 12;13(1):4101. doi: 10.1038/s41598-023-30576-1. Sci Rep. 2023. PMID: 36907906 Free PMC article.
-
Electrostatic interaction of loop 1 and backbone of human cardiac myosin regulates the rate of ATP induced actomyosin dissociation.J Muscle Res Cell Motil. 2022 Mar;43(1):1-8. doi: 10.1007/s10974-021-09611-z. Epub 2021 Nov 26. J Muscle Res Cell Motil. 2022. PMID: 34825297 Free PMC article.
-
Cost-Efficient Expression of Human Cardiac Myosin Heavy Chain in C2C12 Cells with a Non-Viral Transfection Reagent.Int J Mol Sci. 2024 Jun 19;25(12):6747. doi: 10.3390/ijms25126747. Int J Mol Sci. 2024. PMID: 38928453 Free PMC article.
-
The Local Environment of Loop Switch 1 Modulates the Rate of ATP-Induced Dissociation of Human Cardiac Actomyosin.Int J Mol Sci. 2022 Jan 22;23(3):1220. doi: 10.3390/ijms23031220. Int J Mol Sci. 2022. PMID: 35163146 Free PMC article.
References
-
- Harris DE and Warshaw DM, Smooth and Skeletal-Muscle Myosin Both Exhibit Low Duty Cycles at Zero Load in-Vitro. Journal of Biological Chemistry, 1993. 268(20): p. 14764–14768. - PubMed
-
- Houdusse A and Sweeney HL, Myosin motors: missing structures and hidden springs. Current Opinion in Structural Biology, 2001. 11(2): p. 182–194. - PubMed
-
- Sasaki N, Ohkura R, and Sutoh K, Dictyostelium myosin II mutations that uncouple the converter swing and ATP hydrolysis cycle. Biochemistry, 2003. 42(1): p. 90–5. - PubMed
-
- Batra R, Geeves MA, and Manstein DJ, Kinetic analysis of Dictyostelium discoideum myosin motor domains with glycine-to-alanine mutations in the reactive thiol region. Biochemistry, 1999. 38(19): p. 6126–34. - PubMed
-
- Koppole S, Smith JC, and Fischer S, The structural coupling between ATPase activation and recovery stroke in the myosin II motor. Structure, 2007. 15(7): p. 825–837. - PubMed
Publication types
MeSH terms
Substances
Grants and funding
LinkOut - more resources
Full Text Sources

