

A Review of Imputation Strategies for Isobaric Labeling-Based Shotgun Proteomics
- PMID: 32929967
- PMCID: PMC8996546
- DOI: 10.1021/acs.jproteome.0c00123
A Review of Imputation Strategies for Isobaric Labeling-Based Shotgun Proteomics
Abstract
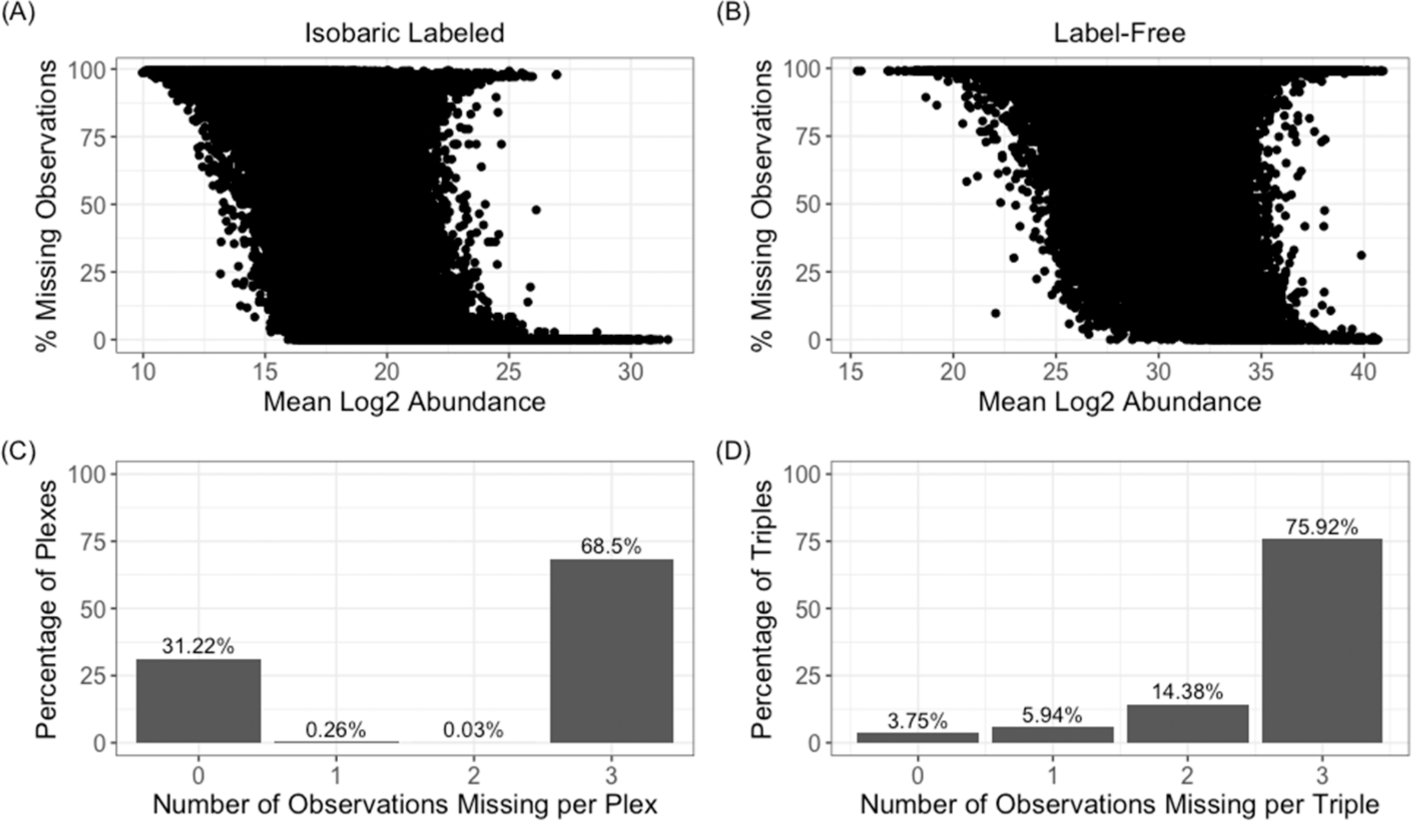
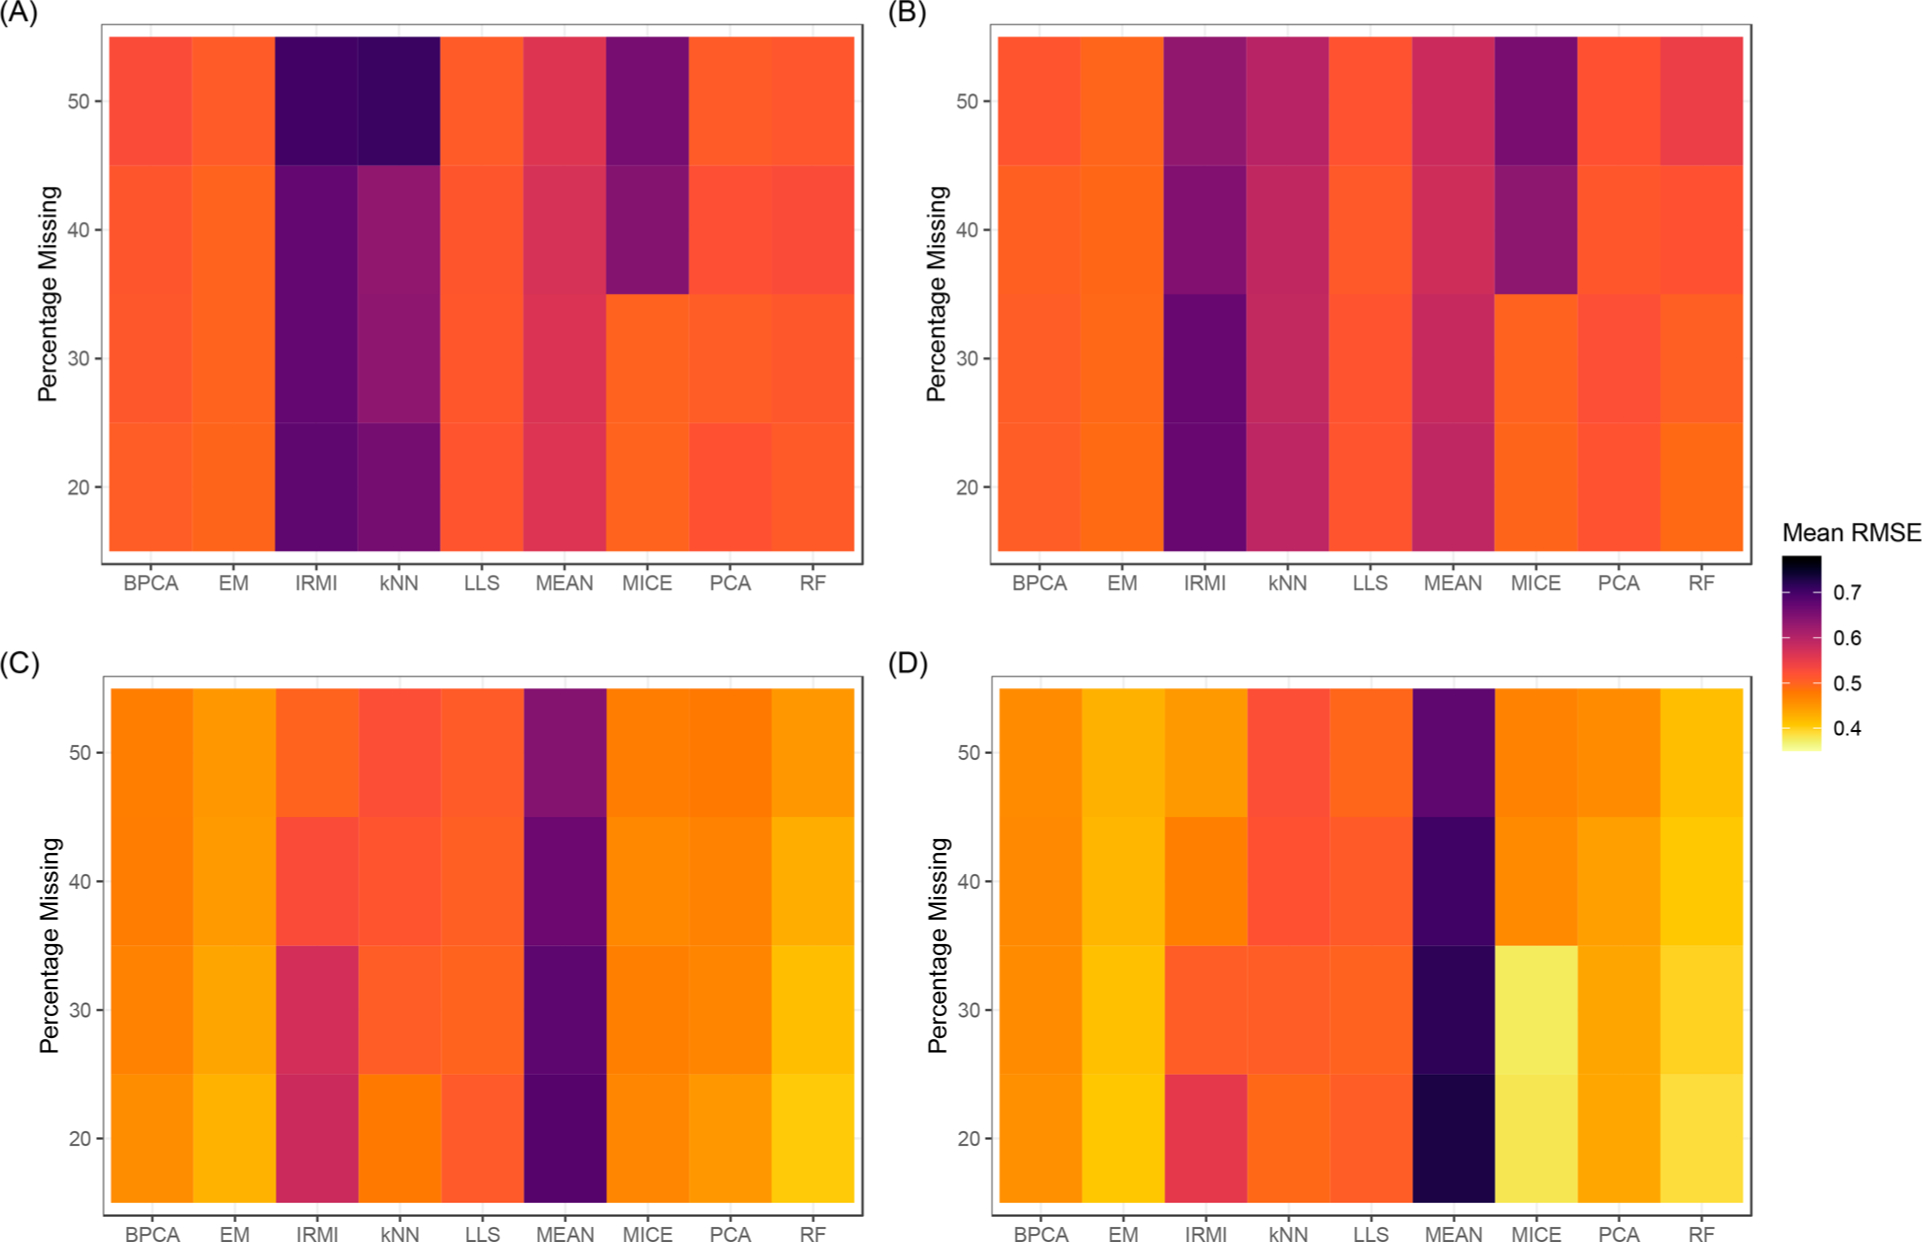
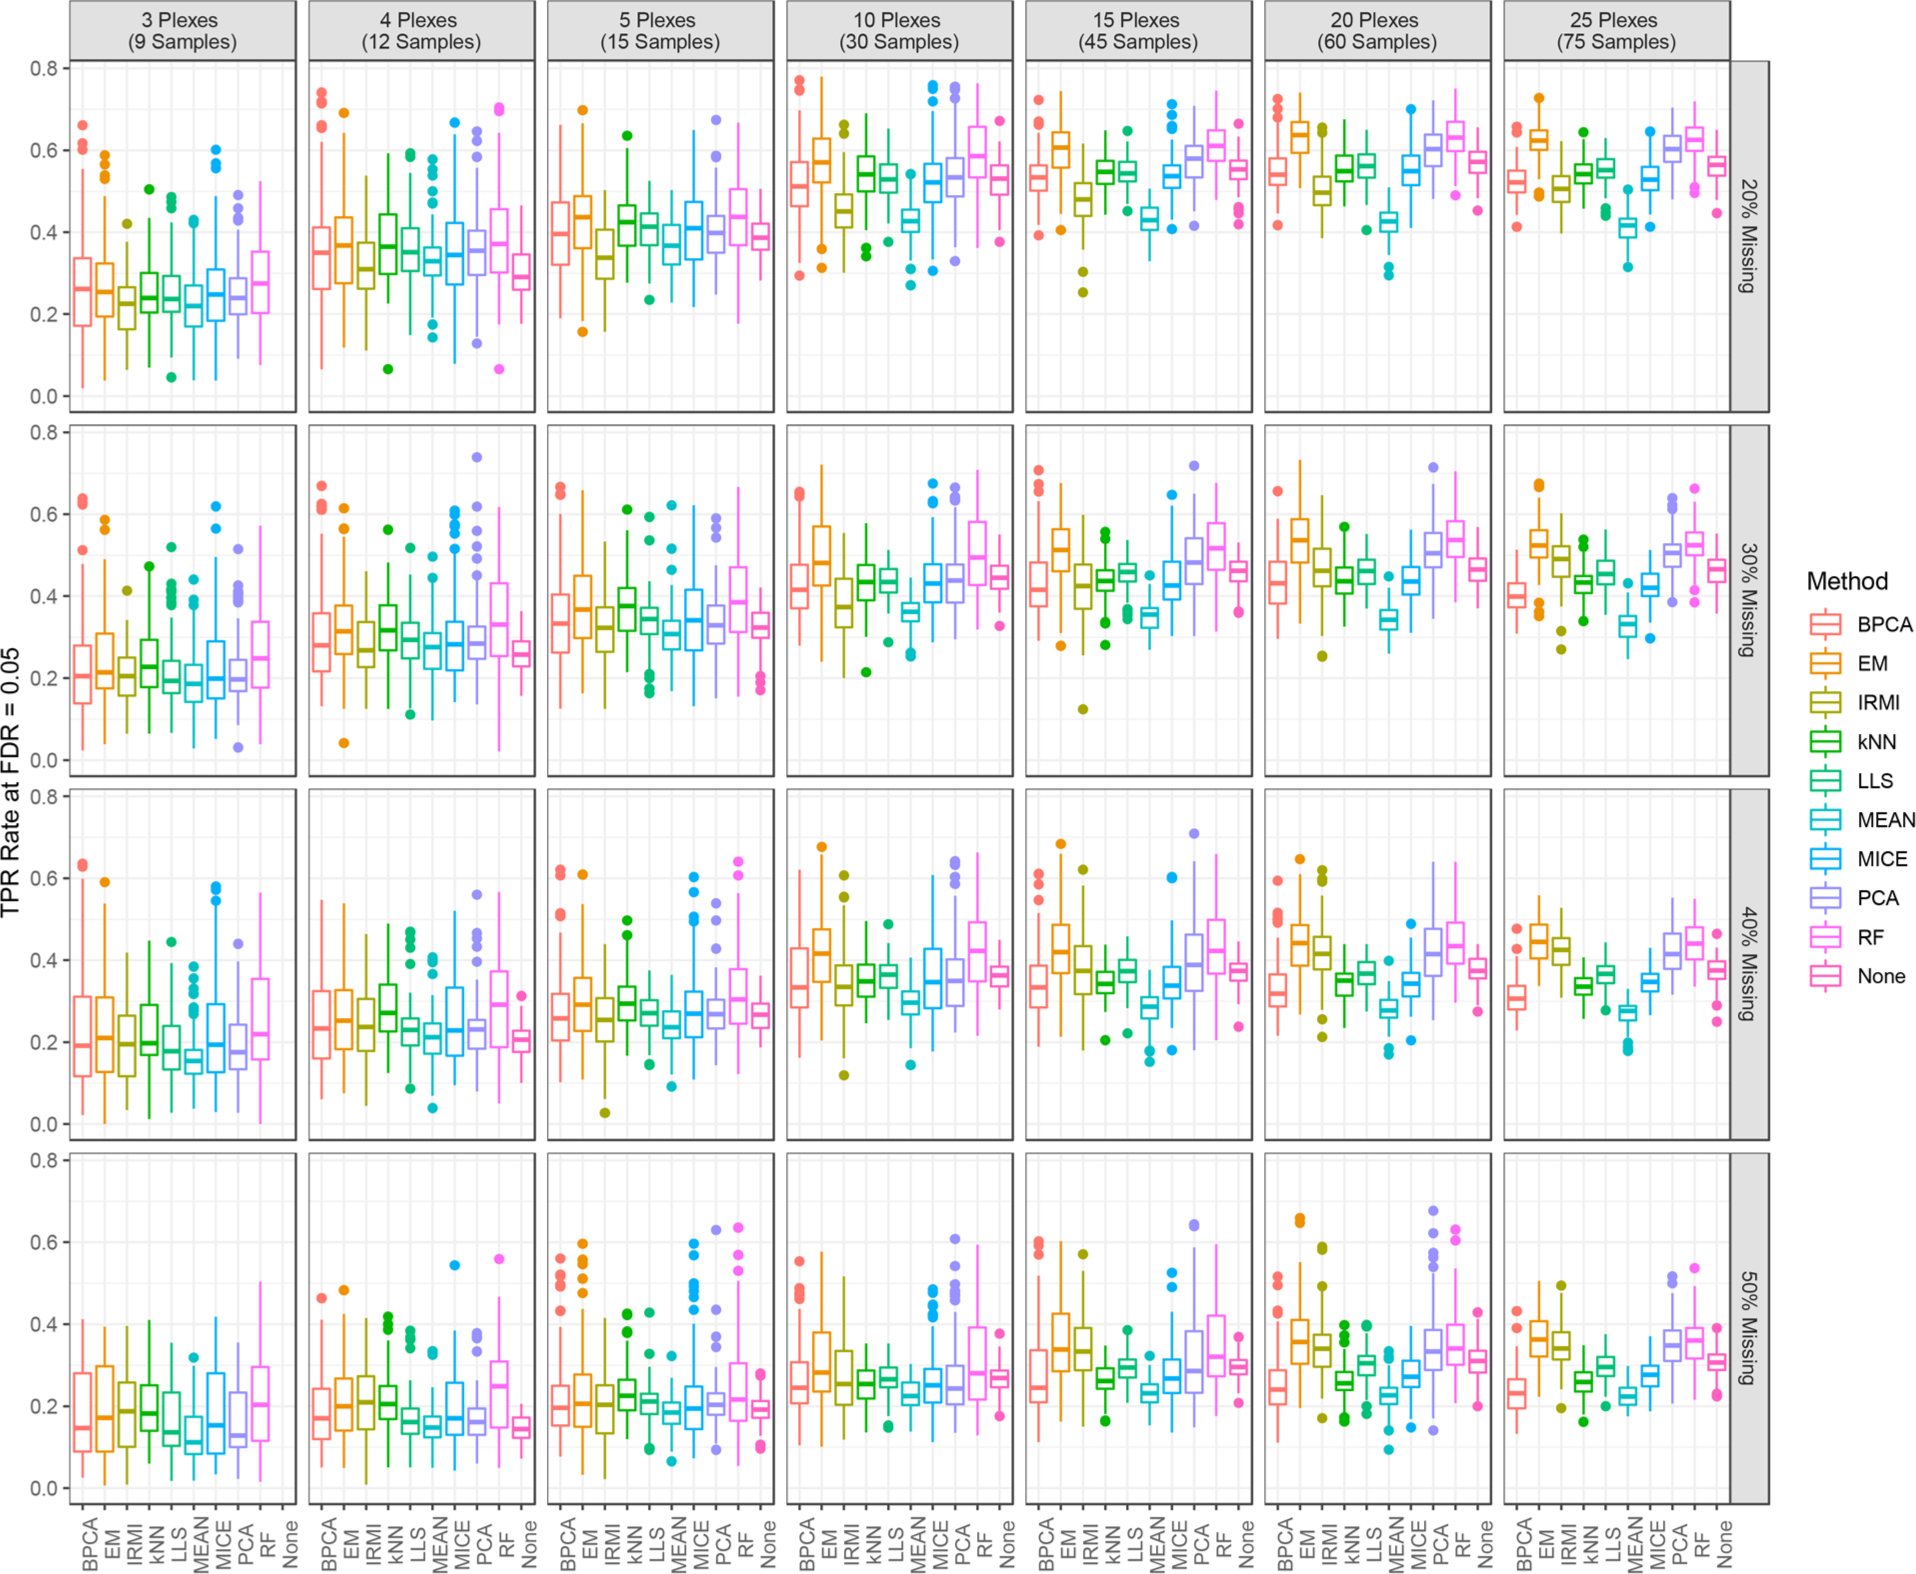
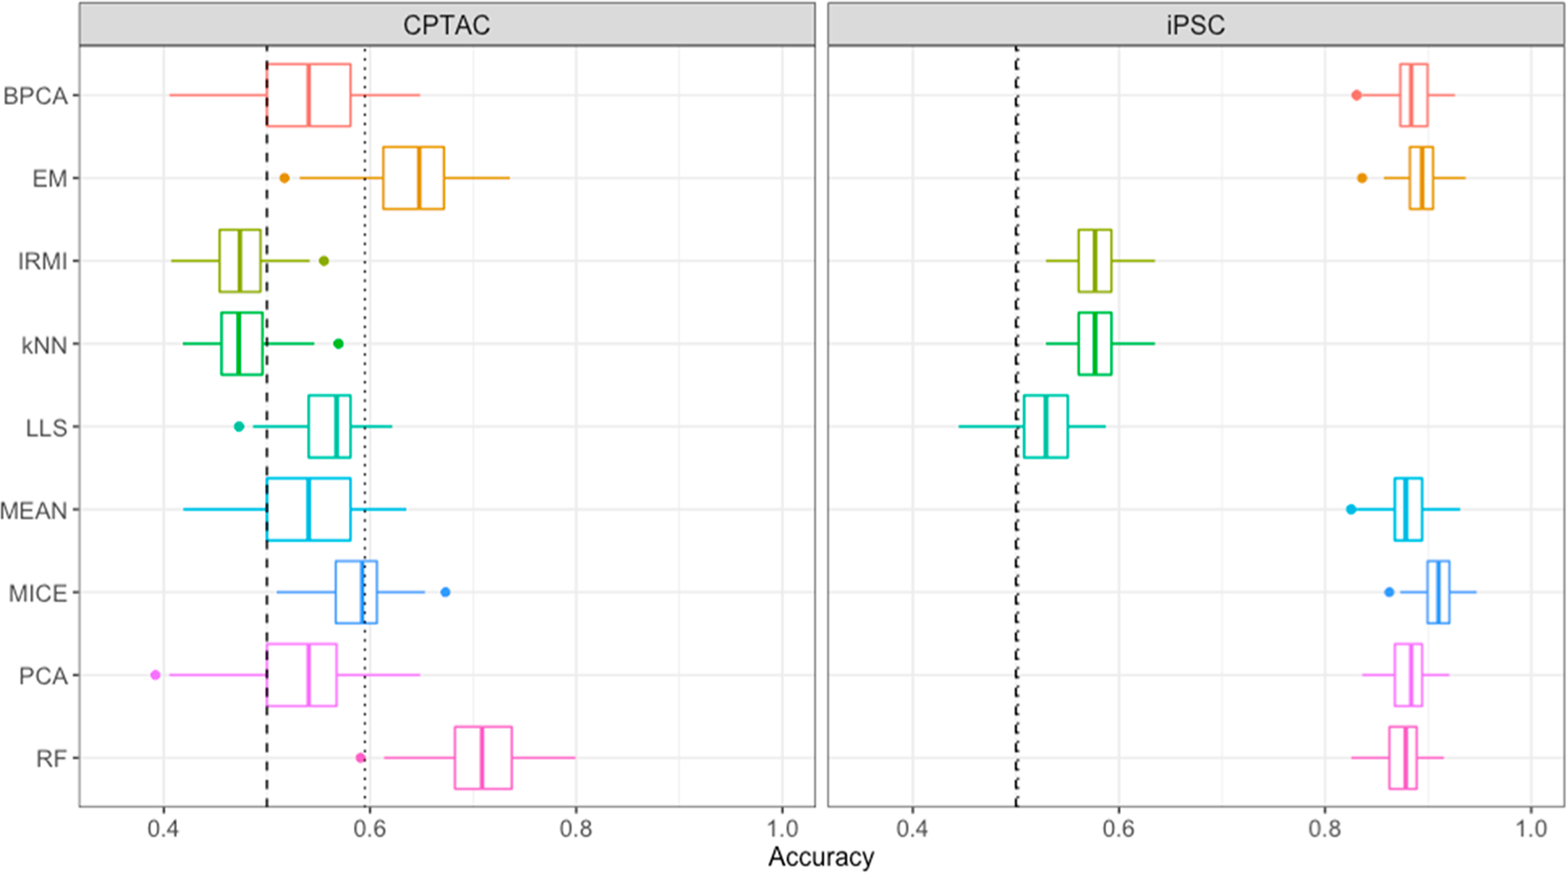
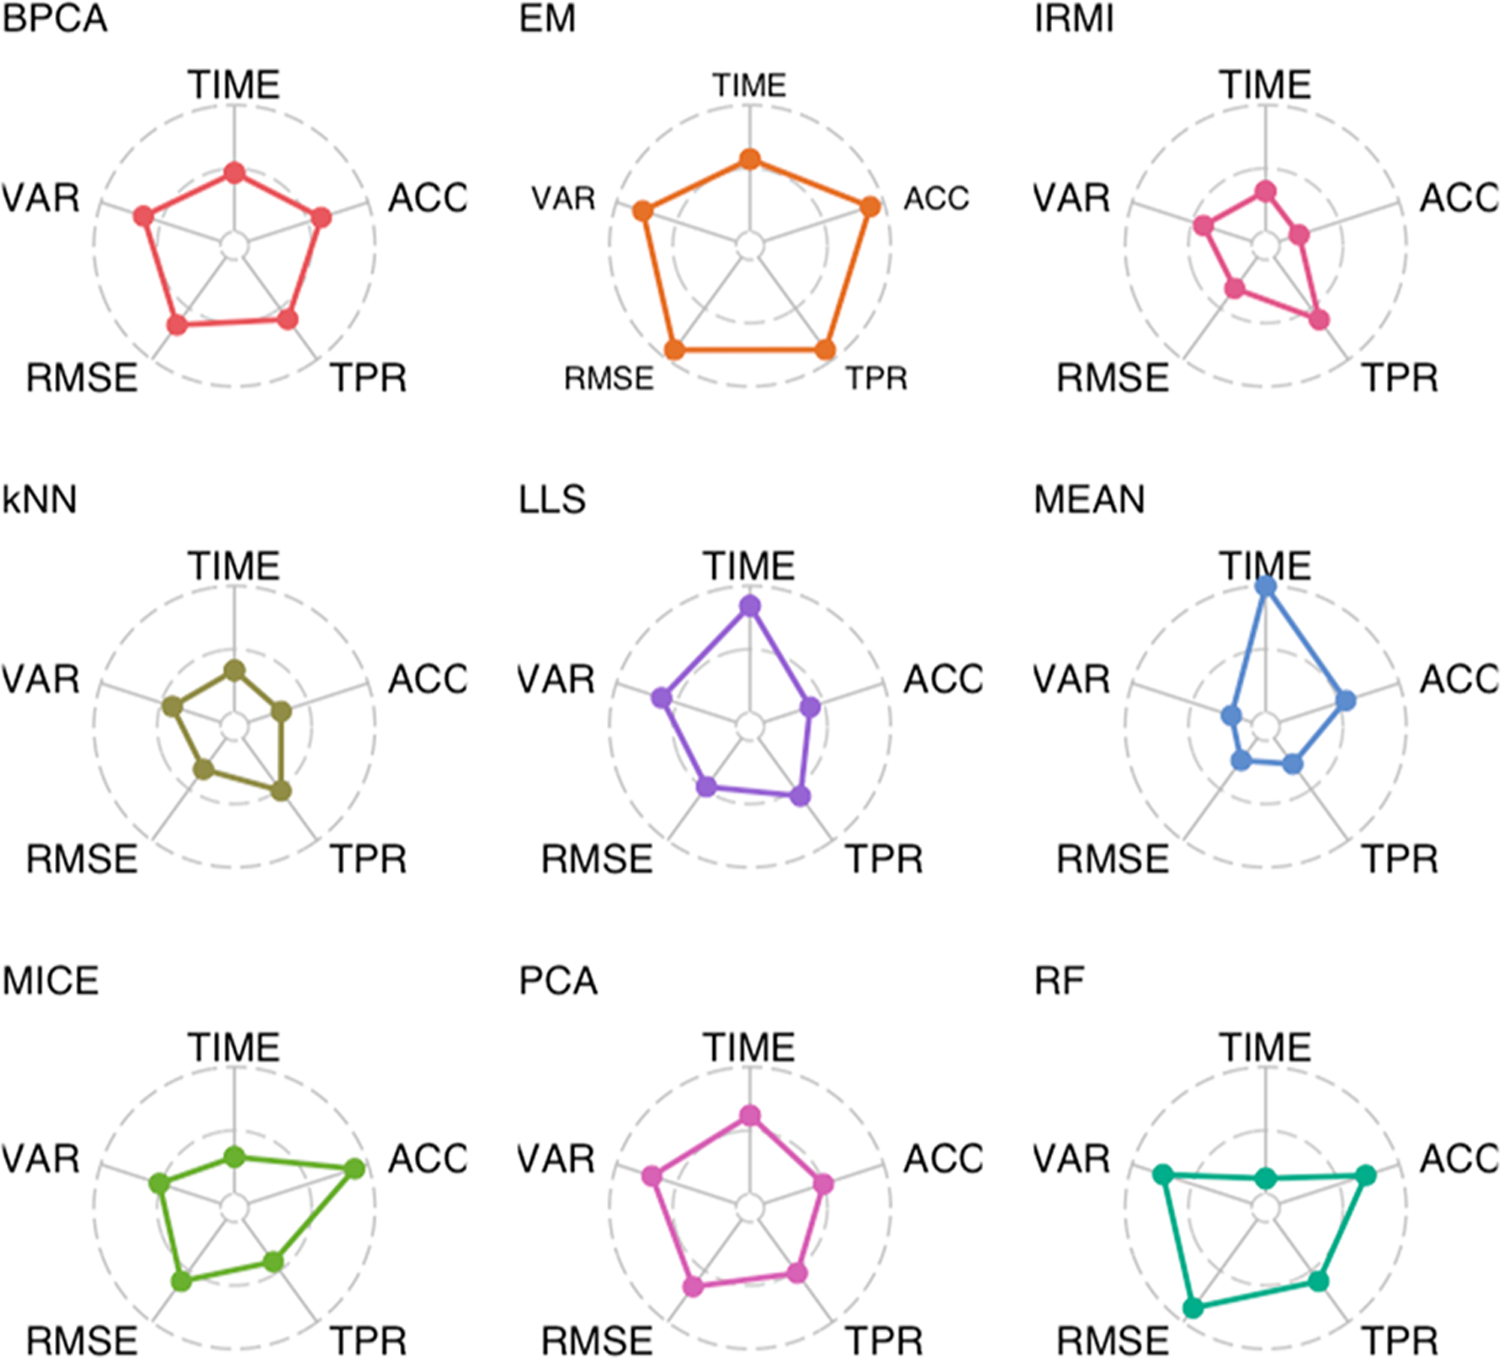
The throughput efficiency and increased depth of coverage provided by isobaric-labeled proteomics measurements have led to increased usage of these techniques. However, the structure of missing data is different than unlabeled studies, which prompts the need for this review to compare the efficacy of nine imputation methods on large isobaric-labeled proteomics data sets to guide researchers on the appropriateness of various imputation methods. Imputation methods were evaluated by accuracy, statistical hypothesis test inference, and run time. In general, expectation maximization and random forest imputation methods yielded the best performance, and constant-based methods consistently performed poorly across all data set sizes and percentages of missing values. For data sets with small sample sizes and higher percentages of missing data, results indicate that statistical inference with no imputation may be preferable. On the basis of the findings in this review, there are core imputation methods that perform better for isobaric-labeled proteomics data, but great care and consideration as to whether imputation is the optimal strategy should be given for data sets comprised of a small number of samples.
Keywords: accuracy; hypothesis testing; imputation; isobaric-labeled proteomics; missing data.
Conflict of interest statement
The authors declare no competing financial interest.
Figures
References
-
- Bantscheff M; Lemeer S; Savitski MM; Kuster B Quantitative mass spectrometry in proteomics: critical review update from 2007 to the present. Anal. Bioanal. Chem. 2012, 404 (4), 939–65. - PubMed
-
- Zhang AH; Sun H; Yan GL; Han Y; Wang XJ Serum Proteomics in Biomedical Research: A Systematic Review. Appl. Biochem. Biotechnol. 2013, 170 (4), 774–786. - PubMed
-
- Thompson A; Schaefer J; Kuhn K; Kienle S; Schwarz J; Schmidt G; Neumann T; Johnstone RAW; Mohammed AKA; Hamon C Tandem mass tags: A novel quantification strategy for comparative analysis of complex protein mixtures by MS/MS (vol 75, pg 1895, 2003). Anal. Chem. 2006, 78 (12), 4235–4235. - PubMed
-
- Ross PL; Huang YLN; Marchese JN; Williamson B; Parker K; Hattan S; Khainovski N; Pillai S; Dey S; Daniels S; Purkayastha S; Juhasz P; Martin S; Bartlet-Jones M; He F; Jacobson A; Pappin DJ Multiplexed protein quantitation in Saccharomyces cerevisiae using amine-reactive isobaric tagging reagents. Mol. Cell. Proteomics 2004, 3 (12), 1154–1169. - PubMed
Publication types
MeSH terms
Grants and funding
LinkOut - more resources
Full Text Sources
