. 2020 Nov 17;142(20):1937-1955.
doi: 10.1161/CIRCULATIONAHA.120.046450. Epub 2020 Sep 15.

Complex Arrhythmia Syndrome in a Knock-In Mouse Model Carrier of the N98S Calm1 Mutation

Affiliations

Complex Arrhythmia Syndrome in a Knock-In Mouse Model Carrier of the N98S Calm1 Mutation

Wen-Chin Tsai et al. Circulation. .

Abstract

Background: Calmodulin mutations are associated with arrhythmia syndromes in humans. Exome sequencing previously identified a de novo mutation in CALM1 resulting in a p.N98S substitution in a patient with sinus bradycardia and stress-induced bidirectional ventricular ectopy. The objectives of the present study were to determine if mice carrying the N98S mutation knocked into Calm1 replicate the human arrhythmia phenotype and to examine arrhythmia mechanisms.

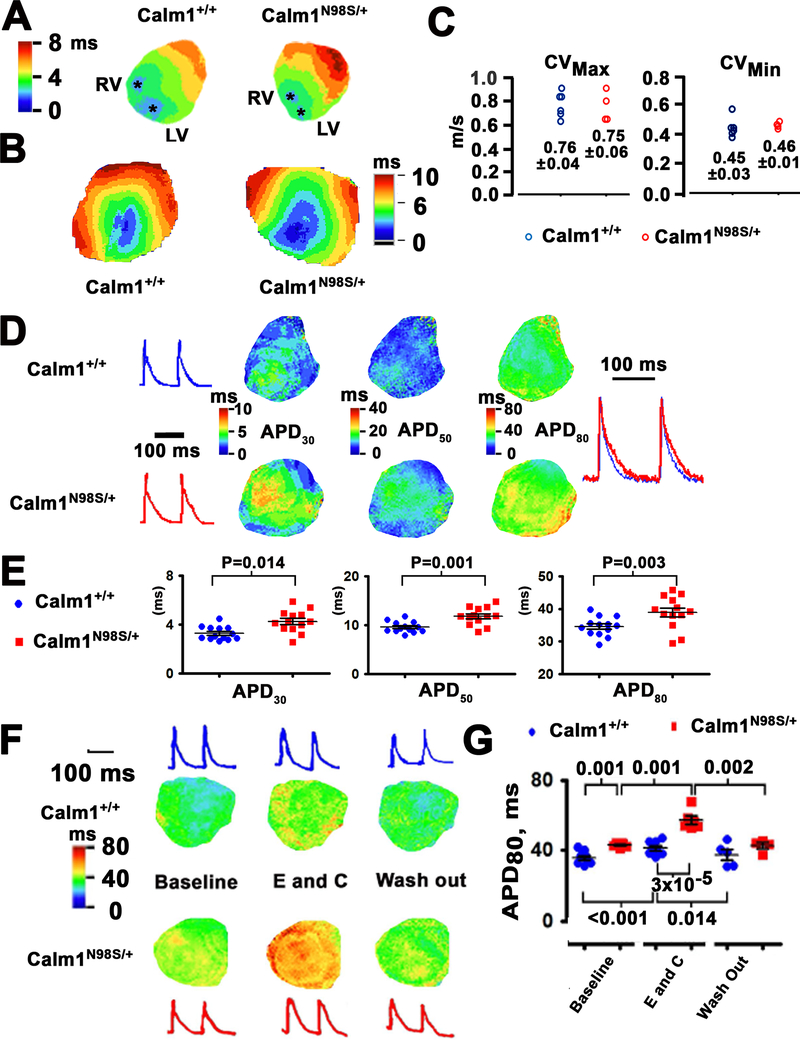
Methods: Mouse lines heterozygous for the Calm1N98S allele (Calm1N98S/+) were generated using CRISPR/Cas9 technology. Adult mutant mice and their wildtype littermates (Calm1+/+) underwent electrocardiographic monitoring. Ventricular de- and repolarization was assessed in isolated hearts using optical voltage mapping. Action potentials and whole-cell currents and [Ca2+]i, as well, were measured in single ventricular myocytes using the patch-clamp technique and fluorescence microscopy, respectively. The microelectrode technique was used for in situ membrane voltage monitoring of ventricular conduction fibers.

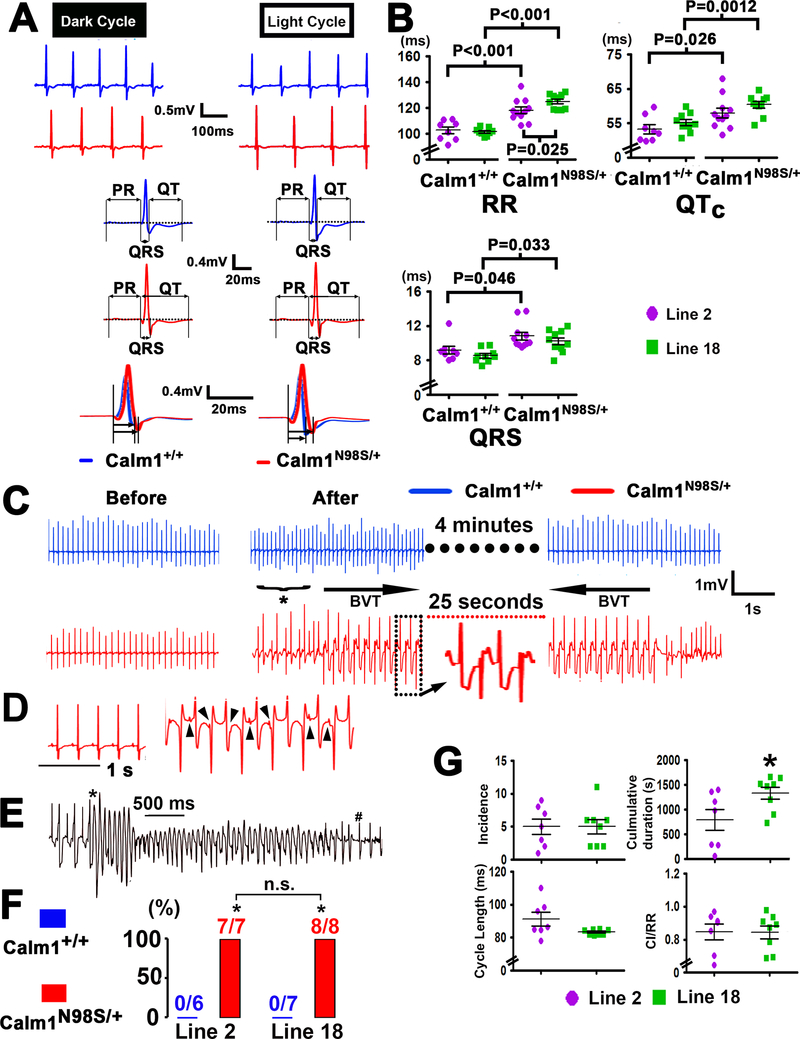
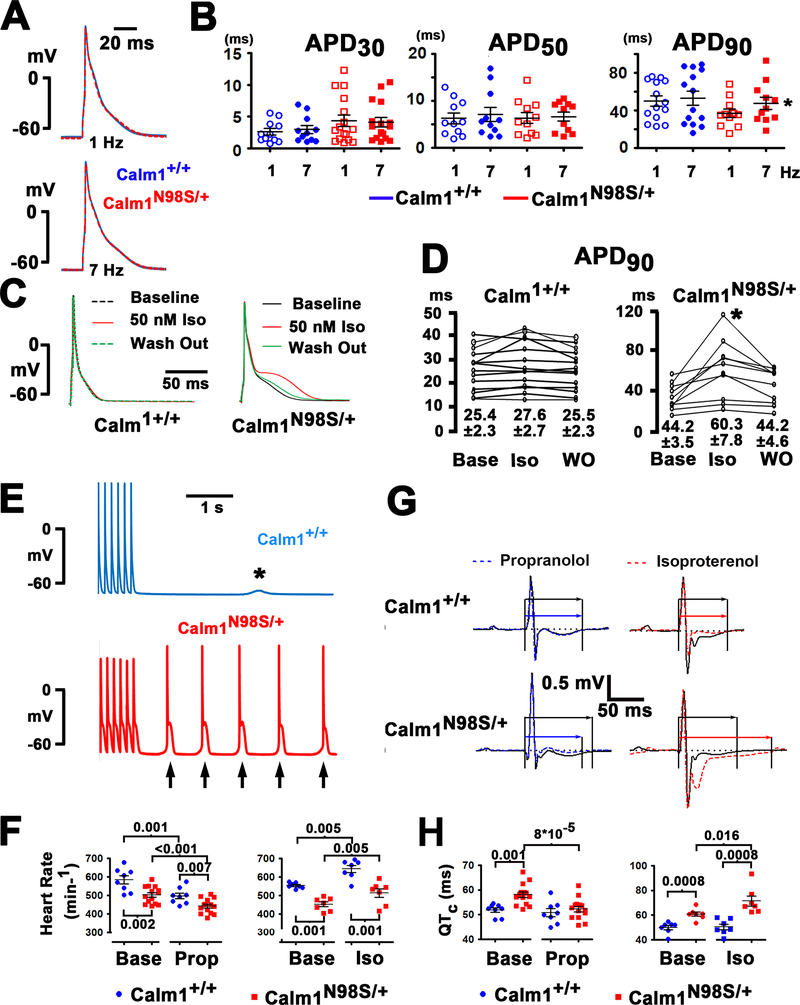
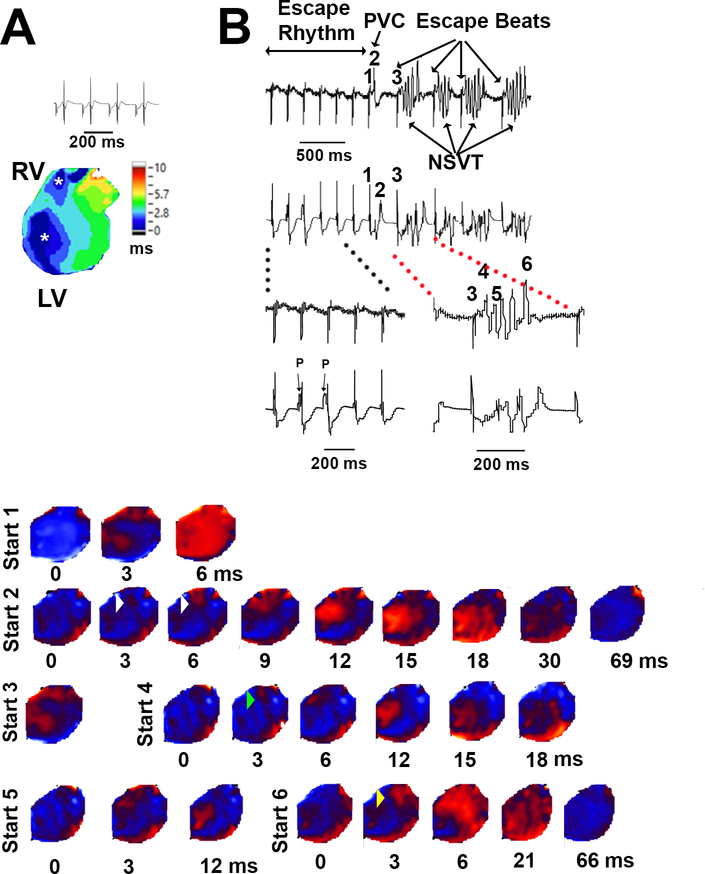
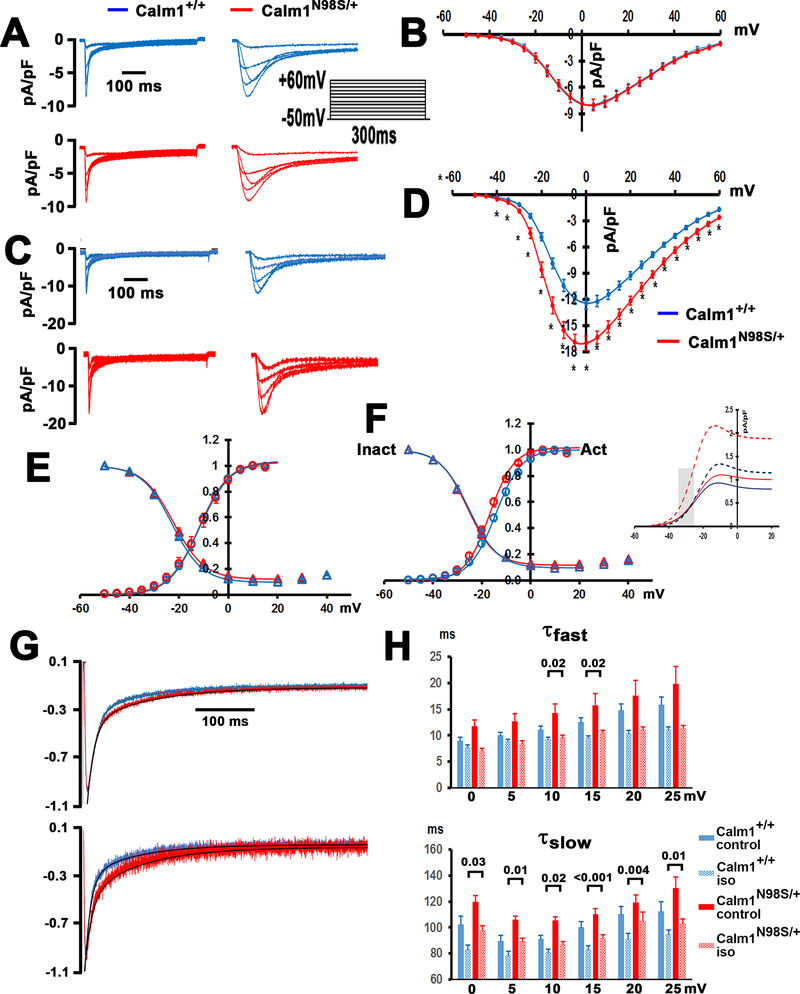
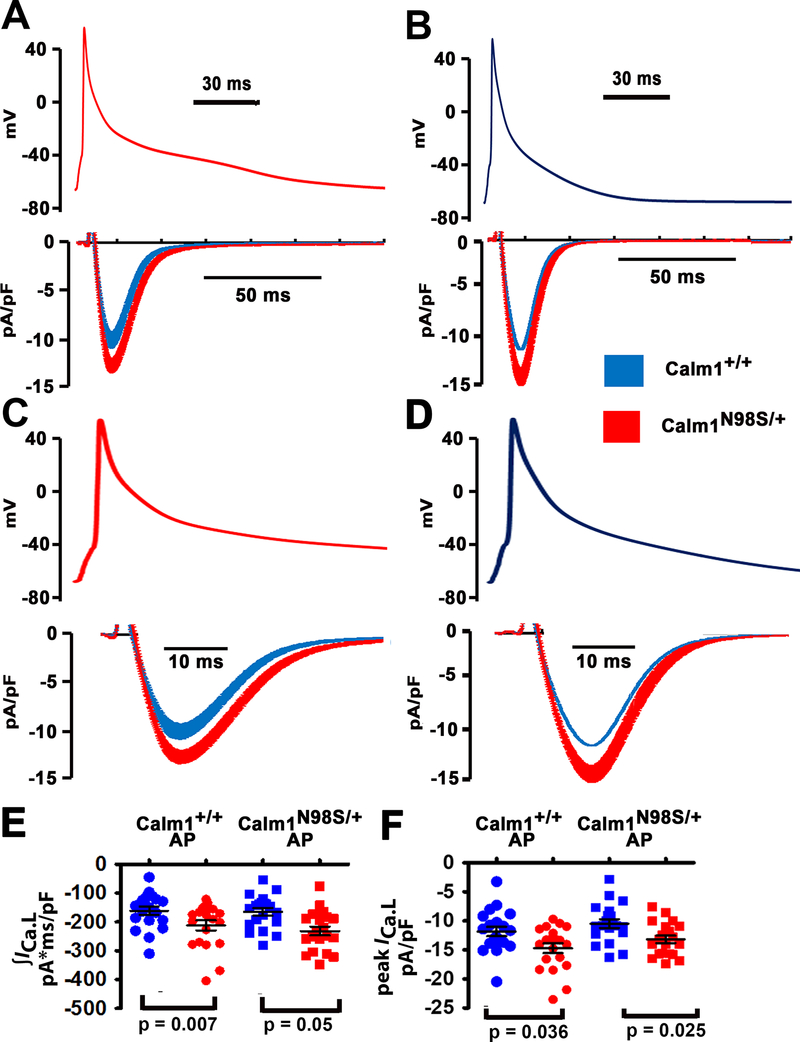
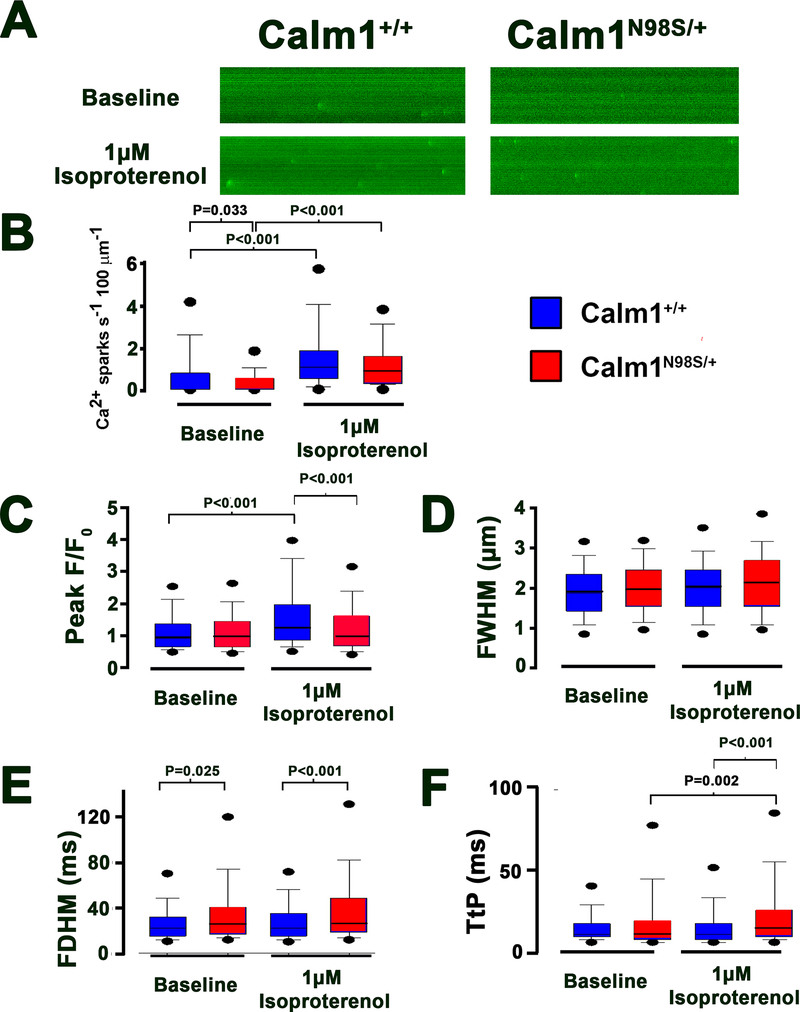
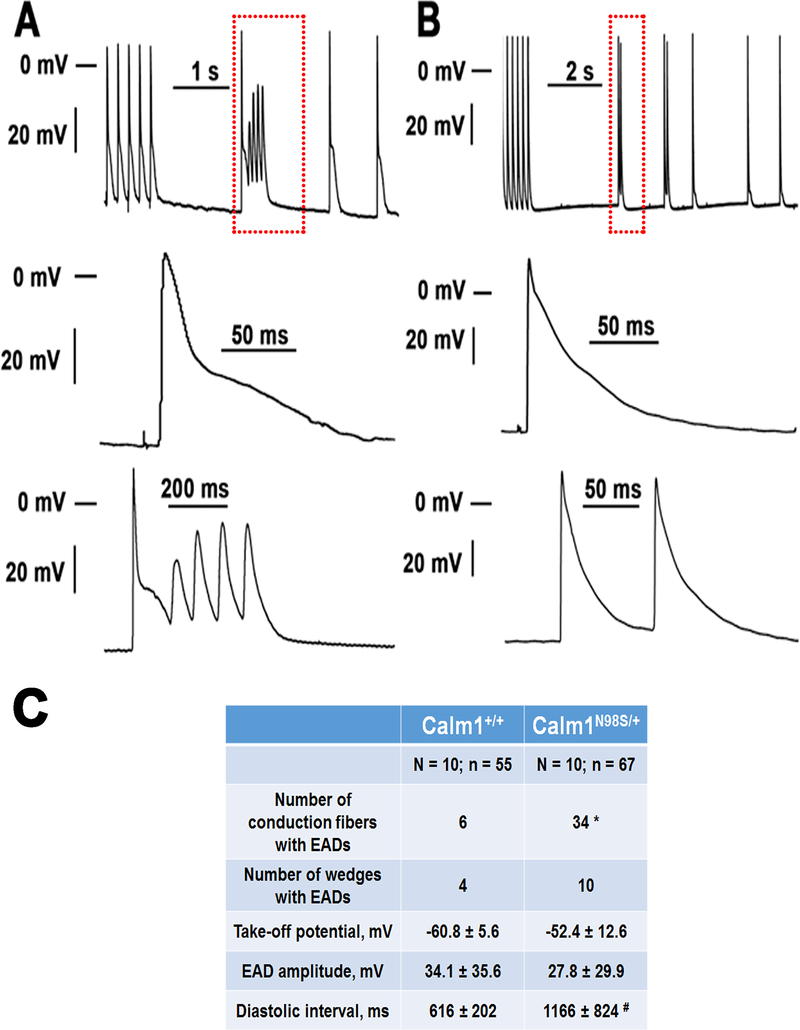
Results: Two biologically independent knock-in mouse lines heterozygous for the Calm1N98S allele were generated. Calm1N98S/+ mice of either sex and line exhibited sinus bradycardia, QTc interval prolongation, and catecholaminergic bidirectional ventricular tachycardia. Male mutant mice also showed QRS widening. Pharmacological blockade and activation of β-adrenergic receptors rescued and exacerbated, respectively, the long-QT phenotype of Calm1N98S/+ mice. Optical and electric assessment of membrane potential in isolated hearts and single left ventricular myocytes, respectively, revealed β-adrenergically induced delay of repolarization. β-Adrenergic stimulation increased peak density, slowed inactivation, and left-shifted the activation curve of ICa.L significantly more in Calm1N98S/+ versus Calm1+/+ ventricular myocytes, increasing late ICa.L in the former. Rapidly paced Calm1N98S/+ ventricular myocytes showed increased propensity to delayed afterdepolarization-induced triggered activity, whereas in situ His-Purkinje fibers exhibited increased susceptibility for pause-dependent early afterdepolarizations. Epicardial mapping of Calm1N98S/+ hearts showed that both reentry and focal mechanisms contribute to arrhythmogenesis.

Conclusions: Heterozygosity for the Calm1N98S mutation is causative of an arrhythmia syndrome characterized by sinus bradycardia, QRS widening, adrenergically mediated QTc interval prolongation, and bidirectional ventricular tachycardia. β-Adrenergically induced ICa.L dysregulation contributes to the long-QT phenotype. Pause-dependent early afterdepolarizations and tachycardia-induced delayed afterdepolarizations originating in the His-Purkinje network and ventricular myocytes, respectively, constitute potential sources of arrhythmia in Calm1N98S/+ hearts.

Keywords: arrhythmias, cardiac; calcium channels; calmodulin; heart diseases; model, animal.


Figures

Figure 1.
Figure 1.. Calm1N98S/+ mice exhibit sinus bradycardia, QRS widening, QTc prolongation and catecholaminergic ventricular tachycardia.
A, Top two rows show representative ECG traces recorded during the dark and light cycle in a littermate control (blue) and a Calm1N98S/+ mouse (red) from line 2. Traces in the third and fourth row show signal-averaged ECGs obtained by overlaying all consecutive cycles recorded within a 5- to 10-s interval, using QRS maximum or QRS minimum for the alignment. Lower row shows superimposed QRS complexes at expanded time scales. B, Dot plots of RR, QRS and QTc intervals from littermate Calm1+/+ and Calm1N98S/+ mice of line 2 and line 18. Each dot represents the 24-h average in a single animal. Horizontal lines superimposed on dots depict mean and SEM. P values by One Way ANOVA followed by Student-Newman-Keuls Method for multiple comparisons (RR and QTc) or Kruskal-Wallis One Way ANOVA on Ranks followed by Dunn’s Method for multiple comparisons (QRS). Line 2: 8 Calm1+/+and 11 Calm1N98S/+mice; Line 18: 9 Calm1+/+ and 10 Calm1N98S/+ mice. C, Calm1N98S/+ mice display bidirectional ventricular tachycardia (BVT). Representative telemetric ECG recordings from a conscious Calm1+/+ and Calm1N98S/+ mouse obtained before and shortly after intraperitoneal injection of epinephrine (2 mg per kg body weight) and caffeine (120 mg per kg body weight). In the Calm1N98S/+ mouse, an episode of sustained BVT was preceded by ventricular bigeminy (*) and spontaneously reverted to sinus rhythm. No ventricular arrhythmias were observed in the Calm1+/+ mouse. D, Complete dissociation of P waves (arrowheads) from QRS complexes during an episode of induced BVT. E, Polymorphic ventricular tachycardia in a male Calm1N98S/+ mouse. * marks transition from BVT into polymorphic VT and # denotes conversion to sinus rhythm. F, Prevalence of sustained (>15 s) BVT induced by co-administration of epinephrine and caffeine. * P < 0.001 versus Calm1+/+ by Fisher’s Exact test. G, Incidence, cumulative duration, cycle length and CI/RR ratio of episodes of sustained (≥ 15 s) BVT during a 30-min period of post-injection telemetric ECG recordings in conscious Calm1N98S/+ mice from line 2 and line 18. Dot plots with mean ± SEM shown as horizontal lines. N = 7, line 2; N = 8, line 18; *P=0.041 by t test. VT indicates ventricular tachycardia. CI indicates coupling interval and RR indicates RR interval.
Figure 2.
Figure 2.. Delayed repolarization in ventricles of Calm1N98S/+ mice.
A, Isochrone maps of epicardial activation during atrial pacing at a cycle length of 120 ms. Asterisks denote epicardial breakthrough sites on the anterior surface near the apex of the left (LV) and right ventricle (RV). Depolarization spread from the apex to the base. Sequential depolarizations are depicted in different colors according to the color legend shown in the left. Isochronal lines are 1 ms apart. B, Epicardial ventricular conduction velocities. Ventricular activation isochrone maps of the anterior aspect of a Calm1+/+ and Calm1N98S/+ heart. The anisotropic propagation in the ventricle enables measurements of maximal and minimal conduction velocities (CVmax and CVmin). C, Dot plots of CVs. Numbers indicate mean and SEM in m/s from 6 Calm1+/+ and 4 Calm1N98S/+ hearts. No statistically significant differences between the two genotypes were found. D, Left: Representative optical action potentials from the anterior left ventricular epicardium of littermate Calm1+/+ and Calm1N98S/+ mice during atrial pacing at a cycle length of 120 ms. Middle three panels: exemplar maps of the repolarization time points at APD30, APD50 and APD80. Colored scale bars are shown in the inserts. Right: superimposition of the same optical action potentials shown in the left panels. E, Dot plots showing APD30, APD50 and APD80 of littermate control and Calm1N98S/+ mice. Black horizontal lines depict mean ± SEM. * P ≤ 0.02 by t-test. N = 11 per genotype. F, Exacerbation of long QT phenotype upon exposure to epinephrine (E) and caffeine (C) combined. Exemplar ventricular repolarization (APD80) isochrone maps of the anterior aspect of a Calm1+/+ and a Calm1N98S/+ heart at baseline, during E and C exposure, and following washout. Pacing cycle length, 120 ms. G, Scatter plots of APD80. Black lines are mean ± SEM from 8 Calm1+/+ and 6 Calm1N98S/+ hearts. P values by Repeated Measures ANOVA followed by Tukey test for intragroup analyses; for intergroup analyses, a t-test (for comparisons at baseline and during washout) and Mann-Whitney Rank Sum test (for comparison during epinephrine) were used.
Figure 3.
Figure 3.. β-adrenergic stimulation induces a long QT phenotype in Calm1N98S/+ mice.
A, Left panels: superimpositions of representative action potentials electrically recorded from single myocytes isolated from the left ventricular free wall of a Calm1+/+ (blue) and a Calm1N98S/+ (red) heart. Cells were paced at 1 and 7 Hz. Right panels: single action potentials at 1 and 7 Hz pacing at expanded time scales. B, Dot plots of APD30, APD50 and APD90 in single ventricular myocytes paced at 1 and 7 Hz. Black lines denote mean ± SEM; 11 cells each from 3 Calm1+/+ mice and from 4 Calm1N98S/+ mice. * P = 0.004 vs. Calm1N98S/+ 1 Hz by paired t-test. C, Superimpositions of representative action potentials recorded from a Calm1+/+ and a Calm1N98S/+ ventricular myocyte at baseline, during isoproterenol (50 nM; Iso) treatment, and during washout. Action potentials were evoked by 2-ms square current injections delivered at 1 Hz. D, Summary of the effect of isoproterenol (Iso) on APD90 in Calm1+/+ and Calm1N98S/+ ventricular myocytes; 14 cells from 5 Calm1+/+ mice and 10 cells from 4 Calm1N98S/+ mice. * P < 0.01 by Repeated Measures ANOVA followed by Tukey test for pairwise multiple comparisons. Numbers denote mean ± SEM in ms. Base: baseline. E, Original recordings of a delayed afterdepolarization (*) and delayed afterdepolarization-triggered action potentials (arrows) in a Calm1+/+ and a Calm1N98S/+ ventricular cardiomyocyte, respectively. Traces show the terminal 6 paced action potentials from a 10-s train at 7 Hz in the presence of 50 nM isoproterenol. F, Summary of the effects of propranolol (1 mg/kg) or isoproterenol (0.17 mg/kg) on heart rate. Horizontal black lines denote mean ± SEM. Propranolol (Prop): N = 8, Calm1+/+ mice; N = 14, Calm1N98S/+ mice. Isoproterenol (Iso): N = 7, Calm1+/+; N = 7, Calm1N98S/+. P values by unpaired and paired t-test. Base: baseline. G, Representative QT interval changes in conscious male Calm1+/+ and Calm1N98S/+ mice following intraperitoneal injection of propranolol (1 mg/kg) or isoproterenol (0.17 mg/kg). Shown are signal-averaged ECGs obtained by overlaying all consecutive cycles recorded within a 5- to 10-s interval, ca. 20 min after injection. Arrows mark QT intervals. H, Summary of the effects of propranolol and isoproterenol on QTc interval. Horizontal black lines denote mean ± SEM. Propanolol (Prop): N = 8, Calm1+/+ mice; N = 14, Calm1N98S/+ mice. Isoproterenol (Iso): N = 7, Calm1+/+; N = 7, Calm1N98S/+. P values by unpaired and paired t-test. Base: baseline.
Figure 4.
Figure 4.. Ventricular arrhythmia in a Calm1N98S/+ heart.
A, Volume-conducted ECG and epicardial activation map in sinus rhythm. Asterisks denote concentric breakthroughs on the anterior right and left ventricular free walls. B, Volume-conducted ECGs and epicardial voltage maps in the presence of 100 nM isoproterenol and 3.6 mmol/L extracellular Ca2+. QRS complex numbers on ECG correspond to voltage map sequences with the same numbers. The ECG shows a junctional escape rhythm with AV dissociation and a QRS morphology similar to that during SR, a single premature ventricular complex (PVC) and 4 episodes of non-sustained VT (NSVT). Maps show epicardial breakthrough pattern during junctional escape rhythm (sequence #1), RV focal discharge (white arrowheads) coinciding with the emergence of an R-on-T ectopic ventricular beat (sequence #2) in the ECG, RV focal discharge (green arrowhead) initiating NSVT with a large wave front traveling across the epicardial surface (sequences #3 - #5), followed by an RV focal discharge (yellow arrowhead) coinciding with the last beat of the arrhythmia episode (sequence #6). Map sequences of the other 3 VT episodes similarly showed RV focal discharges initiating NSVT. Times denote intervals after the onset of epicardial breakthroughs.
Figure 5.
Figure 5.. Calm1N98S heterozygosity potentiates β-adrenergic receptor-mediated effects on cardiac ICa.L.
A and C, Exemplar whole-myocyte ICa.L traces evoked by 300-ms step depolarizations to voltages from −50 to +60 mV from a holding potential of −70 mV in control (A) and during exposure to isoproterenol (C). Interpulse interval was 5 s. Top: voltage-clamp protocol. B and D, Peak ICa.L density – voltage relations in Calm1+/+ and Calm1N98S/+ ventricular myocytes in the absence (B) and presence of isoproterenol (D). Values are mean ± SEM. Control: 11 cells each from 5 Calm+/+ mice and 5 Calm1N98S/+ mice. Isoproterenol: 24 cells from 5 Calm1+/+ mice and 29 cells from 5 Calm1N98S/+ mice. * P < 0.03 versus Calm1+/+ by t-test. E and F, Voltage-dependence of steady-state ICa.L activation and inactivation in the absence (E) and presence (F) of isoproterenol (50 nM). Values are mean ± SEM. Solid lines are best fits of the data to a Boltzmann function (fit parameters in Supplemental Table 6). Half-activation voltage in the presence of isoproterenol was significantly more negative in Calm1N98S/+ versus Calm1+/+ myocytes (−16.8 ± 0.8 mV versus −13.9 ± 0.8 mV; P = 0.018 by t-test). Insert: Calculation of the predicted window ICa.L density as a function of voltage. Amplitude of window ICa.L density was estimated as SS-act x SS-inact x ICa.L (at Vpeak). Shaded area marks the range of membrane potential typically occurring during the action potential plateau of isoproterenol-treated Calm1N98S/+ ventricular myocytes. SS-act and SS-inact indicate steady state activation and steady state inactivation, respectively. G, Exemplar whole-myocyte ICa.L traces elicited by 300-ms step depolarizations to +10 mV in the absence (top) and presence of 50 nM isoproterenol (bottom). Solid black lines are best fits of ICa.L decay to a double exponential: y(t) = Afast exp(−tfast) + Aslow exp(−tslow) + y0. H, Summary of ICa.L inactivation time constants, τfast and τslow, as a function of test potential. Values are mean ± SEM. Control: 11 cells from 5 Calm1+/+ mice and 12 cells from 4 Calm1N98S/+ mice; isoproterenol: 23 cells from 5 Calm1+/+ mice and 25 cells from 6 Calm1N98S/+ mice. Numbers above brackets indicate P values by One way ANOVA followed by multiple comparisons using the Bonferroni t-test (for τslow at 10 and 25 mV) or Kruskal Wallis One Way ANOVA on Ranks followed by Dunn’s Method for multiple comparisons (for all other voltages).
Figure 6.
Figure 6.. β-adrenergic receptor stimulation enhances peak and late ICa.L during the action potential in Calm1N98S/+ ventricular myocytes.
A and B, L-type Ca2+ currents (lower panels) elicited by “typical” action potential waveforms (upper panels) that had been pre-recorded from isoproterenol (50 nM) - treated Calm1+/+ and Calm1N98S/+ ventricular myocytes. Action potential waveforms were delivered at 1 Hz steady-state frequency in the presence of isoproterenol (50 nM). Each data point in an ICa.L trace represents the mean ± SEM of 20 and 22 cells isolated from 4 Calm1+/+ and 4 Calm1N98S/+ hearts, respectively. C and D, The same action potential waveforms and ICa.L traces shown in A and B at expanded time scales. E and F, Dot plots of total ICa.L (∫ICa.L; E) normalized to cell capacitance and peak ICa.L density during the ventricular action potential in isoproterenol-treated cardiomyocytes. AP: action potential. Horizontal lines indicate mean ± SEM; 20 cells from 4 Calm1+/+ mice and 22 cells from 4 Calm1N98S/+ mice. P values by ANOVA followed by Bonferroni test for post hoc comparison.
Figure 7.
Figure 7.. Resting Ca2+ spark properties in Calm1+/+ and Calm1N98S/+ ventricular myocytes.
A, Confocal line-scan images of diastolic Ca2+ sparks recorded in a Calm1+/+ and a Calm1N98S/+ cell in the absence (top) and presence (bottom) of 1 μM isoproterenol. B, Box and whisker plots of (B) Ca2+ spark occurrence, (C) spark amplitude, (D) full width at half maximum (FWHM), (E) full duration at half maximum (FDHM), and (F) time to peak (TtP). The ends of the box are the upper and lower quartiles. The medians are marked by the horizontal lines inside the boxes, whereas the whiskers extend to the 10% and 90% quartiles. Black dots mark 5% and 95% percentiles. Numbers above horizontal lines denote P values by Kruskal-Wallis One Way ANOVA on Ranks followed by pairwise comparisons using Dunn’s method; Calm1+/+: 443 sparks in 127 cells from 11 hearts without isoproterenol, 546/32/5 with 1 μM isoproterenol; Calm1N98S/+: 274/125/9 without isoproterenol, 517/37/4 with 1 μM isoproterenol.
Figure 8.
Figure 8.. Pause-dependent early afterdepolarizations in the His-Purkinje network of Calm1N98S/+ hearts.
A and B Top: original traces of membrane potential obtained from His-Purkinje myocytes in Calm1N98S/+ hearts. The traces shown include the last 5 action potentials from a train of 30 action potentials at 5 Hz pacing, followed by >1-s pauses and spontaneous action potentials. Middle: Magnified views of the final paced action potential. Bottom: Magnified views of the boxed regions in the top panels, illustrating pause-dependent repetitive early afterdepolarizations (A) and an early afterdepolarization (B) arising from a spontaneous action potential. Neither cell developed diastolic (delayed) afterdepolarizations. Note the presence of automaticity in the fiber shown in B. C, Properties of early afterdepolarizations. N and n are the number of hearts and conduction fibers, respectively. EAD, early afterdepolarization; mean values for take-off potential, EAD amplitude and diastolic interval preceding the EAD-containing cycle were averaged from 202 and 23 EADs in Calm1N98S/+ and Calm1+/+ wedges, respectively. * P < 0.001 versus Calm1+/+ by Chi-square test. # P = 0.006 versus Calm1+/+ by Mann-Whitney Rank Sum test.

Similar articles

Cited by

References

    1. Makita N, Yagihara N, Crotti L, Johnson CN, Beckmann BM, Roh MS, Shigemizu D, Lichtner P, Ishikawa T, Aiba T, et al. Novel calmodulin mutations associated with congenital arrhythmia susceptibility. Circ Cardiovasc Genet. 2014;7:466–474. - PMC - PubMed
    1. Crotti L, Johnson CN, Graf E, De Ferrari GM, Cuneo BF, Ovadia M, Papagiannis J, Feldkamp MD, Rathi SG, Kunic JD, et al. Calmodulin mutations associated with recurrent cardiac arrest in infants. Circulation. 2013;127:1009–1017. - PMC - PubMed
    1. Pipilas DC, Johnson CN, Webster G, Schlaepfer J, Fellmann F, Sekarski N, Wren LM, Ogorodnik KV, Chazin DM, Chazin WJ, et al. Novel calmodulin mutations associated with congenital long QT syndrome affect Ca2+ current in human cardiomyocytes. Heart Rhythm. 2016;13:2012–2019. - PMC - PubMed
    1. Boczek NJ, Gomez-Hurtado N, Ye D, Calvert ML, Tester DJ, Kryshtal D, Hwang HS, Johnson CN, Chazin WJ, Loporcaro CG, et al. Spectrum and Prevalence of CALM1-, CALM2-, and CALM3-Encoded Calmodulin Variants in Long QT Syndrome and Functional Characterization of a Novel Long QT Syndrome-Associated Calmodulin Missense Variant, E141G. Circ Cardiovasc Genet. 2016;9:136–146. - PMC - PubMed
    1. Gomez-Hurtado N, Boczek NJ, Kryshtal DO, Johnson CN, Sun J, Nitu FR, Cornea RL, Chazin WJ, Calvert ML, Tester DJ, et al. Novel CPVT-Associated Calmodulin Mutation in CALM3 (CALM3-A103V) Activates Arrhythmogenic Ca2+ Waves and Sparks. Circ Arrhythm Electrophysiol. 2016;9: pii: e004161. - PMC - PubMed

Publication types

Supplementary concepts