. 2020 Nov 10;142(19):1848-1862.
doi: 10.1161/CIRCULATIONAHA.119.041433. Epub 2020 Sep 15.

Single-Cell RNA Sequencing Unveils Unique Transcriptomic Signatures of Organ-Specific Endothelial Cells

Affiliations

Single-Cell RNA Sequencing Unveils Unique Transcriptomic Signatures of Organ-Specific Endothelial Cells

David T Paik et al. Circulation. .

Abstract

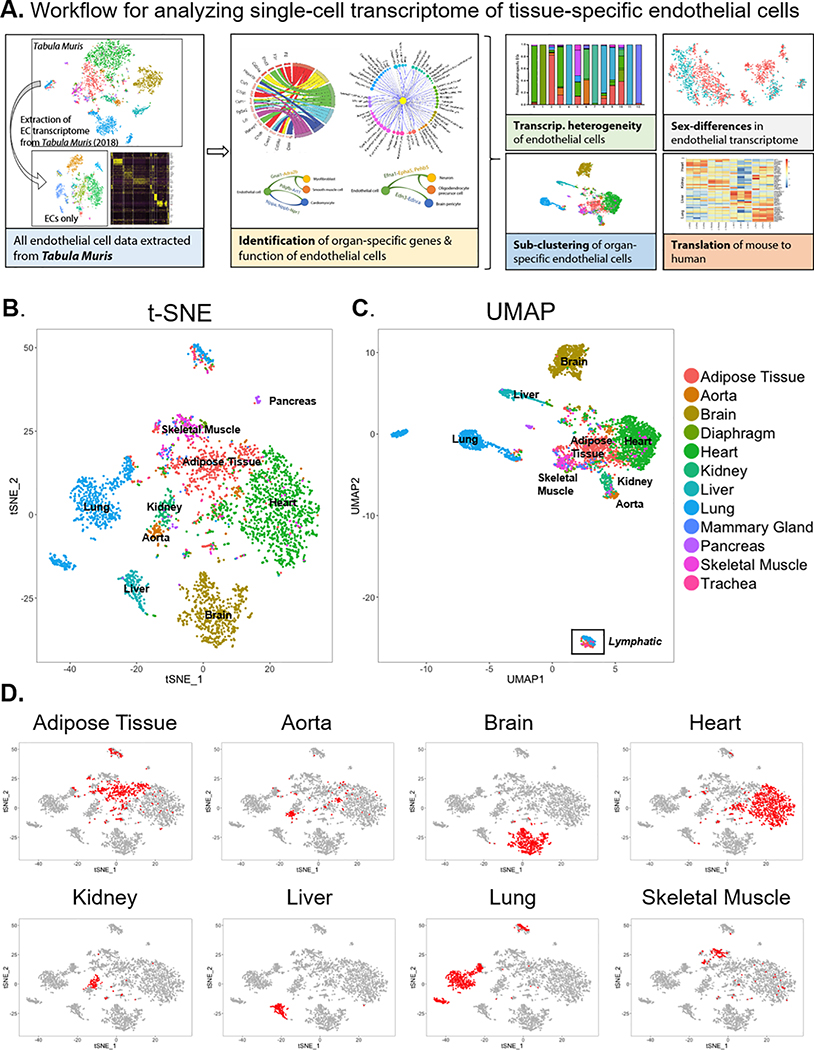
Background: Endothelial cells (ECs) display considerable functional heterogeneity depending on the vessel and tissue in which they are located. Whereas these functional differences are presumably imprinted in the transcriptome, the pathways and networks that sustain EC heterogeneity have not been fully delineated.

Methods: To investigate the transcriptomic basis of EC specificity, we analyzed single-cell RNA sequencing data from tissue-specific mouse ECs generated by the Tabula Muris consortium. We used a number of bioinformatics tools to uncover markers and sources of EC heterogeneity from single-cell RNA sequencing data.

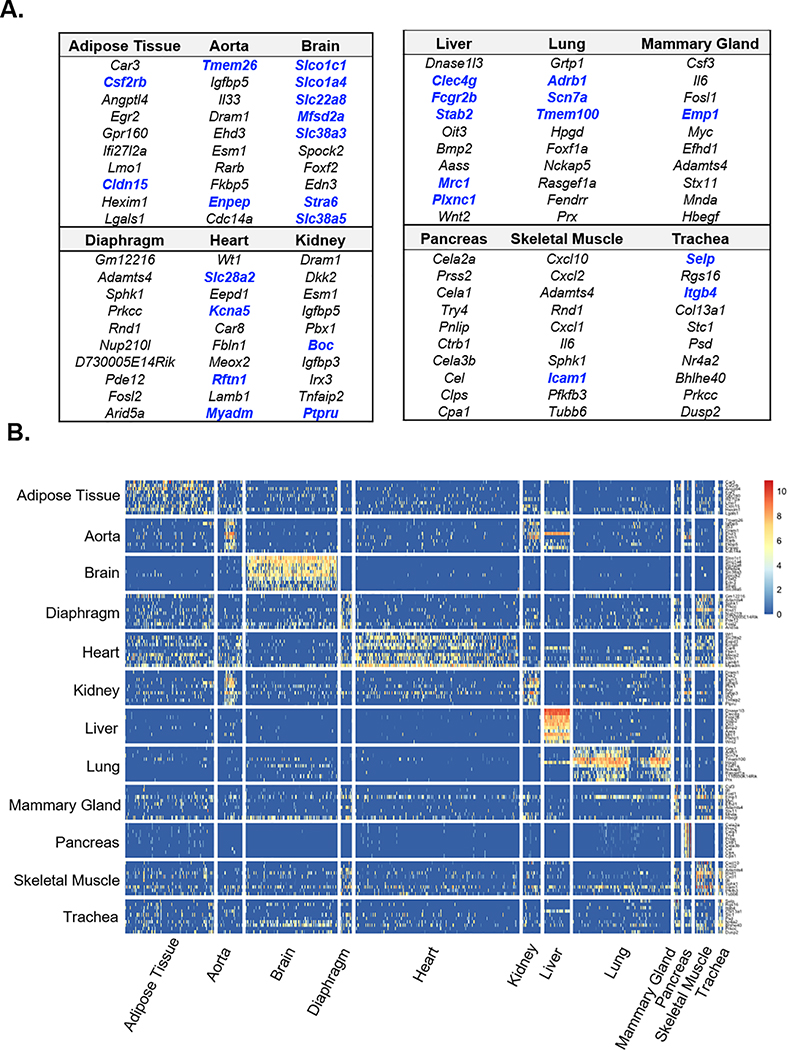
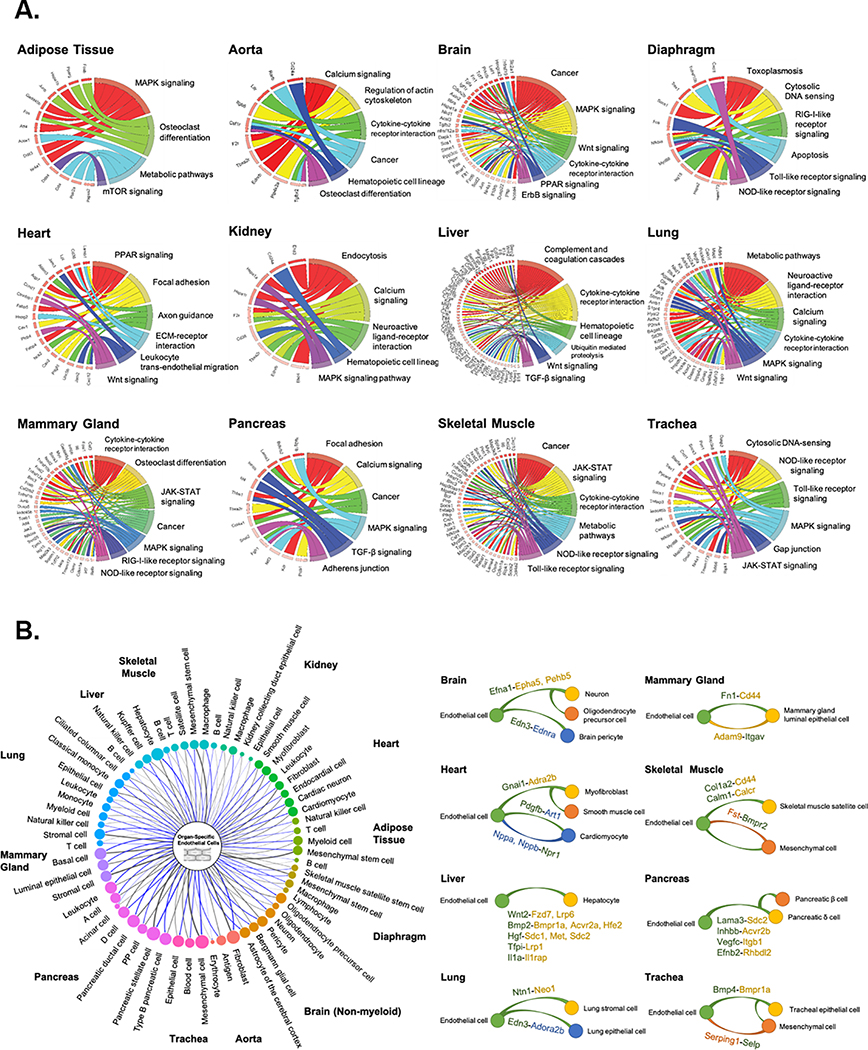
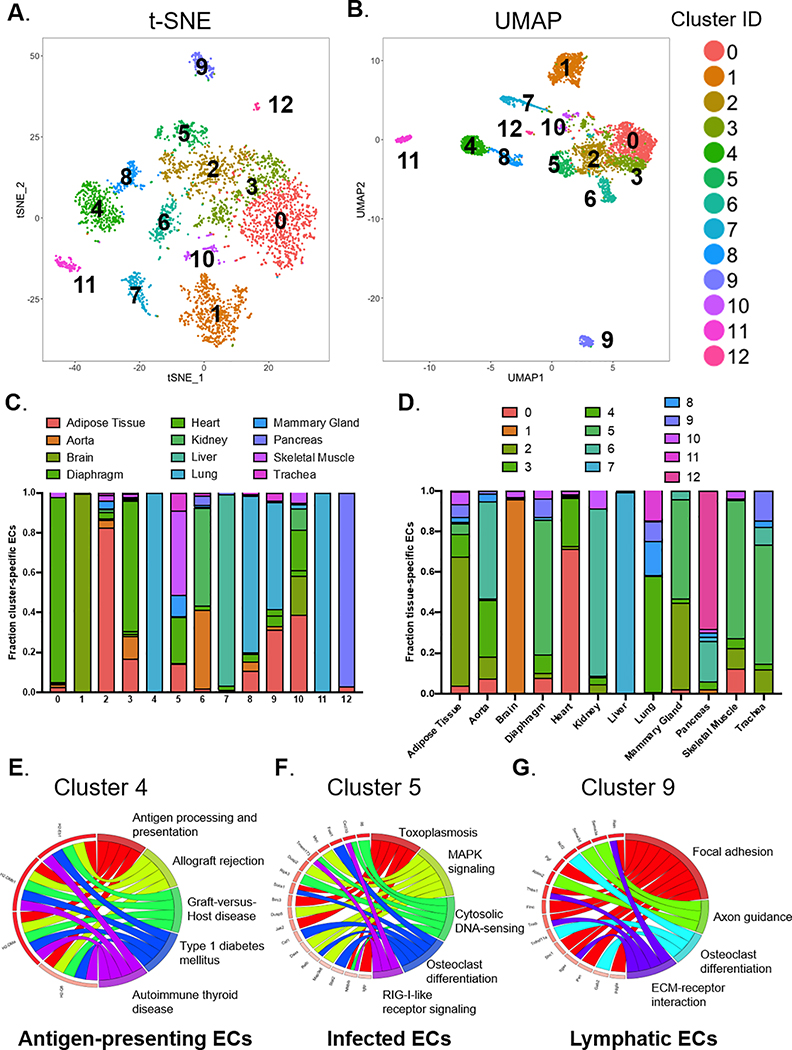
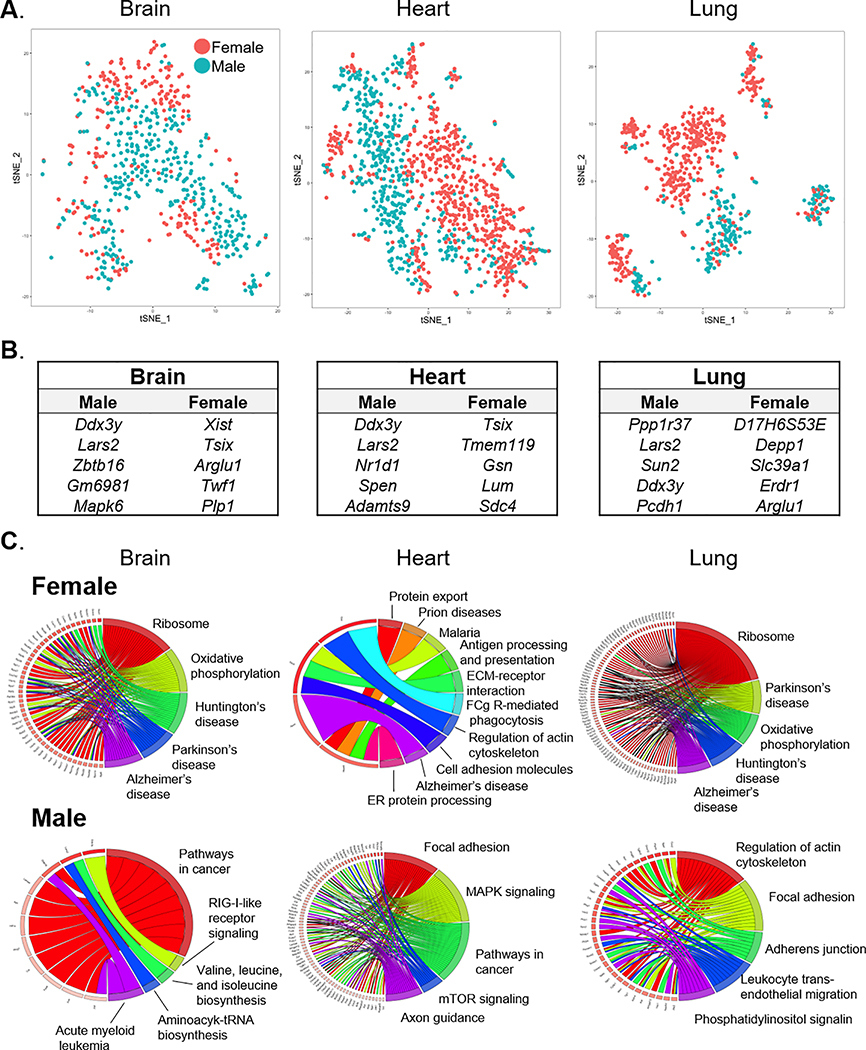
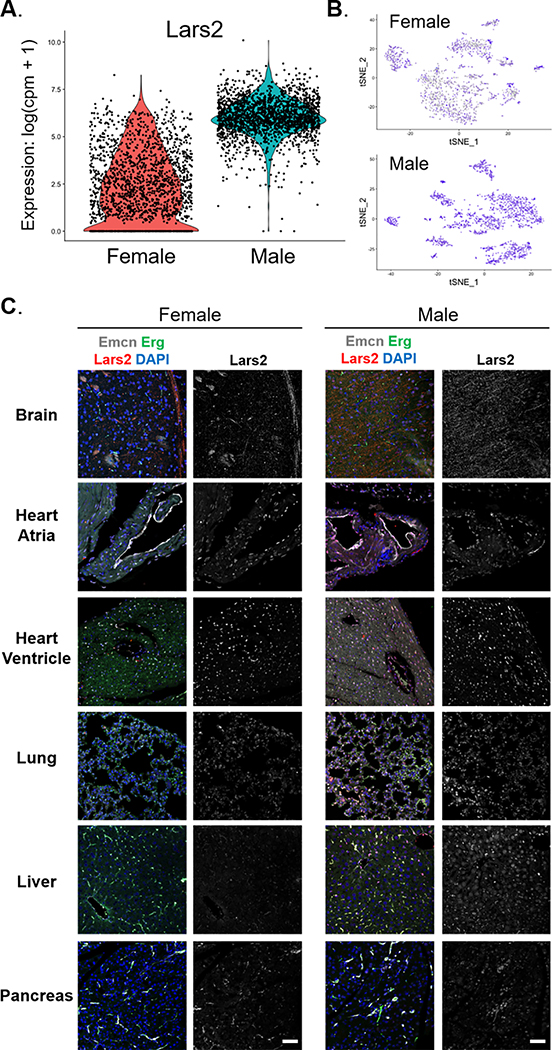
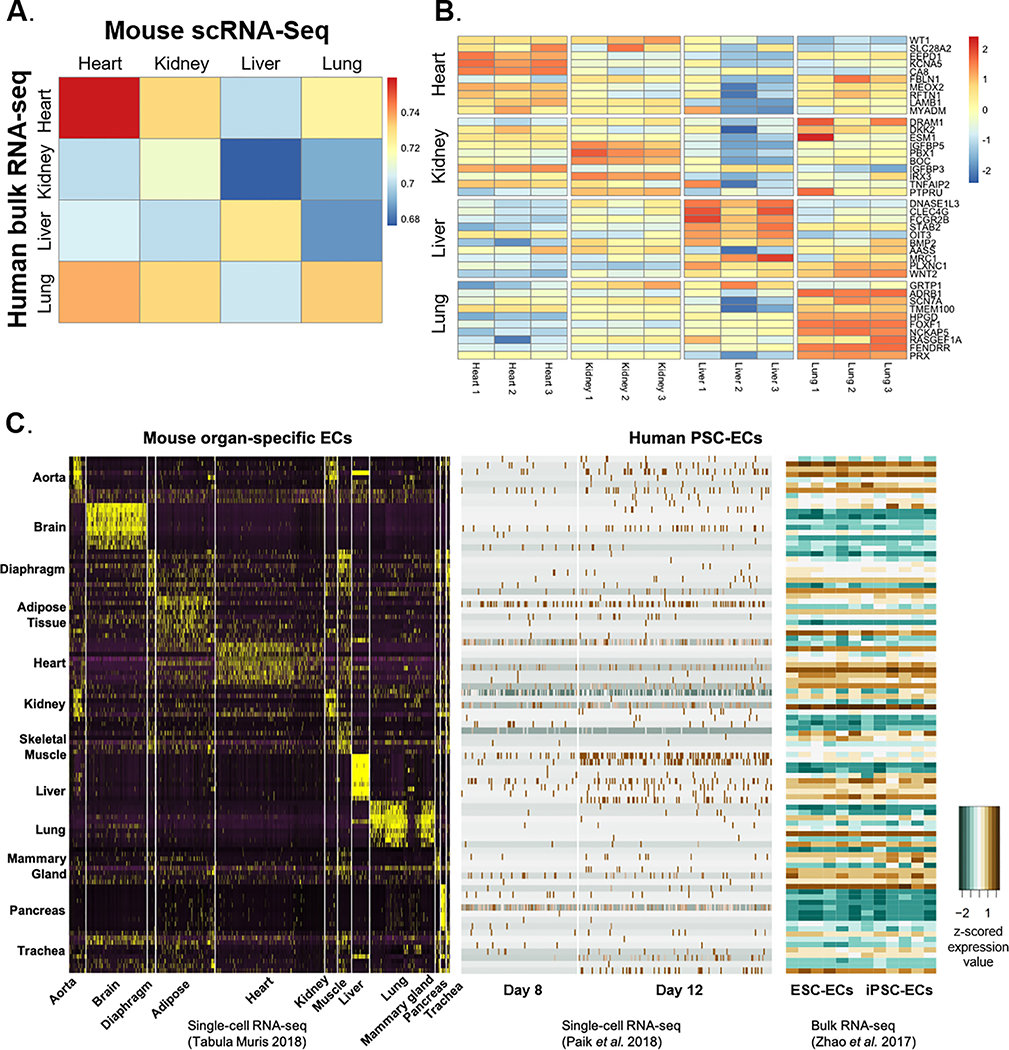
Results: We found a strong correlation between tissue-specific EC transcriptomic measurements generated by either single-cell RNA sequencing or bulk RNA sequencing, thus validating the approach. Using a graph-based clustering algorithm, we found that certain tissue-specific ECs cluster strongly by tissue (eg, liver, brain), whereas others (ie, adipose, heart) have considerable transcriptomic overlap with ECs from other tissues. We identified novel markers of tissue-specific ECs and signaling pathways that may be involved in maintaining their identity. Sex was a considerable source of heterogeneity in the endothelial transcriptome and we discovered Lars2 to be a gene that is highly enriched in ECs from male mice. We found that markers of heart and lung ECs in mice were conserved in human fetal heart and lung ECs. We identified potential angiocrine interactions between tissue-specific ECs and other cell types by analyzing ligand and receptor expression patterns.

Conclusions: We used single-cell RNA sequencing data generated by the Tabula Muris consortium to uncover transcriptional networks that maintain tissue-specific EC identity and to identify novel angiocrine and functional relationships between tissue-specific ECs.

Keywords: computational biology; endothelial cells; sequence analysis, RNA.


Conflict of interest statement

DISCLOSURES

Dr. Wu is a co-founder of Khloris Biosciences but has no competing interests, as the work presented here is completely independent. The other authors declare no competing interests.

Figures

Figure 1.
Figure 1.. Single-cell transcriptome of endothelial cells in 12 major organs extracted from the Tabula Muris dataset.
(A) Experimental workflow for analyzing single-cell transcriptomes of tissue-specific endothelial cells (ECs). Projection of ECs onto (B) t-distributed Stochastic Neighbor Embedding (t-SNE) and (C) Uniform Manifold Approximation and Projection (UMAP) plots. ECs are color-coded by their tissue of origin. (D) Location of organ-specific ECs for 8 major individual organs on the t-SNE plot.
Figure 2.
Figure 2.. Identification of differentially expressed genes in organ-specific endothelial cells.
(A) Top ten differentially expressed genes in ECs of each of the 12 organs as determined by Wilcoxon rank-sum test. Blue indicate genes that encode for cell surface proteins. (B) Heatmap depicting expression levels of the top ten organ-specific differentially expressed genes (DEGs) in ECs from different organs. Rows indicate each gene and columns indicate single cells.
Figure 3.
Figure 3.. Pathway enrichment and angiocrine relationship prediction analyses.
(A) Kyoto Encyclopedia of Genes and Genomes (KEGG) pathway enrichment analysis of DEGs of tissue-specific ECs reveals unique organ-specific EC genes in signaling and cellular pathways, shown in chord plots. (B) Predicted angiocrine relationships between organ-specific ECs (left, center) and parenchymal cells (left, perimeter) from the same organ. Relationships are determined by expression of a secreted ligand in one cell type and its corresponding receptor in another. The thickness of connecting lines and size of bubbles indicate the number of ligand-receptor pairs. Representative organ-specific ligand-to-receptor pairs are shown for 8 major organs (right). In the representative pairs shown, the ligand is written as the former and the receptor as the latter followed by a dash. Cell type which expresses each gene is noted by the color. Green represents endothelial cells and yellow, orange, and blue represent parenchymal cell types in each organ as shown.
Figure 4.
Figure 4.. Unsupervised clustering to reveal subpopulations of ECs.
13 individual clusters (numbered 0 to 12) identified from a graph-based unsupervised clustering approach are shown in (A) t-SNE and (B) UMAP plots. (C) Proportion of ECs originating from different organs in each of the unsupervised clusters. (D) Proportion of ECs from unsupervised clusters in each of the 12 major organs. Based on KEGG pathway enrichment analysis of DEGs for each cluster, (E) “Cluster 4” represents antigen-presenting ECs, (F) “Cluster 5” represents infected ECs, and (G) “Cluster 9” represents lymphatic ECs.
Figure 5.
Figure 5.. Sex differences in tissue-specific EC gene expression.
(A) Projections of ECs from brain, heart, and lung onto t-SNE maps color-coded by sex. (B) List of genes differentially expressed between male and female ECs in each organ. (C) KEGG pathway enrichment analysis of sex- and organ-specific DEGs show correlation of sex-dependent genes in ECs with organ-specific disease and/or cellular pathways.
Figure 6.
Figure 6.. Lars2 expression is unique to male endothelial cells.
Endothelial cells from male mice exhibit higher expression of Lars2 gene than females. (A) Violin plot shows the expression level of Lars2 in endothelial cells from male and female mice. Expression value is shown as log(counts per million + 1). (B) Expression level of Lars2 shown on t-SNE projection of endothelial cells from female and male mice. Blue and grey indicate cells with high and low expression of Lars2, respectively. (C) Immunofluorescent staining of various adult mouse organs from male and female mice shows enriched expression of LARS2 protein (red, left panel) in male brain, heart ventricle, lung, and liver tissues, which co-localizes with the endothelial nuclear marker Erg (green, left panel). Scale bar, 50 μm.
Figure 7.
Figure 7.. Mouse-to-human translation of organ-specific EC transcriptome.
(A) Correlation between murine EC gene expression with the corresponding human organ obtained from a previously published dataset (Marcu et al., 2018). Heatmap shows Spearman’s rank correlation coefficients. (B) Expression values (log counts per million) of murine organ-specific EC DEGs in the corresponding human organ-specific ECs (Marcu et al., 2018). (C) z-scored expression value of DEGs in organ-specific ECs from mice are assessed in human induced pluripotent stem cell-derived EC transcriptome obtained from the published single-cell (Paik et al., 2018) and bulk (Zhao et al., 2017) RNA-seq datasets.

References

    1. Cines DB, Pollak ES, Buck CA, Loscalzo J, Zimmerman GA, McEver RP, Pober JS, Wick TM, Konkle BA, Schwartz BS, Barnathan ES, McCrae KR, Hug BA, Schmidt AM, Stern DM. Endothelial cells in physiology and in the pathophysiology of vascular disorders. Blood. 1998;91:3527–3561. - PubMed
    1. Vanhoutte PM, Shimokawa H, Feletou M, Tang EHC. Endothelial dysfunction and vascular disease - a 30th anniversary update. Acta Physiol Oxf Engl. 2017;219:22–96. - PubMed
    1. Dudley AC. Tumor endothelial cells. Cold Spring Harb Perspect Med. 2012;2:a006536. - PMC - PubMed
    1. Tabit CE, Chung WB, Hamburg NM, Vita JA. Endothelial dysfunction in diabetes mellitus: molecular mechanisms and clinical implications. Rev Endocr Metab Disord. 2010;11:61–74. - PMC - PubMed
    1. Rohlenova K, Goveia J, García-Caballero M, Subramanian A, Kalucka J, Treps L, Falkenberg KD, de Rooij LPMH, Zheng Y, Lin L, et al. Single-cell RNA sequencing maps endothelial metabolic plasticity in pathological angiogenesis. Cell Metab 2020;31:862–877.e14. - PubMed

Publication types