. 2021 Jan 1;31(1):379-395.
doi: 10.1093/cercor/bhaa231.

Cortical Interlaminar Astrocytes Are Generated Prenatally, Mature Postnatally, and Express Unique Markers in Human and Nonhuman Primates

Affiliations

Cortical Interlaminar Astrocytes Are Generated Prenatally, Mature Postnatally, and Express Unique Markers in Human and Nonhuman Primates

Carmen Falcone et al. Cereb Cortex. .

Abstract

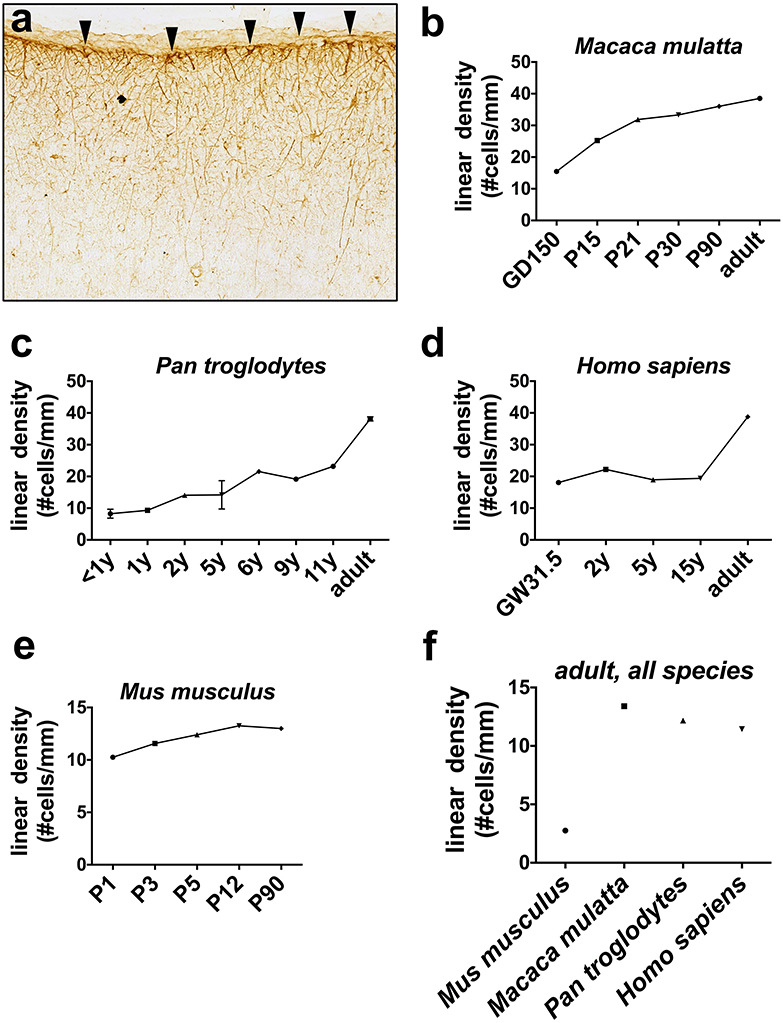
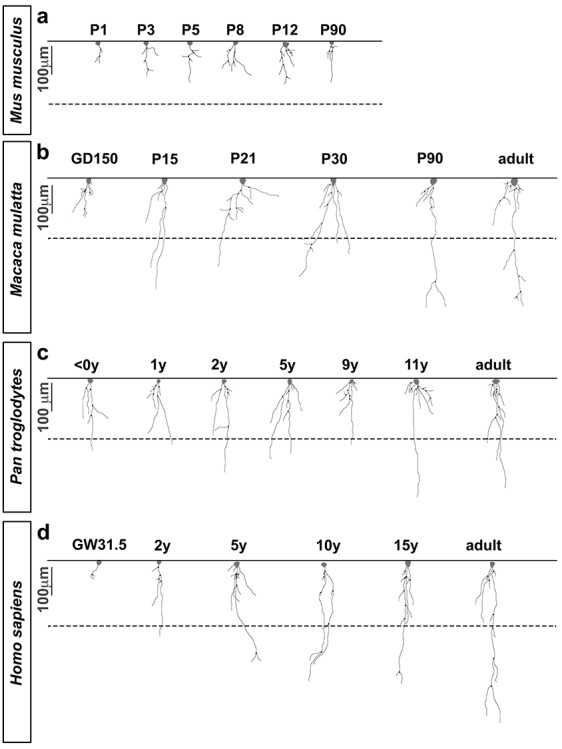
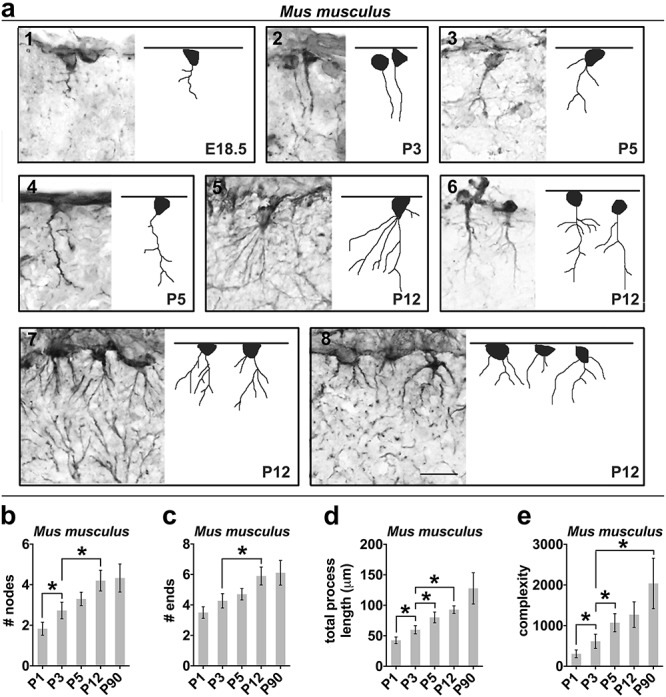
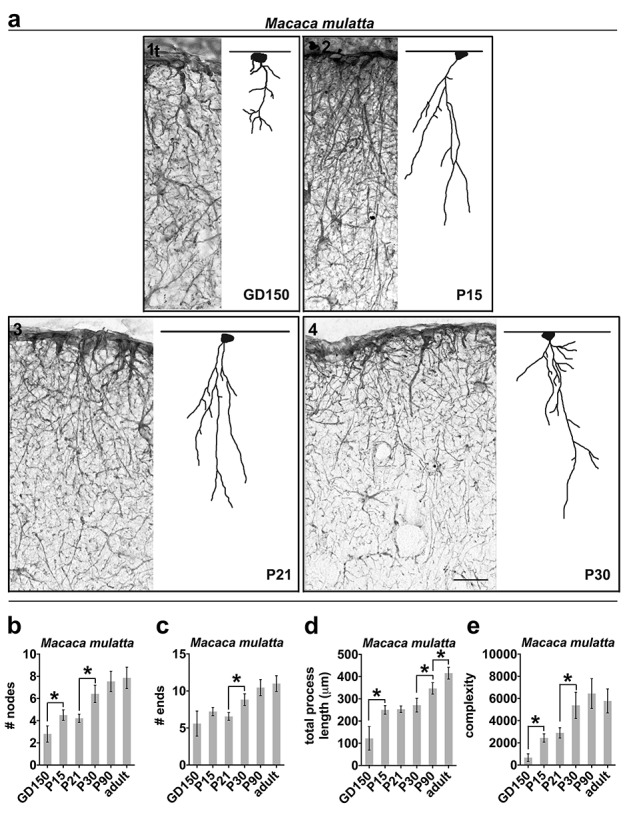
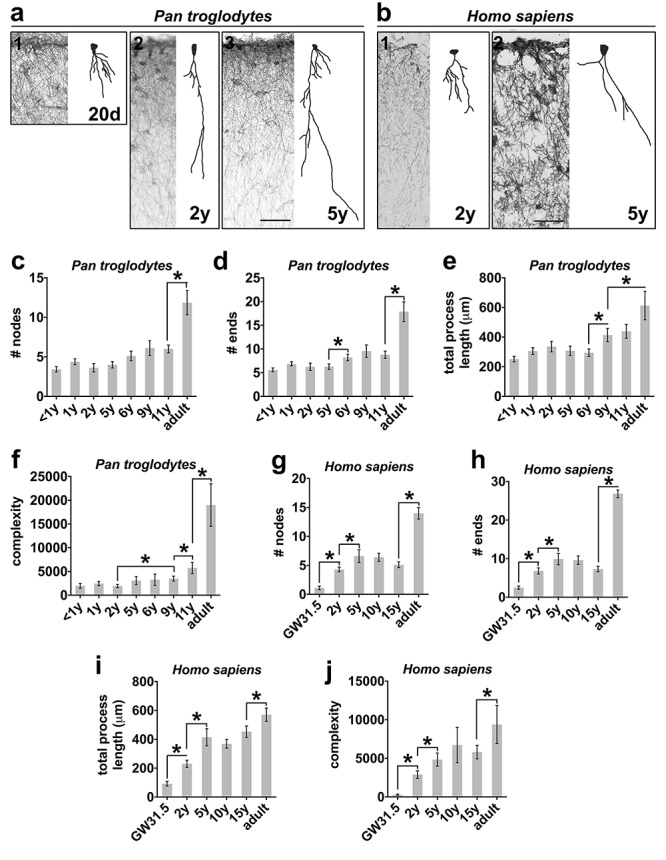
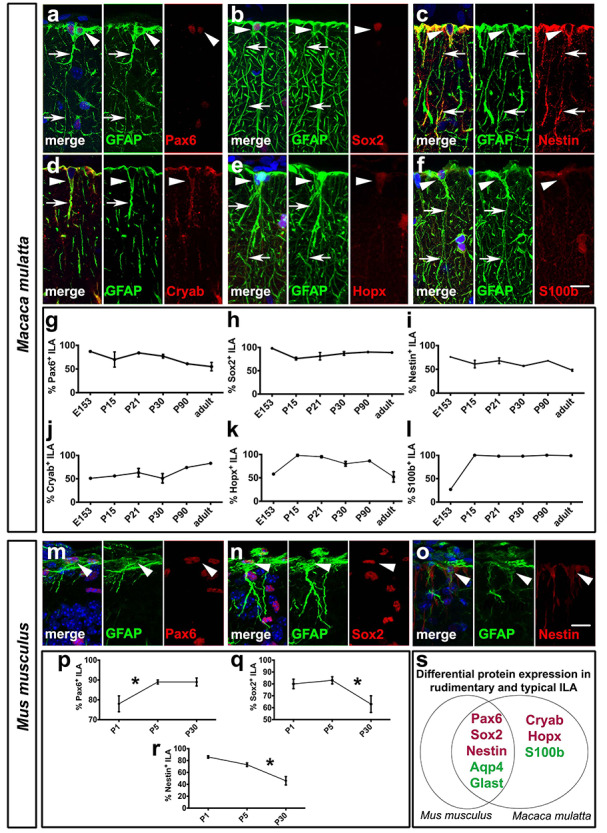
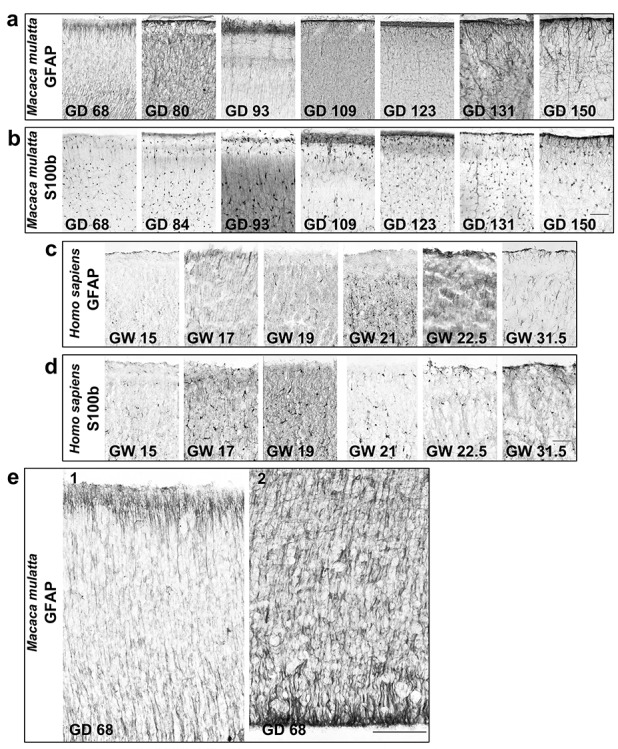
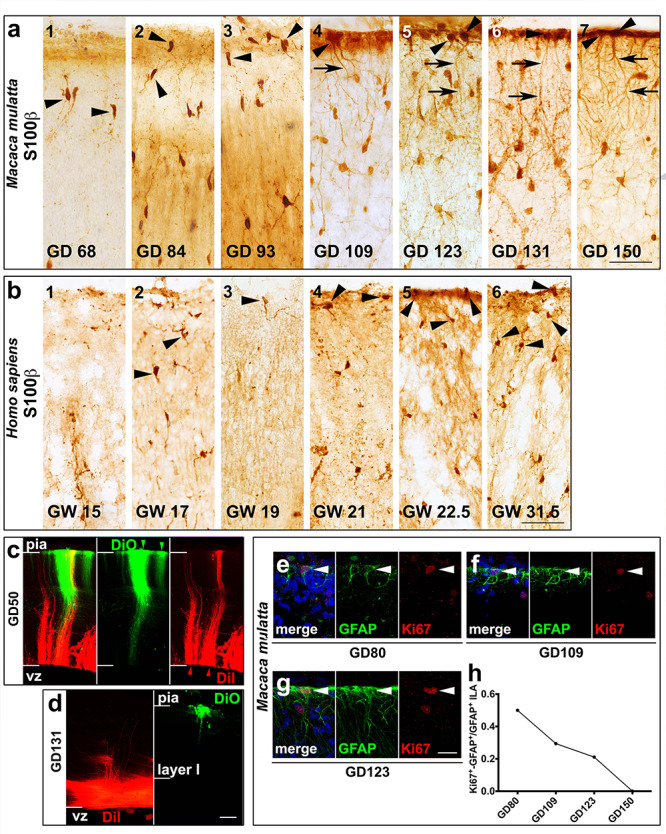
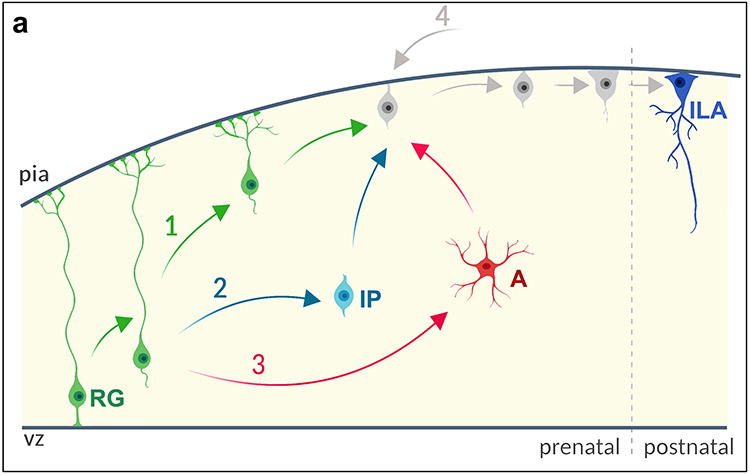
Interlaminar astrocytes (ILAs) are a subset of cortical astrocytes that reside in layer I, express GFAP, have a soma contacting the pia, and contain long interlaminar processes that extend through several cortical layers. We studied the prenatal and postnatal development of ILAs in three species of primates (rhesus macaque, chimpanzee, and human). We found that ILAs are generated prenatally likely from radial glial (RG) cells, that ILAs proliferate locally during gestation, and that ILAs extend interlaminar processes during postnatal stages of development. We showed that the density and morphological complexity of ILAs increase with age, and that ILAs express multiple markers that are expressed by RG cells (Pax6, Sox2, and Nestin), specific to inner and outer RG cells (Cryab and Hopx), and astrocyte markers (S100β, Aqp4, and GLAST) in prenatal stages and in adult. Finally, we demonstrated that rudimentary ILAs in mouse also express the RG markers Pax6, Sox2, and Nestin, but do not express S100β, Cryab, or Hopx, and that the density and morphological complexity of ILAs differ between primate species and mouse. Together these findings contribute new information on astrogenesis of this unique class of cells and suggest a lineal relationship between RG cells and ILAs.

Keywords: astrocytes; astrogenesis; cerebral cortex; development; primates.


Figures

Figure 1
Figure 1
ILA linear density increases across development. ILA linear density (number of ILA cells per mm of pia mater in different developmental stages. (a) Representative image of GFAP+ IHC used to count ILAs. The arrowheads point at ILA somas along the pial surface. ILA linear density in developmental stages of (b) rhesus macaque (M. mulatta), (c) chimpanzee (P. troglodytes), (d) human (H. sapiens), and (e) mouse (Mus musculus). (f) ILA linear density in adult mouse, macaque, chimpanzee, and human. GD = gestation day; P = postnatal day; y = year(s); GW = gestation week.
Figure 2
Figure 2
ILA morphological complexity increases across development. Representative Neurolucida ILA reconstructions depicting the developmental progression of ILA morphology in (a) mouse, (b) macaque, (c) chimpanzee, and (d) human. Full lines = pia surface. Dashed lines = Layers I and II boundary. Scale bar applies to all images = 100 μm.
Figure 3
Figure 3
ILA morphology complexity increases across mouse development. (a1–a8) Representative images of GFAP+ rudimentary ILAs and reconstructions at different developmental stages of mouse. The pia mater is represented by a line on top of each image. (b–e) Numerical data calculated by Neurolucida analyzer per single cell in mouse; specifically: (b) average number of nodes (independent t-tests comparing P1 and P3: P < 0.02; P3 and P12: P < 0.03); (c) average number of ending points (independent t-tests comparing P3 and P12: P < 0.02); (d) average total process length (independent t-tests comparing P1 and P3: P < 0.02; P3 and P5: P < 0.04; P3 and P12: P < 0.002); (e) average complexity index (independent t-tests comparing P1 and P3: P < 0.03; P3 and P5: P < 0.03). Error bars = s.e.m. * = P value < 0.05. Scale bar applies to all images = 50 μm.
Figure 4
Figure 4
ILA morphology complexity increases across rhesus macaque development. (a1–a4) Representative images of GFAP+ ILAs and cell reconstructions at different developmental stages of macaque. (b–e) Numerical data calculated by Neurolucida analyzer per single cell in macaque monkey; specifically: (b) average number of nodes (independent t-tests comparing GD150 and P15: P < 0.04; P21 and P30: P < 0.003); (c) average number of ending points (independent t-tests comparing P21 and P30: P < 0.007); (d) average total process length (independent t-tests comparing GD150 and P15: P < 0.01; P30 and P90: P < 0.02, P90 and adult: P < 0.04); (e) average complexity index. Error bars = s.e.m. * = P value < 0.05. Scale bar applies to all images = 50 μm.
Figure 5
Figure 5
ILA morphology complexity increases across chimpanzee development. (a1–a3, b1 and b2) Representative images of GFAP+ ILA and cell reconstructions at different developmental stages of chimpanzee (a1–a3) and human (b1 and b2). The pia mater is represented by a line on the top of each image. (c–j) Numerical data calculated by Neurolucida analyzer per single cell in chimpanzee and human; specifically: (c,g) average number of nodes (independent t-tests comparing 11 yearsand adult: P < 0.006 in [c]; GW 31.5 and 2 years: P < 1.1 × 10⁻⁵, 2 and 5 years: P < 0.04, 15 years and adult: P < 6.6 × 10⁻⁶ in [g]); (d, h) average number of ending points (independent t-tests comparing 5 and 6 years: P < 0.02, 11 years and adult: P < 0.002 in [d]; GW31.5 and 2 years: P < 0.0003, 2 and 5 years: P < 0.05, 15 years and adult: P < 1.1 × 10⁻¹⁴ in [h]); (e, i) average total process length (independent t-tests comparing 6 and 9 years: P < 0.02, 9 years and adult: P < 0.05 in [e]; GW31.5 and 2 years: P < 0.0002, 2 and 5 years: P < 0.006, 15 years and adult: P < 0.001 in [i]); (f, j) average complexity index (independent t-tests comparing 2 and 9 years: P < 0.01, 9 and 11 years: P < 0.05, 11 years and adult: P < 0.02 in [f]; GW31.5 and 2 years: P < 0.0001, 2 and 5 years: P < 0.03, 15 years and adult: P < 0.04 in [j]). Error bars = s.e.m. * = P value < 0.05. Scale bar applies to all images = 50 μm.
Figure 6
Figure 6
ILAs express stem/progenitor cell and astrocyte markers in developing and adult rhesus macaque and mouse. (a–f) Double immunofluorescence staining of GFAP, in green, and: (a) Pax6, (b) Sox2, (c) Nestin, (d) Cryab, (e) Hopx, (f) S100β, in red. (g–l) Percentage of GFAP+ ILAs positive for (g) Pax6, (h) Sox2, (i) Nestin, (j) Cryab, (k) Hopx, (l) S100β, respectively, across different developmental stages of macaque (a: P21, b: P90, c: GD150, d: GD150, e: P30, f: P15). (m–o) Double immunofluorescence staining of GFAP, and Pax6, Sox2, or Nestin, respectively, in mouse at P5. (p–r) Percentage of GFAP+ ILAs positive for (p) Pax6, (q) Sox2 (independent t-tests comparing P5 and P30: P < 0.02), (r) Nestin (independent t-tests comparing P5 and P30: P < 0.01), (s) Differential protein expression in rudimentary and typical ILAs in mouse and rhesus macaque, respectively. Pia surface is on top. White arrowheads point to ILA somas. * = P value < 0.05. Scale bar applies to all images = 50 μm.
Figure 7
Figure 7
ILAs develop prenatally in macaques and human. (a,b) ×40 magnification pictures of immunoenzymatic staining anti-GFAP and anti-S100β, DAB amplified, showing ILA somas in prenatal stages of (a,b) M. mulatta and (c,d) H. sapiens. Scale bars = 50 μm. (e) ×100 magnification pictures of immunoenzymatic staining anti-GFAP at GD68 of M. mulatta, showing RG fibers attached to the pia (e1) and emanating from the ventricular zone (e2). Scale bar applies to both images = 100 μm.
Figure 8
Figure 8
ILAs develop and proliferate prenatally. (a,b) S100β+ ILA somas in prenatal stages of (a) macaque and (b) human. The black arrowheads point to ILA somas. The black arrows point at ILA processes. (c–d) DiI (red) and DiO (green) injected in the VZ and the pia, respectively at GD50 (c) and GD131 (d). (e-g) Double immunofluorescence staining anti-GFAP and anti-Ki67 at GD80, GD109 and GD123, respectively, in macaque. White arrowheads point to ILA somas. (h) Ki67+-GFAP+ ILA frequency across development in macaque. Scale bars = 20 μm in a–f; 50 μm in m–o.
Figure 9
Figure 9
ILA are generated by RG cells: model and hypothesis. (a) ILA prenatal generation. RG = radial glia cell; IP = intermediate progenitor cell; A = astrocyte. ILAs can be locally generated in the cortex by directly transforming RG (Hypothesis 1, green), by an IP step (Hypothesis 2, light blue), by astrocytic IP step (Hypothesis 3, pink), or from other sources external to the cortex (Hypothesis 4, gray). Hypothesis are not mutually exclusive.

References

    1. Agulhon C, Fiacco TA, McCarthy KD. 2010. Hippocampal short- and long-term plasticity are not modulated by astrocyte Ca2+ signaling. Science. 327:1250–1254. - PubMed
    1. Agulhon C, Petravicz J, McMullen AB, Sweger EJ, Minton SK, Taves SR, Casper KB, Fiacco TA, McCarthy KD. 2008. What is the role of astrocyte calcium in neurophysiology? Neuron. 59:932–946. - PMC - PubMed
    1. Andriezen WL. 1893. The neuroglia elements in the human brain. Br Med J. 2:227–230. - PMC - PubMed
    1. Araque A, Navarrete M. 2010. Glial cells in neuronal network function. Philos Trans R Soc B Biol Sci. 365:2375–2381. - PMC - PubMed
    1. Burda JE, Bernstein AM, Sofroniew MV. 2016. Astrocyte roles in traumatic brain injury. Exp Neurol. 275:305–315. - PMC - PubMed

Publication types