. 2021 Jan 5;31(2):768-784.
doi: 10.1093/cercor/bhaa256.

Impaired State-Dependent Potentiation of GABAergic Synaptic Currents Triggers Seizures in a Genetic Generalized Epilepsy Model

Affiliations

Impaired State-Dependent Potentiation of GABAergic Synaptic Currents Triggers Seizures in a Genetic Generalized Epilepsy Model

Chun-Qing Zhang et al. Cereb Cortex. .

Abstract

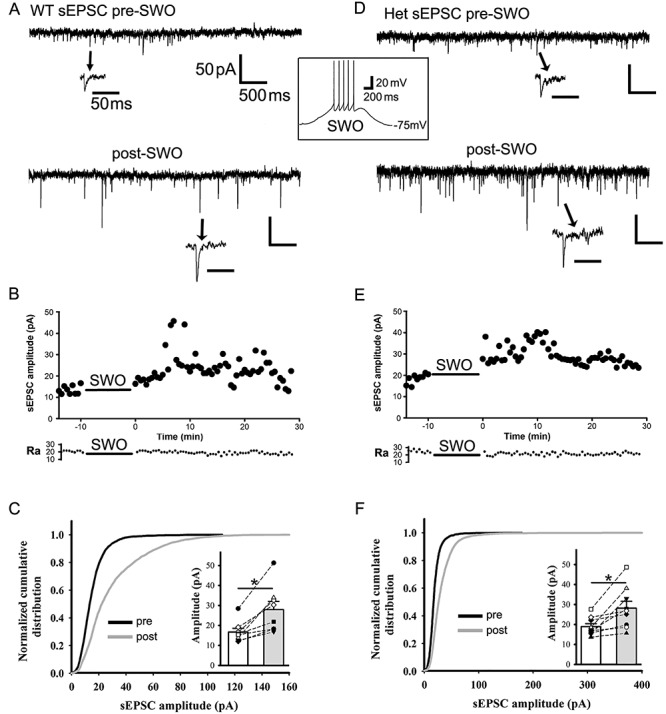
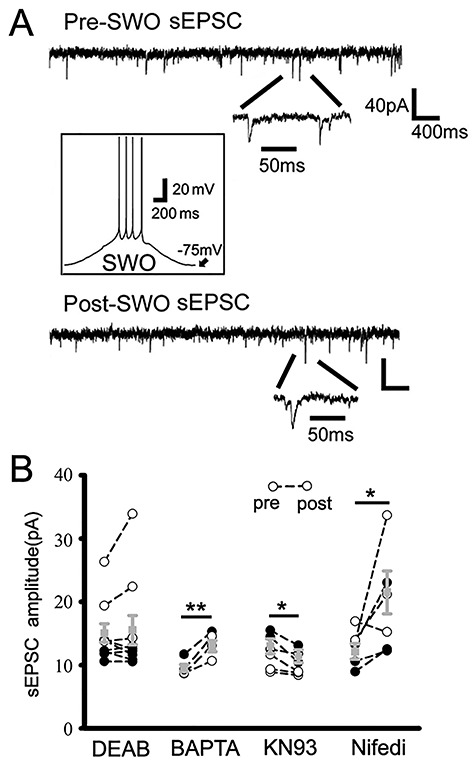
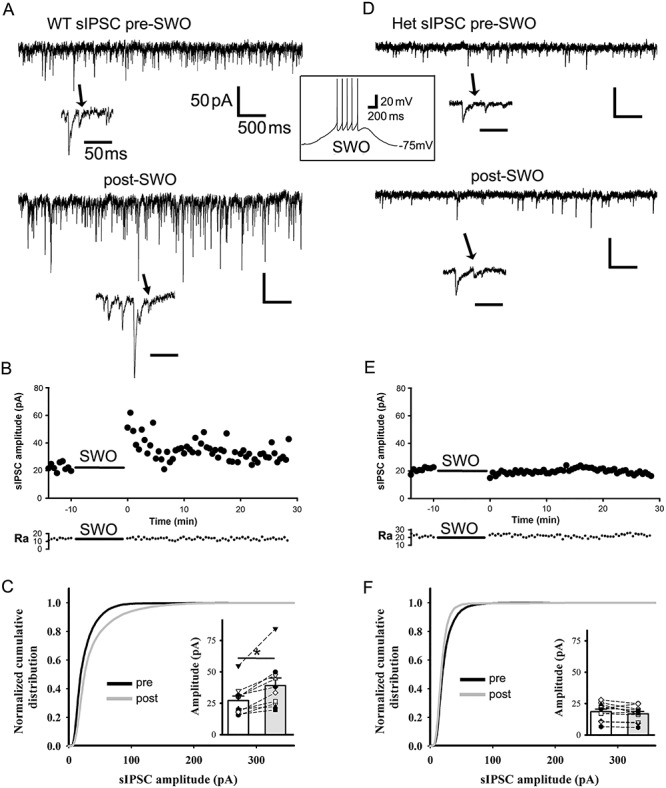
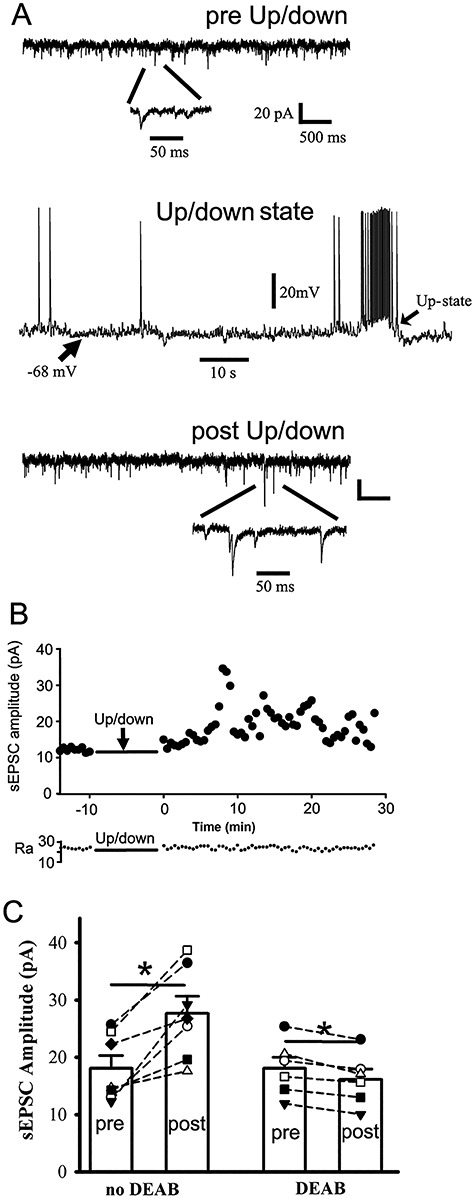
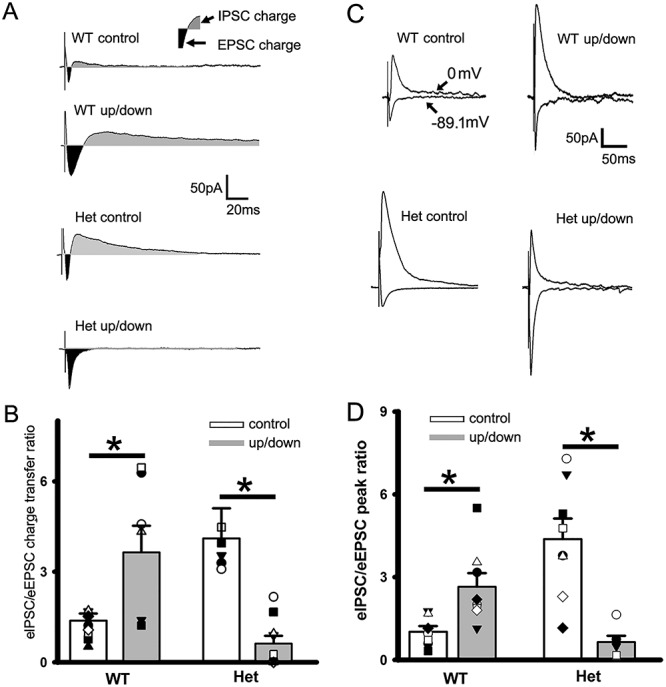
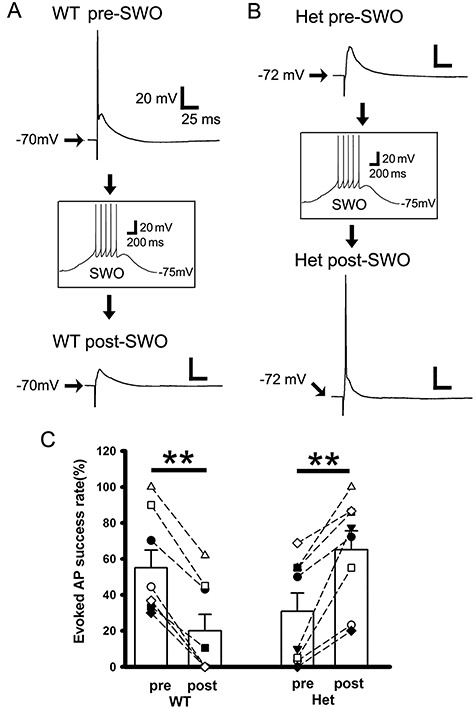
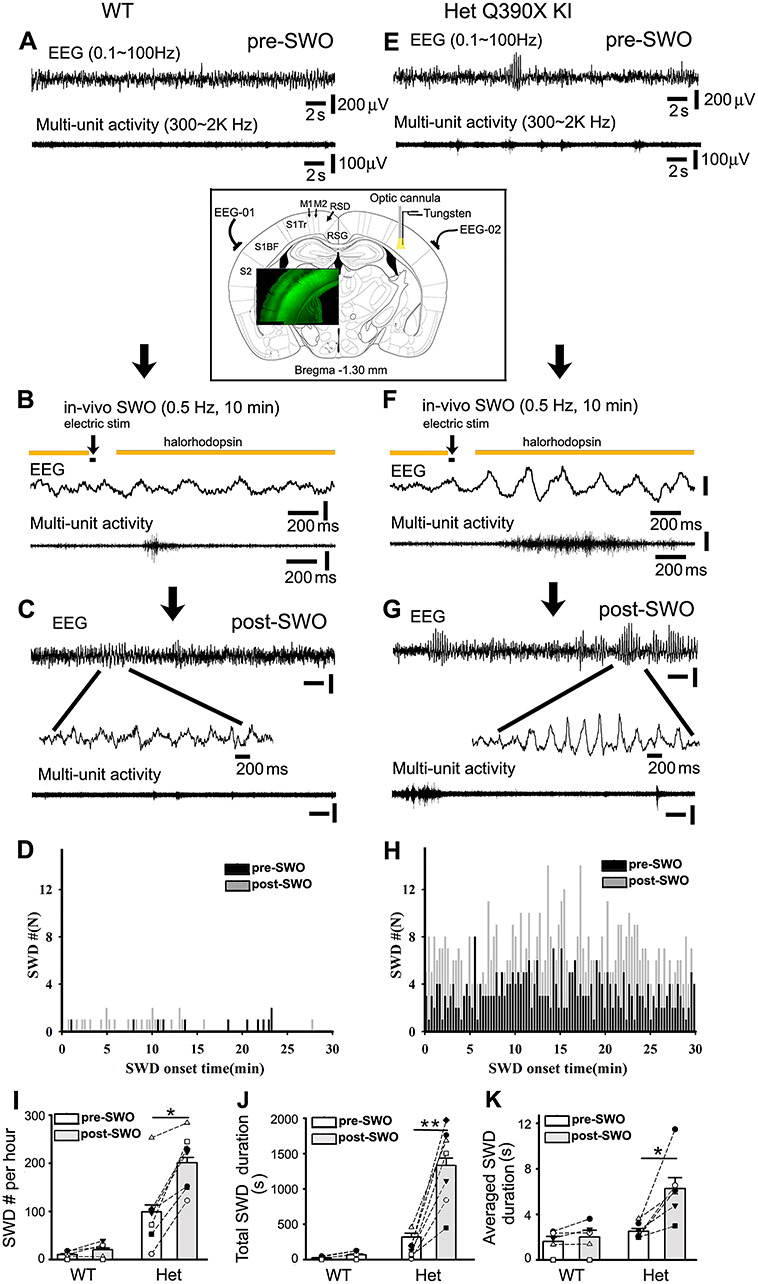
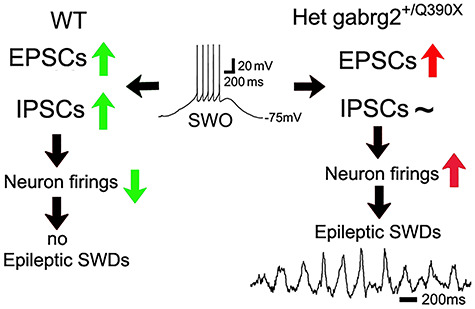
Epileptic activity in genetic generalized epilepsy (GGE) patients preferentially appears during sleep and its mechanism remains unknown. Here, we found that sleep-like slow-wave oscillations (0.5 Hz SWOs) potentiated excitatory and inhibitory synaptic currents in layer V cortical pyramidal neurons from wild-type (wt) mouse brain slices. In contrast, SWOs potentiated excitatory, but not inhibitory, currents in cortical neurons from a heterozygous (het) knock-in (KI) Gabrg2+Q/390X model of Dravet epilepsy syndrome. This created an imbalance between evoked excitatory and inhibitory currents to effectively prompt neuronal action potential firings. Similarly, physiologically similar up-/down-state induction (present during slow-wave sleep) in cortical neurons also potentiated excitatory synaptic currents within brain slices from wt and het KI mice. Moreover, this state-dependent potentiation of excitatory synaptic currents entailed some signaling pathways of homeostatic synaptic plasticity. Consequently, in het KI mice, in vivo SWO induction (using optogenetic methods) triggered generalized epileptic spike-wave discharges (SWDs), being accompanied by sudden immobility, facial myoclonus, and vibrissa twitching. In contrast, in wt littermates, SWO induction did not cause epileptic SWDs and motor behaviors. To our knowledge, this is the first mechanism to explain why epileptic SWDs preferentially happen during non rapid eye-movement sleep and quiet-wakefulness in human GGE patients.

Keywords: genetic generalized epilepsy; homeostatic synaptic plasticity; inhibitory synaptic currents; seizure onset; slow-wave oscillation.


Figures

Figure 1
Figure 1
SWO induction potentiates sEPSCs in layer V cortical pyramidal neurons from wt and het Gabrg2+/Q390X KI mice. Panels A and D are representative traces pre-SWO (top) and post-SWO sEPSCs (lower) for wt littermates (left column) and het KI mice (right column). The arrows point to individual sEPSC events in expanded time scales. The middle inset is one representative SWO induction trace from rest membrane potentials (−75 mV). Scale bars are indicated as labeled. Panels B and E show time courses of pre-SWO and post-SWO sEPSC amplitudes for corresponding recordings from panels A (wt) and D (het). Each data point in the panels B/E was obtained by averaging all sEPSC events during continuous 30 s recordings. The lower panels of access resistance (Ra) show their accompanied values during the whole 42.5 min recordings. Panels C and F show normalized cumulative histogram of sEPSC events for wt and het KI mice. Insets are summary data of pre-SWO and post-SWO sEPSC values (wt n = 8 neurons, n = 5 mice, paired t-test P = 0.004; het n = 9 neurons, n = 6 het KI mice, paired t-test P = 0.009) (wt cumulative curves used 4905 synaptic events for pre-SWO[during 4.2 min baseline recordings for each neuron, total n = 8 neurons] and 4506 synaptic events for post-SWO [during final 4.2 min recordings for each neurons, total n = 8 neurons], while het cumulative curves used 3886 synaptic events for pre-SWO [during 4.2 min baseline recordings for each neuron, total n = 9 neurons] and 9519 synaptic events for post-SWO [during final 4.2 min recordings for each neuron, total n = 9 neurons]). Each data point for inset graphs was obtained by averaging sEPSC events during baseline or post-SWO last 4.2 min recordings.
Figure 2
Figure 2
Pharmacology of SWO-induced potentiation of sEPSCs in cortical neurons. Panel A shows representative traces for pre-(top) and post-SWO sEPSCs (bottom) in cortical neurons for DEAB treatment group. Individual sEPSC events are expanded to show their rising and decaying phases. The inset shows SWO induction trace from resting membrane potential −75 mV. Scale bars are indicated as labeled. Panel B shows summary data for pre-SWO and post-SWO sEPSCs with DEAB treatment (40 μM, n = 10 cells, n = 4 mice, paired t-test P = 0.632), BAPAT-AM (15 μM, n = 5 cells, n = 3 mice, paired t-test P = 0.006), KN93 (2 μM, n = 7 cells, n = 3 mice, paired t-test P = 0.013) and nifedipine (20 μM, n = 7 cells, n = 4 mice, paired t-test P = 0.044).
Figure 3
Figure 3
SWO induction potentiates sIPSCs in layer V cortical pyramidal neurons from wt, but not from het Gabrg2+/Q390X KI mice. Panels A and D are representative traces pre-SWO (top) and post-SWO sIPSCs (lower) for wt littermates (left column) and het KI mice (right column). The arrows indicate individual sIPSC events in expanded time scales. The middle inset is one representative SWO induction trace from resting membrane potentials (−75 mV). Scale bars are indicated as labeled. Panels B and E show time courses of pre-SWO and post-SWO sIPSC amplitudes for corresponding recordings from panel A (wt) and D (het). Each data point in the panels B/E was obtained by averaging all sIPSC events during continuous 30 s recordings. The low panels of access resistance (Ra) show their values during the whole 42.5 min recordings. Panels C and F show normalized cumulative histogram of sIPSC events for wt and het KI mice. Insets are summary data of pre-SWO and post-SWO sIPSC values (wt n = 10 neurons, n = 8 mice, paired t-test P = 0.001; het n = 11 neurons, n = 7 het KI mice, paired t-test P = 0.1076) (wt cumulative curves used 6293 synaptic events for pre-SWO [during 4.2 min baseline recordings for each neurons, total n = 10 neurons] and 14 299 events for post-SWO [during final 4.2 min recordings for each neuron, total n = 10 neurons], while het cumulative curves used 7124 synaptic events for pre-SWO [during 4.2 min baseline recordings for each neurons, total n = 11 neurons] and 6290 synaptic events for post-SWO[during final 4.2 min recordings for each neurons, total n = 11 neurons]). Each data point for inset graphs was obtained by averaging sIPSC events during baseline or post-SWO last 4.2 min recordings.
Figure 4
Figure 4
Physiologically similar up-/down-state induction potentiates sEPSCs in cortical neurons from wt and het Gabrg2+/Q390X KI mice. Panel A (top and bottom) shows representative traces for pre/post-up/down sEPSCs in cortical neurons. Below are expanded sEPSC events. Panel A (middle) shows one representative up-/down-state induced by using fast flow perfusion (6–7 mL/min) with a modified ACSF ([mM] 3.5 or 5 KCl, 1 Ca2+, 1 Mg2+ and 3.5 μM carbachol). Scale bars are indicated as labeled. Panel B shows time courses of pre/post-up-/down-state sEPSC amplitudes for corresponding recordings from panel A. Each data point in these panels B was obtained by averaging all sIPSC events during continuous 30 s recordings. The panel B (lower part) shows access resistance (Ra) values during the whole 42.5 min recordings. Panel C shows summary data of pre-/postup-/down-state sEPSCs (n = 7 neurons, n = 7 mice, paired t-test P = 0.003) and DEAB blockade effect (n = 6 neurons, n = 6 mice, paired t-test P = 0.003) (each data point for panel C was obtained by averaging sEPSC events during baseline or postup-/down-state last 4.2 min recordings).
Figure 5
Figure 5
Balanced eIPSCs/eEPSCs following up-/down-state induction in cortical neurons from wt mice, while imbalanced eIPSCs/eEPSCs from het Gabrg2+/Q390X KI mice. (A) Representative traces of paired eEPSCs and eIPSCs in neurons (clamped at −40 mV) from wt control and wt up/down, het control and het up/down groups. The dark areas between inward current traces and baselines represent the excitatory current charges and the gray areas between outward current traces and baselines represent the inhibitory current charges. Stimulus artifacts are shown right before eEPSCs. Scale-bars are indicated as labeled. (B) Summarized data for these groups regarding eIPSC/eEPSC ratios (wt control n = 11, n = 3 mice and wt up/down n = 7 cells, n = 3 mice, t-test P = 0.0113; het control n = 7 cells, n = 3 mice and het up/down n = 10, n = 3 mice, t-test P = 0.0119). Vertical box and bars are averaged summary data (* mean significant difference). (C) Representative traces of paired eEPSCs (holding at −89.1 mV) and eIPSCs (holding at 0 mV) in neurons from wt control and wt up/down, het control and het up/down groups. Stimulus artifacts are shown right before eEPSCs and eIPSCs. Scale-bars are indicated as labeled. (D) Summarized data for these groups regarding eIPSC/eEPSC peak ratios for wt control (n = 7 cells) versus wt up/down (n = 8 cells) (n = 2 mice each, t-test P = 0.012) and for het control (n = 8 cells) versus het up/down (n = 6 cells) (n = 2 mice each, t-test P = 0.0012).
Figure 6
Figure 6
Impaired sIPSC potentiation following SWOs prompts neurons to more successfully generate APs from het Gabrg2+/Q390X KI mice. Panels A and B are representative traces of pre-SWO (top) and post-SWO (lower) evoked APs or EPSPs in neurons from wt littermate mice (panel A) and het KI mice (panel B). Top (A or B) and lower panels (A or B) are two individual traces from the same neurons being recorded with successfully evoked APs or postsynaptic potentials. The middle insets (A or B) show one SWO induction from rest membrane potentials (−75 mV). Scale bars are indicated as labeled. Panel C shows summary data for the success rate of evoked APs in wt littermate (n = 8 cells, n = 5 mice, paired t-test P = 0.005) and het KI mice (n = 8 cells, n = 4 mice, paired t-test P = 0.001). Each pair of pre- and post-SWO dots being connected with a line corresponds to the same neuronal pre- and post-SWO AP success rates. Vertical box and bars are averaged summary data (mean ± SEM).
Figure 7
Figure 7
In vivo induction of SWOs or up-/down-states triggers epileptic SWDs in het Gabrg2+/Q390X KI mice. Panels A (wt) and E (het) are representative traces for simultaneous pre-SWO EEG (top) and multiunit (below) recordings (30 s long). Panels B (wt) and F (het) show the time course of in vivo SWO or up-/down-state induction with yellow color indicating laser delivery, and black bar for intracortical stimulation (20 ms). Below are representative traces (2 s long) for simultaneous EEG/multiunit activity during in vivo SWO induction. Panels C (wt) and G (het) show representative traces for simultaneous post-SWO EEG (top) and multiunit (below) recordings. Below are expanded short episode EEG recordings (wt) or epileptic SWDs (het). Scale bars (panels A, C, E, and G) are similarly indicated as labeled except time-scale bars in panels B and F. The downward arrows indicate experiment sequential steps. Panels D (wt) and H (het) show graphs of pre- (black) and post-SWO (gray) epileptic SWD onset time distribution (cumulative data from all wt n = 6 mice or het mice n = 7 mice). SWD events in these two panels were obtained during 30 min right before and after in vivo SWO induction. Panels I–K show summary data for SWD # per h, total SWD duration and averaged single SWD duration for pre-SWO (blank bars) and post-SWO (gray bars) (het KI mice n = 7 each, SWD #/h, paired t-test P = 0.001; total SWD duration/h, paired t-test P = 0.0008; averaged single SWD duration, paired t-test P = 0.005) (wt mice n = 6 each, SWD #/h, paired t-test P = 0.104; total SWD duration/h, paired t-test P = 0.088; averaged single SWD duration, paired t-test P = 0.165). The insert panel shows the implantation of two epidural EEG-electrodes above S1 cortex and one optic cannula/one bipolar tungsten electrode in the S1 cortex (Bregma −1.30 mm, between Figures 41 and 42, The Mouse Brain in Stereotaxic Coordinates, compact 3rd edition by Franklin and Paxinos (2008). The grounding EEG electrode was implanted above cerebellum surface (not shown here). Green fluorescence imaging (overlay insert) shows Thy1-halorhodopsin expression in the cortex (layer 2/3 and 5/6). Labels S1, M1, and RSD/RSG indicate primary somatosensory cortex, motor cortex, and retrosplenial cortex, respectively.
Figure 8
Figure 8
Summary diagram shows that SWO-induced homeostatic scaling-up/potentiation of excitatory synaptic currents in cortical neurons triggers epileptic SWDs in het KI mice. Green up-arrows represent balanced potentiated EPSCs and IPSCs. Green down-arrow represents decreased AP firings. Red up-arrows represent unbalanced potentiated EPSCs or increased neuron firings, respectively. Tilde symbol represents no change of IPSCs. Black arrows represent the sequential directions of causal interaction. Inset is one representative SWO traces with necessary labels. All other labels are self-explanatory.

Comment in

References

    1. Adesnik H, Scanziani M. 2010. Lateral competition for cortical space by layer-specific horizontal circuits. Nature. 464:1155–U1171. - PMC - PubMed
    1. Ahmed OJ, Vijayan S. 2014. The roles of sleep-wake states and brain rhythms in epileptic seizure onset. J Neurosci. 34:7395–7397. - PMC - PubMed
    1. Allen AS, Berkovic SF, Cossette P, Delanty N, Dlugos D, Eichler EE, Epstein MP, Glauser T, Goldstein DB, Han Yet al. . 2013. De novo mutations in epileptic encephalopathies. Nature. 501:217–221. - PMC - PubMed
    1. Aoto J, Nam CI, Poon MM, Ting P, Chen L. 2008. Synaptic signaling by all-trans retinoic acid in homeostatic synaptic plasticity. Neuron. 60:308–320. - PMC - PubMed
    1. Arain F, Zhou C, Ding L, Zaidi S, Gallagher MJ. 2015. The developmental evolution of the seizure phenotype and cortical inhibition in mouse models of juvenile myoclonic epilepsy. Neurobiol Dis. 82:164–175. - PMC - PubMed

Publication types

MeSH terms