

Standard-space atlas of the viscoelastic properties of the human brain
- PMID: 32931076
- PMCID: PMC7670638
- DOI: 10.1002/hbm.25192
Standard-space atlas of the viscoelastic properties of the human brain
Abstract
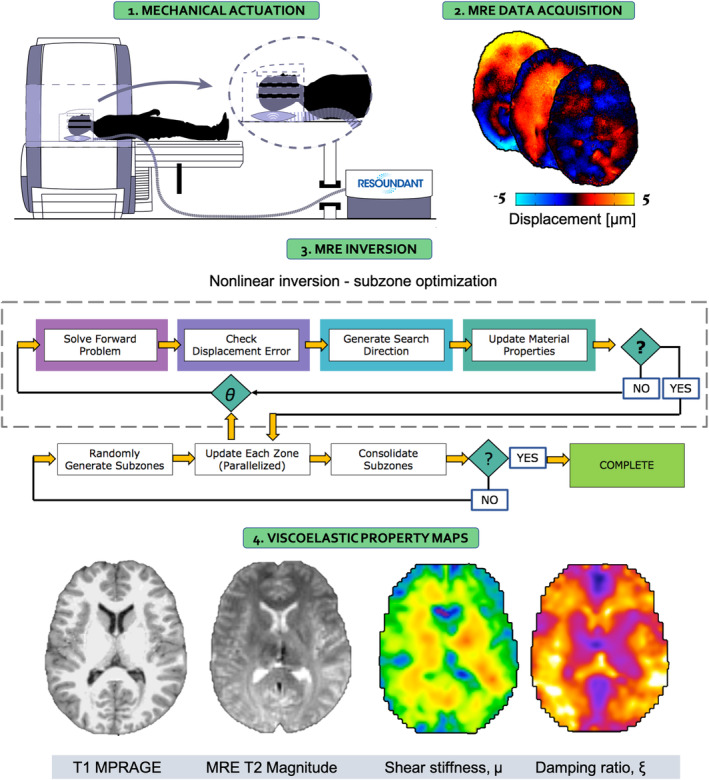
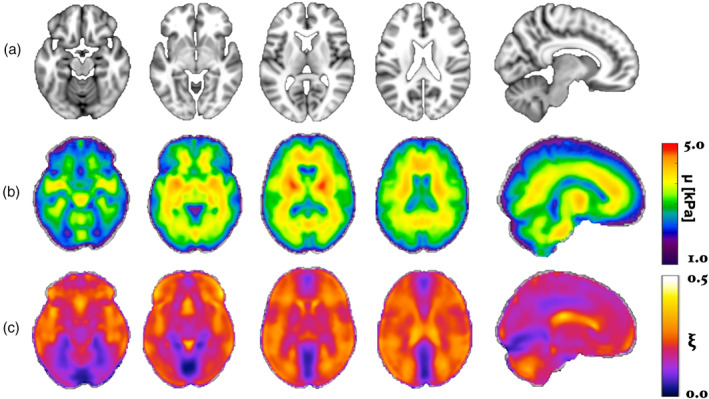
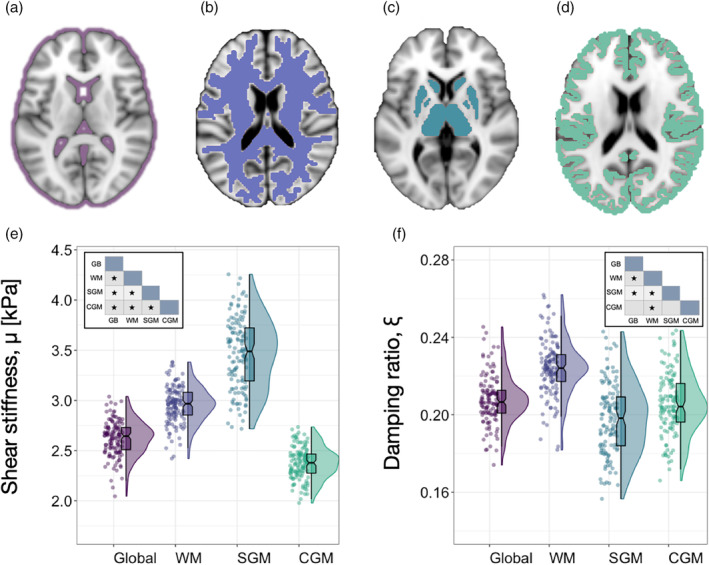
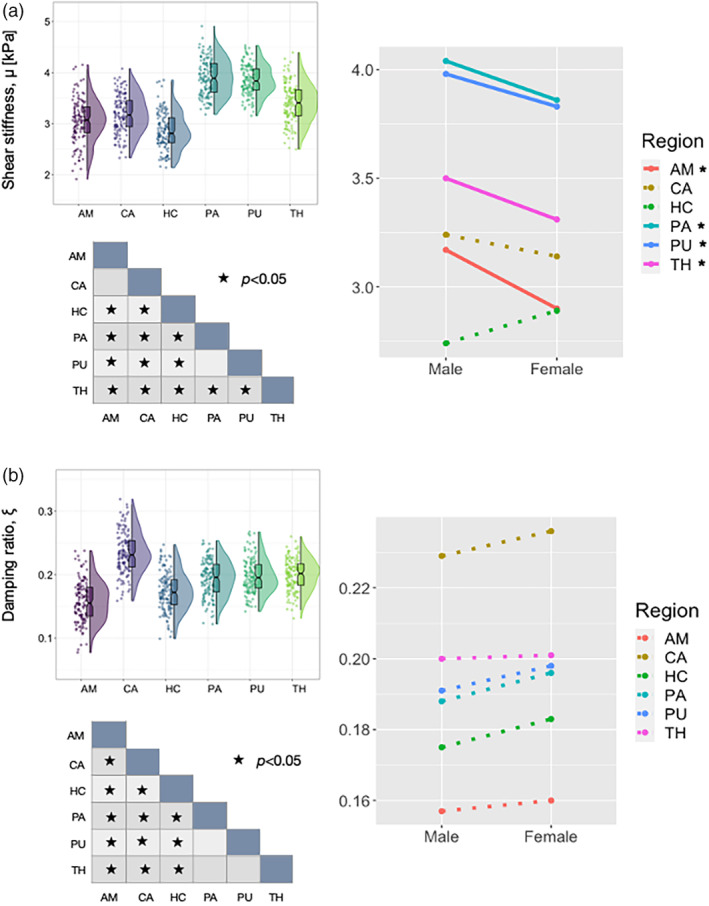
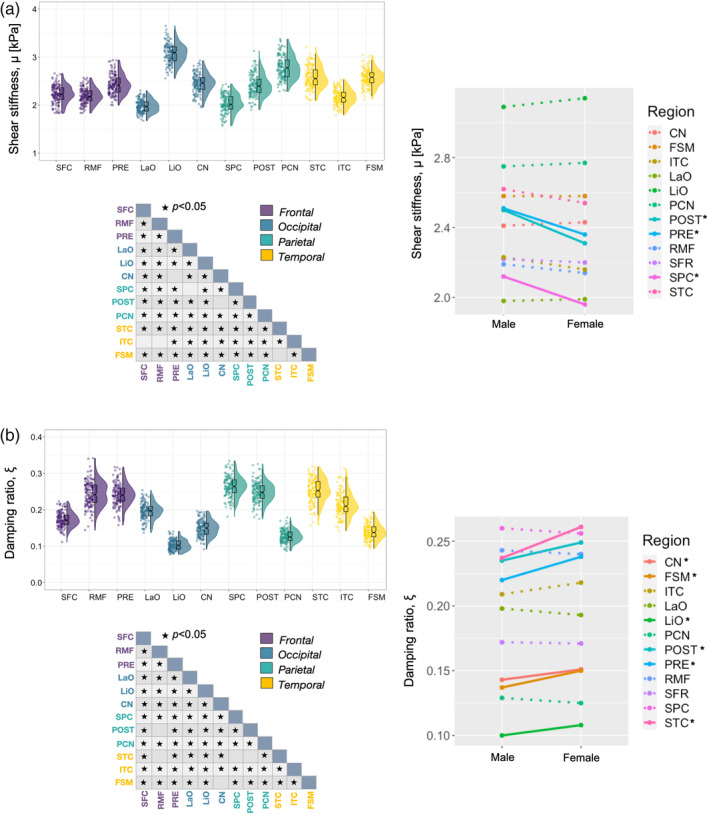
Standard anatomical atlases are common in neuroimaging because they facilitate data analyses and comparisons across subjects and studies. The purpose of this study was to develop a standardized human brain atlas based on the physical mechanical properties (i.e., tissue viscoelasticity) of brain tissue using magnetic resonance elastography (MRE). MRE is a phase contrast-based MRI method that quantifies tissue viscoelasticity noninvasively and in vivo thus providing a macroscopic representation of the microstructural constituents of soft biological tissue. The development of standardized brain MRE atlases are therefore beneficial for comparing neural tissue integrity across populations. Data from a large number of healthy, young adults from multiple studies collected using common MRE acquisition and analysis protocols were assembled (N = 134; 78F/ 56 M; 18-35 years). Nonlinear image registration methods were applied to normalize viscoelastic property maps (shear stiffness, μ, and damping ratio, ξ) to the MNI152 standard structural template within the spatial coordinates of the ICBM-152. We find that average MRE brain templates contain emerging and symmetrized anatomical detail. Leveraging the substantial amount of data assembled, we illustrate that subcortical gray matter structures, white matter tracts, and regions of the cerebral cortex exhibit differing mechanical characteristics. Moreover, we report sex differences in viscoelasticity for specific neuroanatomical structures, which has implications for understanding patterns of individual differences in health and disease. These atlases provide reference values for clinical investigations as well as novel biophysical signatures of neuroanatomy. The templates are made openly available (github.com/mechneurolab/mre134) to foster collaboration across research institutions and to support robust cross-center comparisons.
Keywords: MRI templates; brain atlases; magnetic resonance elastography; magnetic resonance imaging; mechanical properties; viscoelasticity.
© 2020 The Authors. Human Brain Mapping published by Wiley Periodicals LLC.
Conflict of interest statement
The authors have no actual or potential conflict of interest.
Figures

Similar articles
-
High-resolution magnetic resonance elastography reveals differences in subcortical gray matter viscoelasticity between young and healthy older adults.Neurobiol Aging. 2018 May;65:158-167. doi: 10.1016/j.neurobiolaging.2018.01.010. Epub 2018 Feb 6. Neurobiol Aging. 2018. PMID: 29494862 Free PMC article.
-
Viscoelasticity of subcortical gray matter structures.Hum Brain Mapp. 2016 Dec;37(12):4221-4233. doi: 10.1002/hbm.23314. Epub 2016 Jul 12. Hum Brain Mapp. 2016. PMID: 27401228 Free PMC article.
-
Mapping brain mechanical property maturation from childhood to adulthood.Neuroimage. 2022 Nov;263:119590. doi: 10.1016/j.neuroimage.2022.119590. Epub 2022 Aug 24. Neuroimage. 2022. PMID: 36030061 Free PMC article.
-
Magnetic resonance elastography in a nutshell: Tomographic imaging of soft tissue viscoelasticity for detecting and staging disease with a focus on inflammation.Prog Nucl Magn Reson Spectrosc. 2024 Nov-Dec;144-145:1-14. doi: 10.1016/j.pnmrs.2024.05.002. Epub 2024 May 29. Prog Nucl Magn Reson Spectrosc. 2024. PMID: 39645347 Review.
-
Magnetic resonance elastography for examining developmental changes in the mechanical properties of the brain.Dev Cogn Neurosci. 2018 Oct;33:176-181. doi: 10.1016/j.dcn.2017.08.010. Epub 2017 Sep 1. Dev Cogn Neurosci. 2018. PMID: 29239832 Free PMC article. Review.
Cited by
-
Rheological properties of porcine organs: measurements and fractional viscoelastic model.Front Bioeng Biotechnol. 2024 Aug 1;12:1386955. doi: 10.3389/fbioe.2024.1386955. eCollection 2024. Front Bioeng Biotechnol. 2024. PMID: 39148944 Free PMC article.
-
Design, Construction, and Implementation of a Magnetic Resonance Elastography Actuator for Research Purposes.Curr Protoc. 2022 Mar;2(3):e379. doi: 10.1002/cpz1.379. Curr Protoc. 2022. PMID: 35286023 Free PMC article.
-
Cerebral vascular strains in dynamic head impact using an upgraded model with brain material property heterogeneity.J Mech Behav Biomed Mater. 2022 Feb;126:104967. doi: 10.1016/j.jmbbm.2021.104967. Epub 2021 Nov 18. J Mech Behav Biomed Mater. 2022. PMID: 34863650 Free PMC article.
-
Biomechanical Effects of Seizures on Cerebral Dynamics and Brain Stress.Brain Sci. 2024 Mar 27;14(4):323. doi: 10.3390/brainsci14040323. Brain Sci. 2024. PMID: 38671975 Free PMC article.
-
Calibration of a Heterogeneous Brain Model Using a Subject-Specific Inverse Finite Element Approach.Front Bioeng Biotechnol. 2021 May 4;9:664268. doi: 10.3389/fbioe.2021.664268. eCollection 2021. Front Bioeng Biotechnol. 2021. PMID: 34017826 Free PMC article.
References
-
- Arani, A. , Min, H.‐K. , Fattahi, N. , Wetjen, N. M. , Trzasko, J. D. , Manduca, A. , … Huston, J., 3rd . (2018). Acute pressure changes in the brain are correlated with MR elastography stiffness measurements: Initial feasibility in an in vivo large animal model. Magnetic Resonance in Medicine, 79, 1043–1051. 10.1002/mrm.26738 - DOI - PMC - PubMed
-
- Barbey, A. K. , Belli, A. , Logan, A. , Rubin, R. , Zamroziewicz, M. , & Operskalski, J. T. (2015). Network topology and dynamics in traumatic brain injury. Current Opinion in Behavioral Sciences, 4, 92–102. 10.1016/j.cobeha.2015.04.002 - DOI
Publication types
MeSH terms
Grants and funding
LinkOut - more resources
Full Text Sources
Medical
Research Materials
