. 2020 Sep 15;12(17):17353-17366.
doi: 10.18632/aging.103730. Epub 2020 Sep 15.

Taurine suppresses ROS-dependent autophagy via activating Akt/mTOR signaling pathway in calcium oxalate crystals-induced renal tubular epithelial cell injury

Affiliations

Taurine suppresses ROS-dependent autophagy via activating Akt/mTOR signaling pathway in calcium oxalate crystals-induced renal tubular epithelial cell injury

Yan Sun et al. Aging (Albany NY). .

Erratum in

Abstract

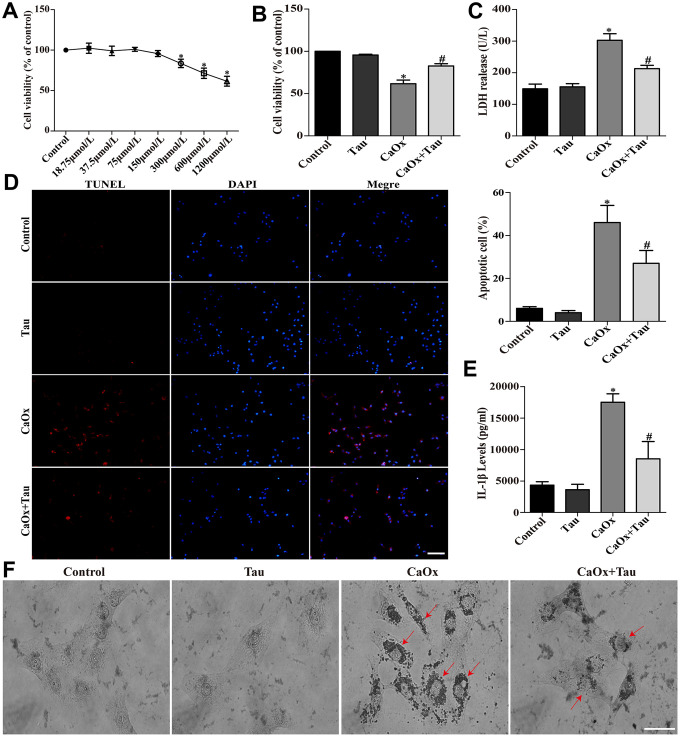
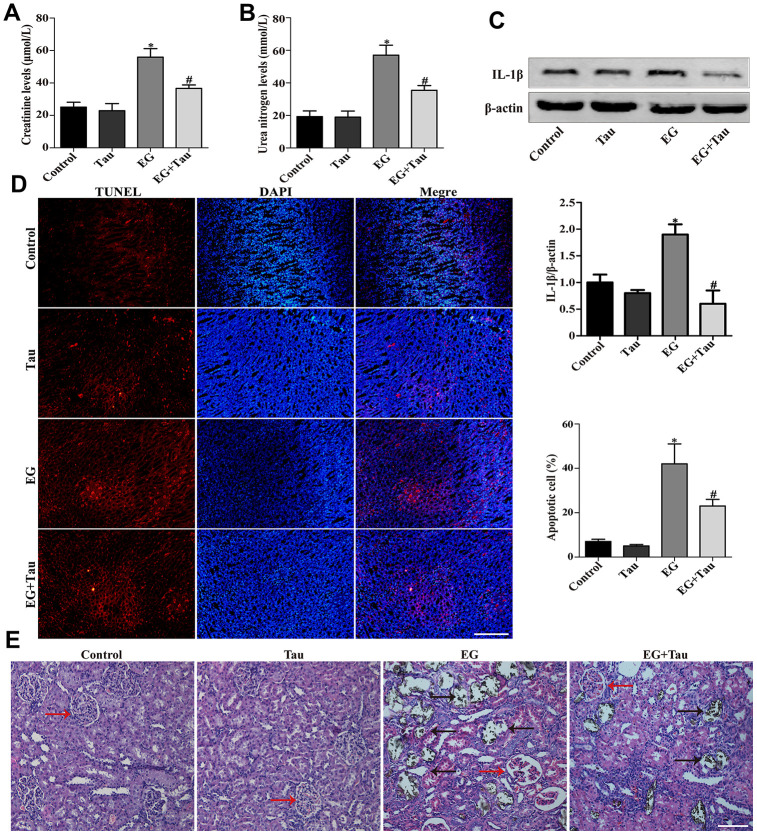
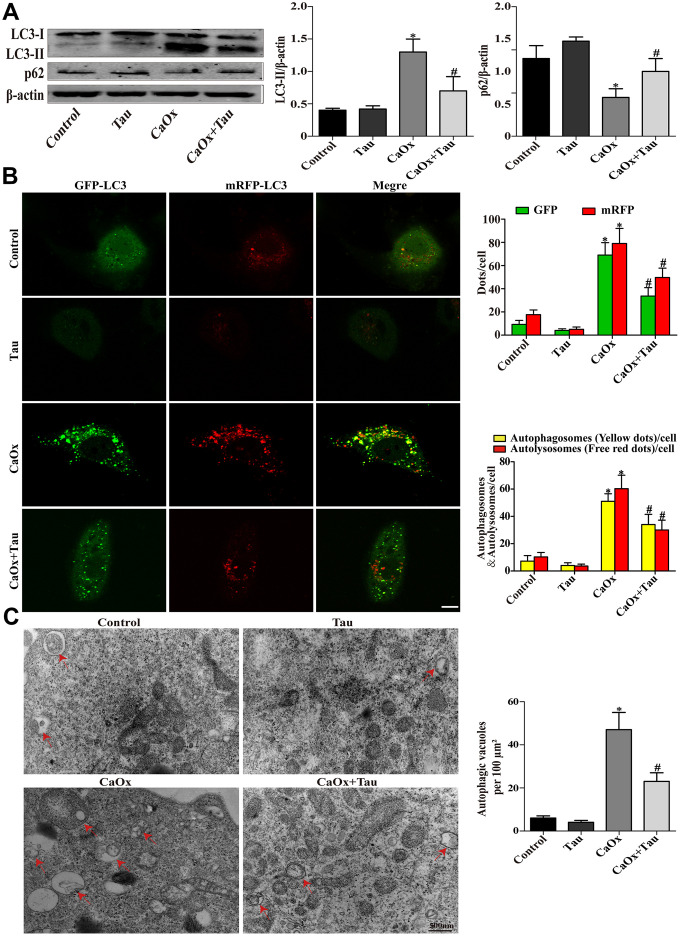
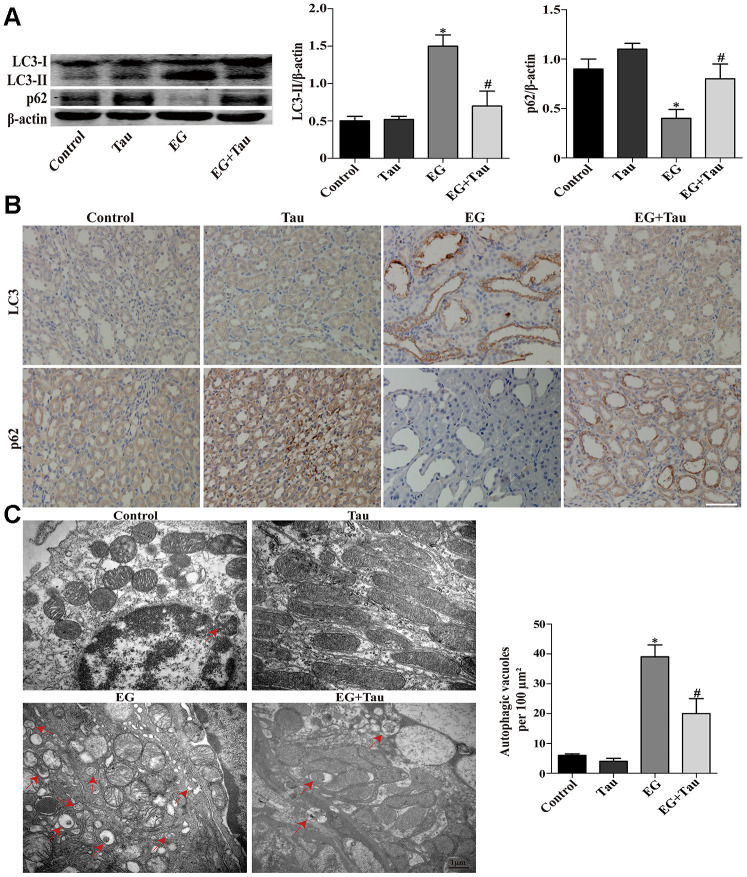
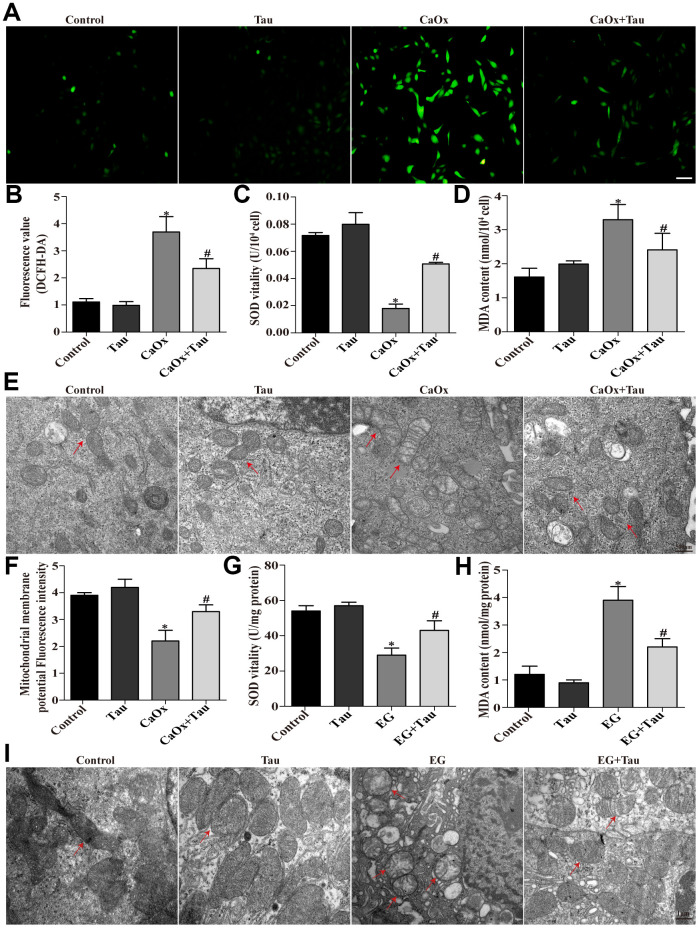
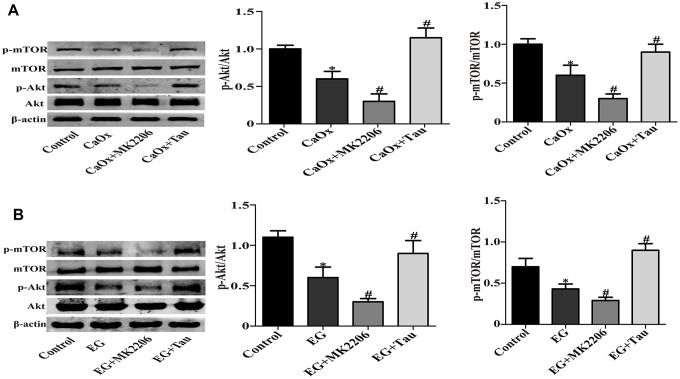
Oxidative stress and autophagy are the key promoters of calcium oxalate (CaOx) nephrolithiasis. Taurine is an antioxidant that plays a protective role in the pathogenesis of kidney disease. Previous studies found that taurine suppressed cellular oxidative stress, and inhibited autophagy activation. However, the effect of taurine on CaOx kidney stone formation remains unknown. In the present work, we explored the regulatory effects of taurine on CaOx crystals-induced HK-2 cell injury. Results showed that pretreatment with taurine significantly enhanced the viability of HK-2 cells and ameliorated kidney tissue injury induced by CaOx crystals. Taurine also markedly reduced the levels of inflammatory cytokines, apoptosis, and CaOx crystals deposition. Furthermore, we observed that taurine supplementation alleviated CaOx crystals-induced autophagy. Mechanism studies showed that taurine reduced oxidative stress via increasing SOD activity, reducing MDA concentration, alleviating mitochondrial oxidative injury, and decreasing the production of intracellular ROS. Taurine treatment also effectively activated Akt/mTOR signaling pathway in CaOx crystals-induced HK-2 cells both in vitro and in vivo. In summary, the current study shows that taurine inhibits ROS-dependent autophagy via activating Akt/mTOR signaling pathway in CaOx crystals-induced HK-2 cell and kidney injury, suggesting that taurine may serve as an effective therapeutic agent for the treatment of CaOx nephrolithiasis.

Keywords: autophagy; calcium oxalate crystals; reactive oxygen species; renal tubular epithelial cells; taurine.


Conflict of interest statement

CONFLICTS OF INTEREST: The authors declare that they have no conflicts of interest.

Figures

Figure 1
Figure 1
Tau ameliorated CaOx crystals-induced HK-2 cell injury. (A) Effect of Tau on the viability of HK-2 cells. (B) Effect of Tau on the viability of cells exposed to CaOx crystals. (C) The concentration of secreted LDH in cell supernatants. (D) The apoptosis of HK-2 cells was assessed using TUNEL assay; scale bar: 50 μm. (E) ELISA detection of IL-1β expression in culture supernatants. (F) Observation of the crystal adhesion on HK-2 cells under a light microscope. Red arrows indicate intracellular CaOx crystals; scale bar: 20 μm. Data are presented as the mean ± SD (n=3). *P < 0.05 versus the control group, #P < 0.05 versus the CaOx group.
Figure 2
Figure 2
Tau attenuates EG-induced renal damage and crystal deposition in rat kidneys. (A) Effect of Tau on the serum expression of creatinine after EG-induced renal injury. (B) Effect of Tau on urea nitrogen following EG-induced renal injury. (C) Representative immunoblot and quantification analysis of IL-1β expression. (D) Renal tissue apoptosis was assessed by TUNEL staining; scale bar: 200 μm. (E) Kidney injury and crystal deposition were determined using Von Kossa-staining. Red and black arrows indicate glomerulus and crystal deposition, respectively; scale bar: 200 μm. Data are presented as the mean ± SD (n=3).*P < 0.05 versus the control group, #P < 0.05 versus the EG group.
Figure 3
Figure 3
Effects of Tau on CaOx crystals-induced autophagy in cells. (A) The expressions of LC3-II and p62 were assessed by Western blot. (B) Fluorescence microscopy and quantitative analysis of cells transduced with Ad-mRFP-GFP-LC3. The green GFP dots and the red mRFP dots were used to label and track LC3. In the merged image, the yellow dots and the red dots indicate autophagosomes and autolysosomes, respectively; scale bar: 50 μm. (C) Detection of autophagic vacuoles by TEM in HK-2 cells. Red arrows: autophagic vacuoles; scale bar: 500 nm. Data are presented as the mean ± SD (n=3). *P < 0.05 versus the control group, #P < 0.05 versus the CaOx group.
Figure 4
Figure 4
Effects of Tau on EG-induced autophagic activity in rat kidneys. (A) The levels of LC3-II and p62 were examined by Western blot. (B) The expressions of LC3 and p62 in kidney tissues were detected by immunohistochemical staining; scale bar: 100 μm. (C) Detection of autophagic vacuoles in renal tissues by TEM. Red arrows: autophagic vacuoles; scale bar: 1 μm. Data are presented as the mean ± SD (n=3). *P < 0.05 versus the control group, #P < 0.05 versus the EG group.
Figure 5
Figure 5
Tau alleviates oxidative injury induced by CaOx crystals. (A) The ROS level in HK-2 cells after different treatments was examined using DCFH-DA; scale bar: 50 μm. (B) Quantitative analyses of DCFH-DA assay. (C and D) Effects of Tau on SOD and MDA levels in cells treated with CaOx crystals. (E) The ultrastructural morphology of the was detected by TEM. Red arrows: mitochondria; scale bar: 500 nm. (F) Mitochondrial membrane potential of all groups of cells. (G and H) Effects of Tau on SOD and MDA levels in EG-induced renal tissues. (I) The ultrastructural morphology of mitochondria in renal tissues was detected by TEM. Red arrows: mitochondria; scale bar: 1 μm. Data are presented as the mean±SD (n=3). *P < 0.05 versus the control group, #P < 0.05 versus the CaOx group or the EG group.
Figure 6
Figure 6
Tau activates Akt/mTOR signaling pathway. (A) The expressions of mTOR, P-mTOR, Akt, and P-Akt in vitro. (B) Representative immunoblot and quantification analysis of mTOR, Akt, P-mTOR, and P-Akt in vivo. Data are presented as the mean ± SD (n=3). *P < 0.05 versus the control group, #P < 0.05 versus the CaOx group or the EG group.

References

    1. Spivacow FR, Del Valle EE, Lores E, Rey PG. Kidney stones: composition, frequency and relation to metabolic diagnosis. Medicina (B Aires). 2016; 76:343–48. - PubMed
    1. Khan SR, Pearle MS, Robertson WG, Gambaro G, Canales BK, Doizi S, Traxer O, Tiselius HG. Kidney stones. Nat Rev Dis Primers. 2016; 2:16008. 10.1038/nrdp.2016.8 - DOI - PMC - PubMed
    1. Chung HJ. The role of randall plaques on kidney stone formation. Transl Androl Urol. 2014; 3:251–54. 10.3978/j.issn.2223-4683.2014.07.03 - DOI - PMC - PubMed
    1. Tsujihata M. Mechanism of calcium oxalate renal stone formation and renal tubular cell injury. Int J Urol. 2008; 15:115–20. 10.1111/j.1442-2042.2007.01953.x - DOI - PubMed
    1. Khan SR. Reactive oxygen species as the molecular modulators of calcium oxalate kidney stone formation: evidence from clinical and experimental investigations. J Urol. 2013; 189:803–11. 10.1016/j.juro.2012.05.078 - DOI - PMC - PubMed