. 2021 Jan 4;131(1):e137186.
doi: 10.1172/JCI137186.

A protumorigenic secretory pathway activated by p53 deficiency in lung adenocarcinoma

Affiliations

A protumorigenic secretory pathway activated by p53 deficiency in lung adenocarcinoma

Xiaochao Tan et al. J Clin Invest. .

Abstract

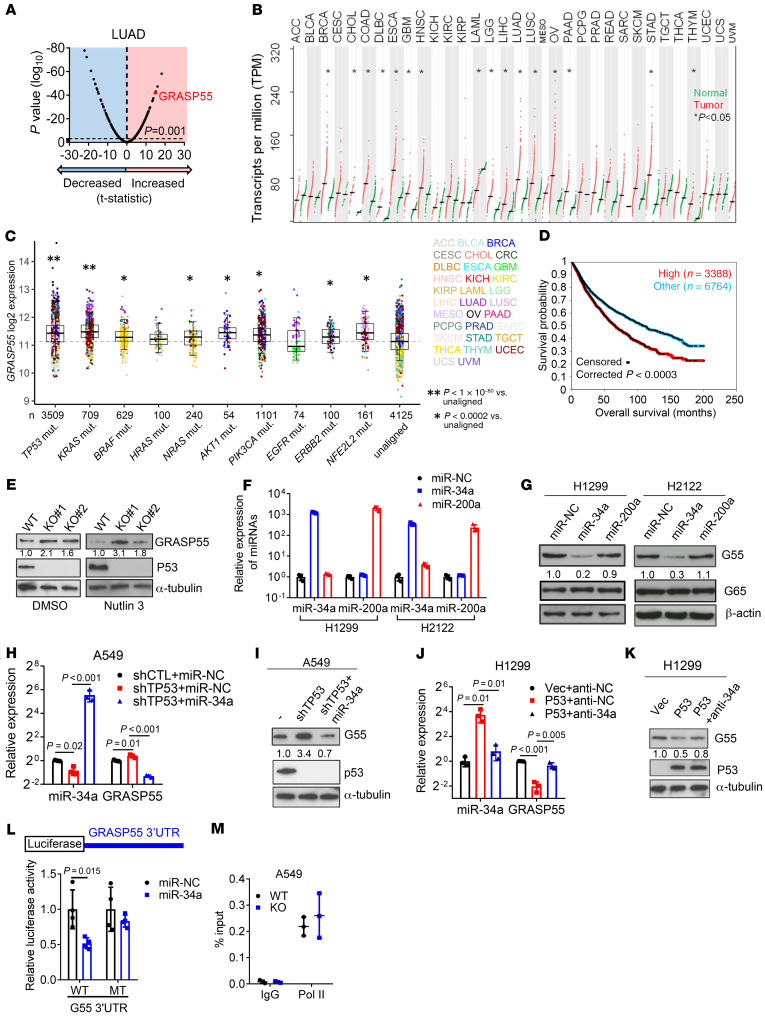
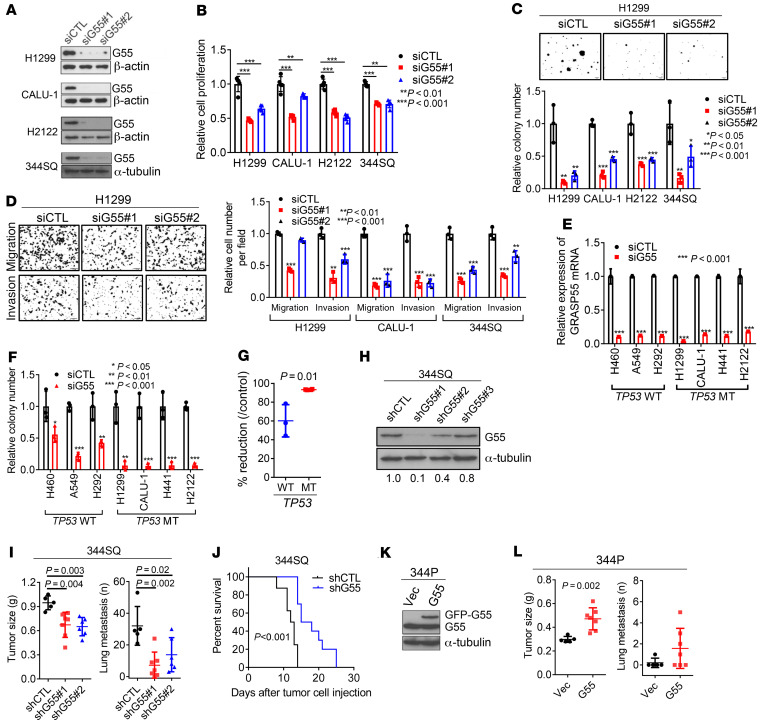
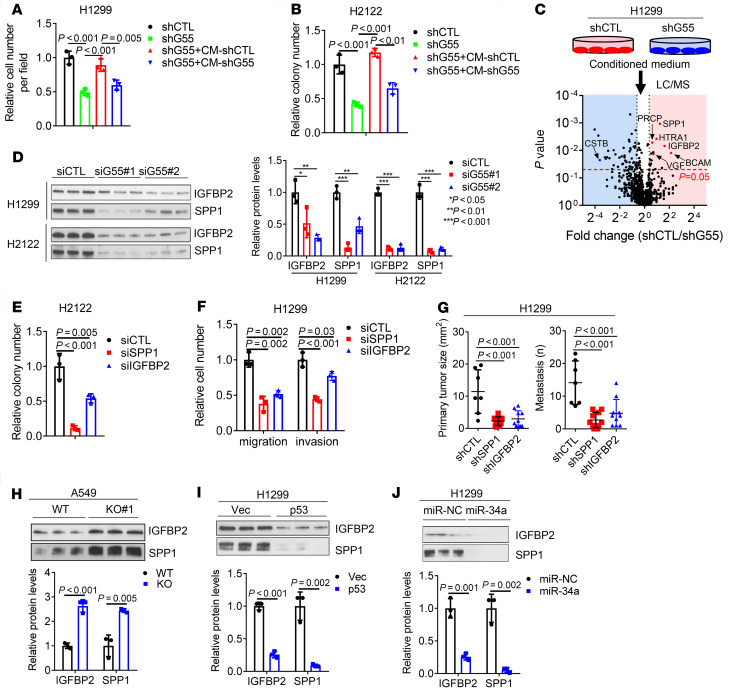
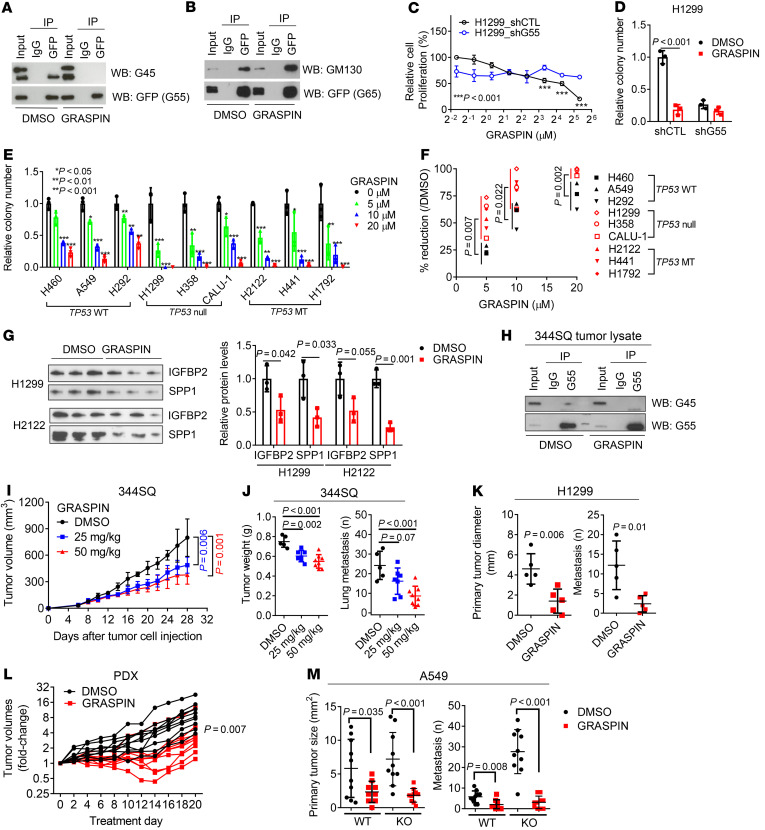
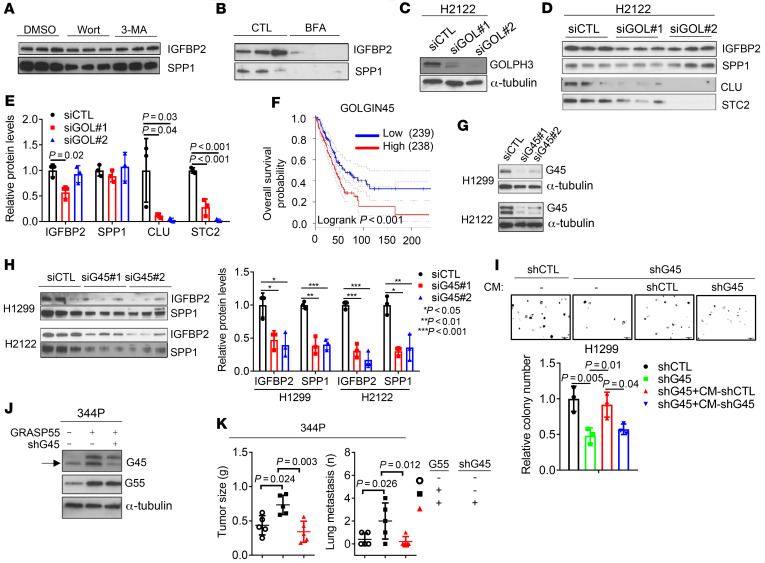
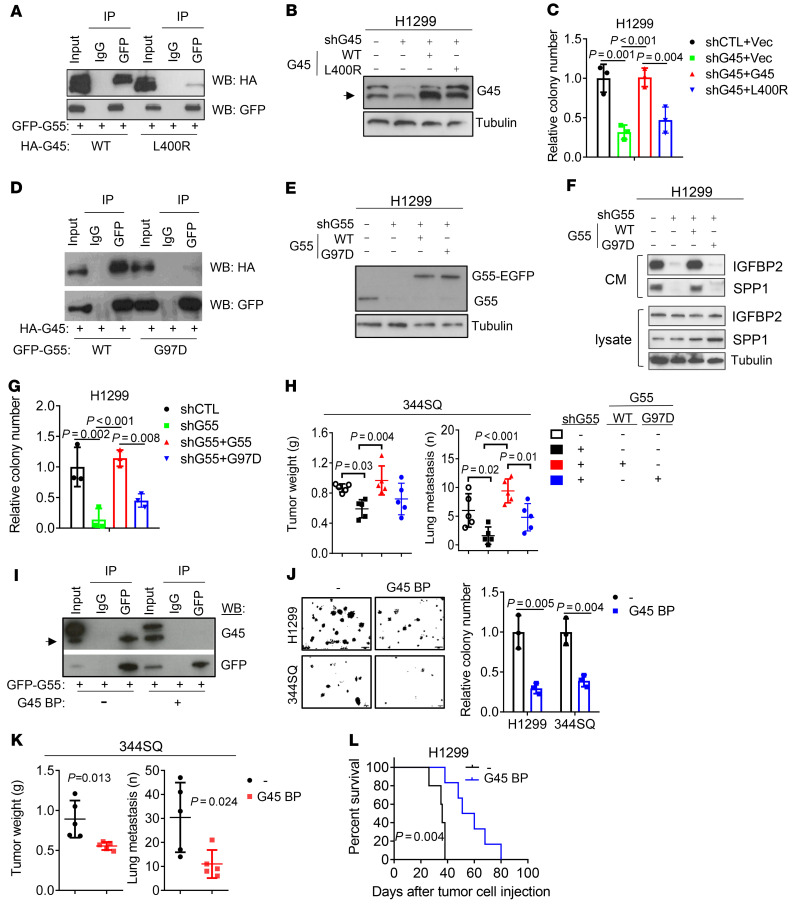
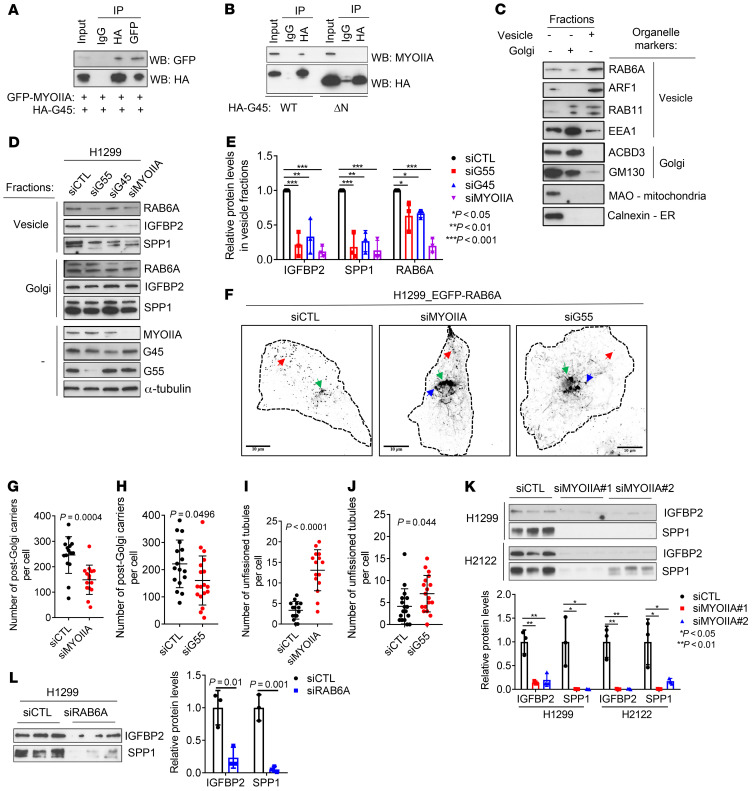
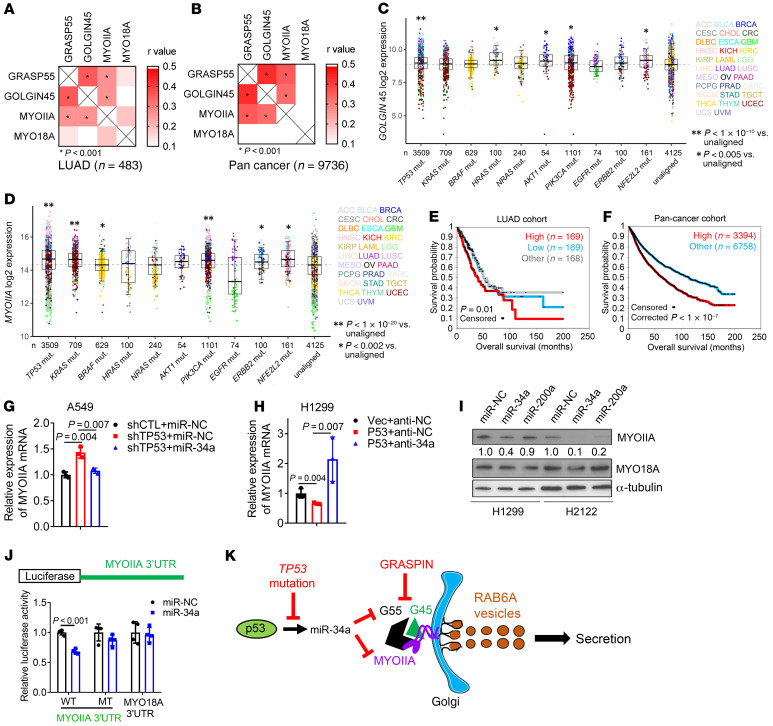
Therapeutic strategies designed to target TP53-deficient cancer cells remain elusive. Here, we showed that TP53 loss initiated a pharmacologically actionable secretory process that drove lung adenocarcinoma (LUAD) progression. Molecular, biochemical, and cell biological studies showed that TP53 loss increased the expression of Golgi reassembly and stacking protein 55 kDa (G55), a Golgi stacking protein that maintains Golgi organelle integrity and is part of a GOLGIN45 (G45)-myosin IIA-containing protein complex that activates secretory vesicle biogenesis in the Golgi. TP53 loss activated G55-dependent secretion by relieving G55 and myosin IIA from miR-34a-dependent silencing. G55-dependent secreted proteins enhanced the proliferative and invasive activities of TP53-deficient LUAD cells and promoted angiogenesis and CD8+ T cell exhaustion in the tumor microenvironment. A small molecule that blocks G55-G45 interactions impaired secretion and reduced TP53-deficient LUAD growth and metastasis. These results identified a targetable secretory vulnerability in TP53-deficient LUAD cells.

Keywords: Cell Biology; Lung cancer; Oncology; P53; Protein traffic.


Conflict of interest statement

Conflict of interest: DLG serves on scientific advisory committees for AstraZeneca, GlaxoSmithKline, Sanofi, and Janssen; provides consultations for Ribon Therapeutics; and has research support from Janssen, Takeda, and AstraZeneca. JMK has received consulting fees from Halozyme.

Figures

Figure 1
Figure 1. p53 Deficiency relieves GRASP55 (G55) from miR-34a–dependent silencing.
(A) Volcano plot of mRNAs (dots). Differences between LUAD (n = 515) and normal lung (n = 51) in TCGA expressed as a P value (y axis) and a t-statistic (x axis) to identify genes upregulated (t > 0) or downregulated (t < 0) in cancer. G55 indicated. (B) Quantification of G55 mRNA in tumors (red dots) and normal tissues (green dots). Tumor types significantly different from normal (asterisks). Mean values (horizontal bars). (C) G55 mRNA levels in the TCGA pan-cancer cohort (dots) annotated on the basis of mutations. “Unaligned” indicates no correlation with mutations. Sample sizes indicated (n). Tumor types color coded. (D) Kaplan-Meier analysis of TCGA pan-cancer cohort (n = 9,502) scored based on G55 mRNA expression. High: top third. Other: middle and bottom thirds. (E) Western blot (WB) analysis of G55 in parental (WT) and TP53-KO A549 clones. Cells treated with vehicle (DMSO) or nutlin-3 to enhance p53 levels. α-Tubulin loading control. (F) Quantitative real-time PCR (qPCR) analysis of miR-transfected cells. Negative control (miR-NC). (G) WB analysis of miR-transfected cells. β-Actin loading control. (H and I) qPCR (H) and WB (I) analysis of A549 cells cotransfected with shRNAs and miRs. Control vectors indicated by (–). Values relative to control transfectants. (J and K) qPCR (J) and WB (K) analysis of H1299 cells cotransfected with p53 expression vector and antagomir-34a (anti-34a). Vec, empty vector; anti-NC, control antagomir. (L) Reporter assays on cells cotransfected with miRs and reporters containing G55 3′-UTRs with intact (WT) or mutant (MT) miR-34a binding sites. Values relative to miR-NC. n = 4. (M) RNA polymerase II ChIP assays on GORASP2 gene promoter. Values are percentage of input (total chromatin). All WB densitometric values are relative to control. Results represent mean ± SD. n = 3, unless otherwise indicated. P values: ANOVA (H and J), univariate Cox (D), 2-sided t test (all others).
Figure 2
Figure 2. G55 is a driver of TP53-mutant LUAD progression.
(A) WB analysis of TP53-mutant LUAD cell lines transfected with G55 (siG55#1, #2) or control (siCTL) siRNA. (B) Cell proliferation in monolayer culture quantified at 4 days by WST-1 assays. Results relative to siCTL controls. n = 5. (C) Anchorage-independent colony formation quantified after 10 days in soft agarose. Results relative to siCTL controls. (D) Boyden chamber assays. FBS (10%) added to bottom chamber as chemoattractant. Cells that migrated or invaded through porous filter (Matrigel-coated for invasion assays) photographed 8 hours after seeding in upper chamber and counted manually. Results relative to siCTL controls. (E) qPCR analysis of TP53-WT and TP53-mutant (MT) LUAD cell lines. Results relative to siCTL. (F and G) Anchorage-dependent colony formation. Cells seeded at low density on plastic. Results expressed as fractions (F) or percentage reductions (G) relative to siCTL in TP53-WT and TP53-mutant (MT) cell lines (G). (H) WB analysis of 344SQ cells transfected with G55 (shG55#1, #2, #3) or control (shCTL) shRNAs. G55 densitometric values relative to shCTL. (I) Primary subcutaneous tumor weight (left plot) and lung metastasis numbers (right plot) per mouse (dots). Necropsies performed 5 weeks after subcutaneous injection of 344SQ cells into syngeneic, immunocompetent mice. (J) Kaplan-Meier analysis of mouse cohorts bearing G55-deficient (shG55) or G55-replete (shCTL) 344SQ orthotopic lung tumors (n = 10 mice per cohort). (K) WB analysis of 344P LUAD cells transfected with GFP-tagged G55 or empty (Vec) expression vectors. (L) Primary tumor weights (left plot) and lung metastasis numbers (right plot) determined at necropsy 5 weeks after subcutaneous injection of tumor cells. Results represent mean ± SD. n = 3, unless otherwise indicated. P values: ANOVA (BD and I), log-rank test (J), 2-sided t test (all others).
Figure 3
Figure 3. G55 activates the secretion of protumorigenic effector proteins.
(A) Invasion assays of H1299 cells in Boyden chambers performed after 24 hours of treatment with conditioned medium (CM) from G55-deficient or G55-replete cells. (B) Anchorage-dependent colony formation assays performed on G55-deficient (shG55) or G55-replete (shCTL) H2122 cells after treatment for 10 days with or without (–) CM from G55-deficient or G55-replete cells. (C) Volcano plot of proteins identified by LC-MS analysis of CM collected from H1299 cells (shG55 or shCTL). Proteins (dots) plotted by P value (y axis) and fold change (x axis). Fold change = 1.4, P = 0.05 indicated (vertical and horizontal dotted lines, respectively). Proteins of interest are labeled. (D) WB analysis of CM samples. Mean densitometric values of triplicate CM samples relative to control (siCTL) (bar graph). (E and F) Anchorage-independent colony formation (E) and cell migration and invasion (F) assays. Results expressed relative to control (siCTL). (G) Orthotopic lung tumor size and contralateral lung metastasis numbers at necropsy 5 weeks after injecting 1 × 10⁶ tumor cells. (HJ) WB analysis of triplicate CM samples from parental and TP53-KO A549 cells (H) or H1299 cells subjected to ectopic expression of p53 (I) or miR-34a (J). Densitometric values relative to controls (bar graphs). Values are mean ± SD. n = 3, unless otherwise indicated. P values: ANOVA (A, B, and DG), 2-sided t test (all others).
Figure 4
Figure 4. GRASPIN inhibits secretion and tumor growth.
(A and B) Co-IP of G55 and GOLGIN45 (G45) (A) or GRASP65 (G65) and GM130 (B). IP/WB analysis of H1299 cells transfected with GFP-tagged G55 (A) or G65 (B) and treated for 2 days with 10 μM GRASPIN or vehicle (DMSO). Whole cell lysates (input). (C) Cell proliferation after 4 days of GRASPIN treatment. Results relative to lowest GRASPIN dose in H1299_shCTL cells. n = 5. (D) Anchorage-independent colony formation. Colonies quantified after 14 days of GRASPIN or DMSO treatment. Results relative to controls (shCTL/DMSO). (E) Anchorage-dependent colony formation after 10 days of GRASPIN treatment. Results expressed relative to vehicle (0 μM). (F) The percentage reductions in E analyzed based on TP53 mutational status. TP53-WT, TP53-deleted (null), or TP53-missense-mutant (MT). (G) WB analysis of CM samples from indicated cells after 2 days of 10 μM GRASPIN or vehicle treatment. Densitometric values relative to DMSO (bar graph). (H) Co-IP of G55 and G45 in lysates of subcutaneous 344SQ tumors. Mice treated with GRASPIN or vehicle (DMSO) for 4 weeks beginning 7 days after tumor cell injection. (I and J) Tumor measurements on mice in H during treatment (I) and at necropsy (J). (K) Orthotopic lung tumor size and contralateral lung metastasis numbers in nu/nu mice treated for 3 weeks with 50 mg/kg GRASPIN or vehicle beginning 2 weeks after H1299 cell injection. (L) PDX tumor volumes in mice treated with 50 mg/kg GRASPIN or vehicle expressed as fold change relative to day 0. n = 10. (M) Orthotopic lung tumor size and contralateral lung metastasis numbers in nu/nu mice treated for 3 weeks with 50 mg/kg GRASPIN or vehicle beginning 2 weeks after A549 cell injection. n = 10. Results represent mean ± SD. n = 3, unless otherwise indicated. P values: ANOVA (E, I, and J), 2-sided t test (all others).
Figure 5
Figure 5. G55 activates secretion via the Golgi.
(A and B) WB analysis of triplicate CM samples from H1299 cells treated for 16 hours with 100 nM wortmannin (Wort) or 5 mM 3-methyladenine (3-MA) (A) or 1 μg/mL brefeldin A (BFA) (B). (C) WB analysis to confirm GOLPH3 depletion in H2122 cells transfected with GOLPH3 siRNAs (siGOL#1, #2). (D and E) WB analysis of triplicate CM samples from H2122 cells transfected with siRNAs against GOLPH3. Densitometric values relative to siCTL (E). (F) Kaplan-Meier analysis of the TCGA LUAD cohort (n = 477 patients) scored on the basis of G45 mRNA levels above (high) or below (low) the median value. (G) WB analysis of G45 protein levels in cells transfected with siRNAs against G45 (siG45) or control siRNA (siCTL). (H) WB analysis of triplicate CM samples from cells in G. Densitometric values relative to siCTL. (I) Anchorage-independent colony formation assays in soft agar. G45-deficient (shG45) or G45-replete (shCTL) H1299 cells cultured with or without (–) CM from shG45- or shCTL-transfected H1299 cells. (J) WB analysis to confirm G45 depletion or ectopic G55 expression. 344P cells transfected with G55 or shG45 expression vectors. Empty vectors indicated by (–). Arrow indicates the G45-specific band. (K) Primary tumor weights and lung metastasis numbers in syngeneic, immunocompetent mice determined at necropsy 5 weeks after subcutaneous injection of 1 × 10⁶ cells in J. Results represent mean ± SD. n = 3, unless otherwise indicated. P values: log-rank test (F), ANOVA (all others).
Figure 6
Figure 6. G55-dependent secretion and LUAD progression require G55/G45 interactions.
(A) Co-IP of G55 and G45. IP/WB assays on H1299 cells cotransfected with GFP-tagged G55 (GFP-G55) and HA-tagged WT or mutant (L400R) G45 (HA-G45). (B) WB analysis of H1299 cells cotransfected with G45 shRNA and WT or mutant (L400R) G45 (G45). Control vectors indicated by (–). Arrow indicates endogenous G45. (C) Anchorage-independent colony formation using cells in B. (D) Co-IP of G55 and G45. IP/WB analysis of H1299 cells cotransfected with HA-tagged G45 and GFP-tagged WT or mutant (G97D) G55. (E) WB analysis of H1299 cells cotransfected with G55 shRNA (shG55) and WT or mutant (G97D) G55. Endogenous (G55) and ectopic (G55-EGFP) G55. (F) WB analysis of CM samples from cells in E. (G) Anchorage-independent colony formation assays on cells in E. (H) Primary tumor weights and lung metastasis numbers at necropsy 5 weeks after subcutaneously injecting 1 × 10⁶ 344SQ cells into syngeneic, immunocompetent mice. Transfectants generated using the same vectors described in E. (I) Co-IP of G55 and G45. IP/WB assays on H1299 cells cotransfected with GFP-tagged G55 and a G45 peptide that blocks G55/G45 interactions (G45 BP). Empty vector indicated by (–). Arrow indicates endogenous G45. (J) Anchorage-independent colony formation using H1299 cells or 344SQ cells transfected with G45 BP or empty vector (–). (K) Primary tumor weights and lung metastasis numbers at necropsy 5 weeks after subcutaneous injection of 344SQ cells in J. (L) Kaplan-Meier analysis of nu/nu mice bearing orthotopic lung tumors generated by H1299 cells in J. Results represent mean ± SD. n = 3, unless otherwise indicated. P values: ANOVA (C, G, and H), log-rank test (L), 2-sided t test (all others).
Figure 7
Figure 7. G55 activates RAB6A vesicle biogenesis in the Golgi.
(A and B) Co-IP of G45 and myosin IIA (MYOIIA). IP/WB assays on H1299 cells cotransfected with GFP-tagged MYOIIA and HA-tagged G45 (A). H1299 cells transfected with WT or mutant (ΔN) HA-tagged G45 lacking N-terminal peptides (B). (C) WB analysis of total (–) and fractionated (+) H1299 cell lysates to confirm enrichment in “vesicle” and “Golgi” fractions on the basis of organelle markers (right). (D) WB analysis of RAB6A, IGFBP2, and SPP1 in Golgi- or vesicle-enriched fractions or total lysates (–) isolated from H1299 cells transfected with siRNA against G55, G45, or MYOIIA. (E) Densitometric analysis of results in D expressed relative to siCTL controls. (F) Contrast-adjusted confocal micrographs. RAB6A vesicles (red arrows) and unfissioned RAB6A tubules (blue arrows) emerge from the Golgi (green arrows). Cell boundary (dotted lines). Size bars: 10 μm. (GJ) Quantification of vesicles (G and H) and unfissioned tubules (I and J) per cell (dots). (K and L) WB analysis of CM samples isolated from H1299 cells and H2122 cells transfected with siRNAs against MYOIIA (K) or RAB6A (L). Densitometric values expressed relative to siCTL (bar graphs). Results represent mean ± SD. n = 3, unless otherwise indicated. P values: ANOVA (E and K), 2-way t test (all others).
Figure 8
Figure 8. G55, G45, and MYOIIA are coordinately regulated in cancer.
(A and B) Pearson’s correlation of G55, G45, MYOIIA, and MYO18A in LUAD (A) and pan-cancer (B) TCGA cohorts. MYO18A included as negative control. (C and D) G45 (C) and MYOIIA (D) mRNA levels in tumors (dots) annotated on the basis of somatic DNA mutations in the TCGA pan-cancer cohort. Sample sizes indicated (n). Tumor types color-coded. “Unaligned” samples did not correlate with any of the indicated genetic mutations. (E and F) Kaplan-Meier analysis of TCGA cohorts on the basis of a 3-gene expression signature (G55, G45, MYOIIA). For the LUAD cohort (E), tumors in the top third (high), middle third (other), and bottom third (low) were compared. For the pan-cancer cohort (F), tumors in the top third (high) were compared with tumors in the middle and bottom third (other). (G) qPCR analysis of MYOIIA mRNA levels in A549 cells cotransfected with shp53 or shCTL and miR-34 or miR-NC. Results expressed relative to controls (shCTL/miR-NC). (H) qPCR analysis of MYOIIA mRNA levels in H1299 cells cotransfected with p53 or empty (Vec) expression vector and antagomir-34a (anti-34a) or control (anti-NC). Results expressed relative to controls (Vec/anti-NC). (I) WB analysis of H1299 cells and H2122 cells transfected with miR-34a, miR-200a, or control (miR-NC). Densitometric values relative to miR-NC. (J) Reporter assays on H1299 cells cotransfected with miR-34a or miR-NC and reporters containing MYOIIA 3′-UTRs with intact (WT) or mutant (MT) miR-34a binding sites. A MYO18A 3′-UTR reporter that lacks miR-34a binding sites included as a control. Values expressed relative to miR-NC. (K) Schematic illustration of our working model. Results represent mean ± SD. n = 3, unless otherwise indicated. P values: Pearson’s correlation (A and B), ANOVA (C, D, G, and H), univariate Cox (E and F), 2-way t test (J).

Comment in

  • Targeting the mutant p53 secretome.
    Sehgal K, Barbie DA. Sehgal K, et al. J Clin Invest. 2021 Jan 4;131(1):e143945. doi: 10.1172/JCI143945. J Clin Invest. 2021. PMID: 33393496 Free PMC article.

References

    1. Werb Z, Lu P. The role of stroma in tumor development. Cancer J. 2015;21(4):250–253. doi: 10.1097/PPO.0000000000000127. - DOI - PMC - PubMed
    1. Prager BC, Xie Q, Bao S, Rich JN. Cancer stem cells: the architects of the tumor ecosystem. Cell Stem Cell. 2019;24(1):41–53. doi: 10.1016/j.stem.2018.12.009. - DOI - PMC - PubMed
    1. Li J, Stanger BZ. The tumor as organizer model. Science. 2019;363(6431):1038–1039. - PubMed
    1. Paltridge JL, Belle L, Khew-Goodall Y. The secretome in cancer progression. Biochim Biophys Acta. 2013;1834(11):2233–2241. - PubMed
    1. Coussens LM, Fingleton B, Matrisian LM. Matrix metalloproteinase inhibitors and cancer: trials and tribulations. Science. 2002;295(5564):2387–2392. - PubMed

Publication types

MeSH terms

Substances