. 2020 Sep 22;4(18):4417-4429.
doi: 10.1182/bloodadvances.2020002001.

Thioridazine requires calcium influx to induce MLL-AF6-rearranged AML cell death

Affiliations

Thioridazine requires calcium influx to induce MLL-AF6-rearranged AML cell death

Claudia Tregnago et al. Blood Adv. .

Abstract

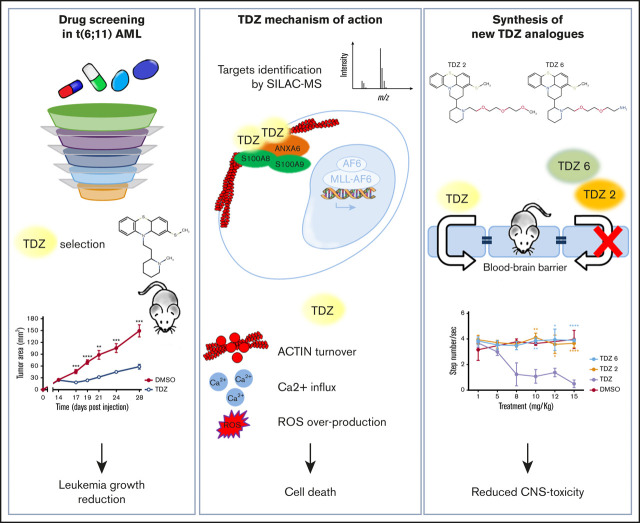
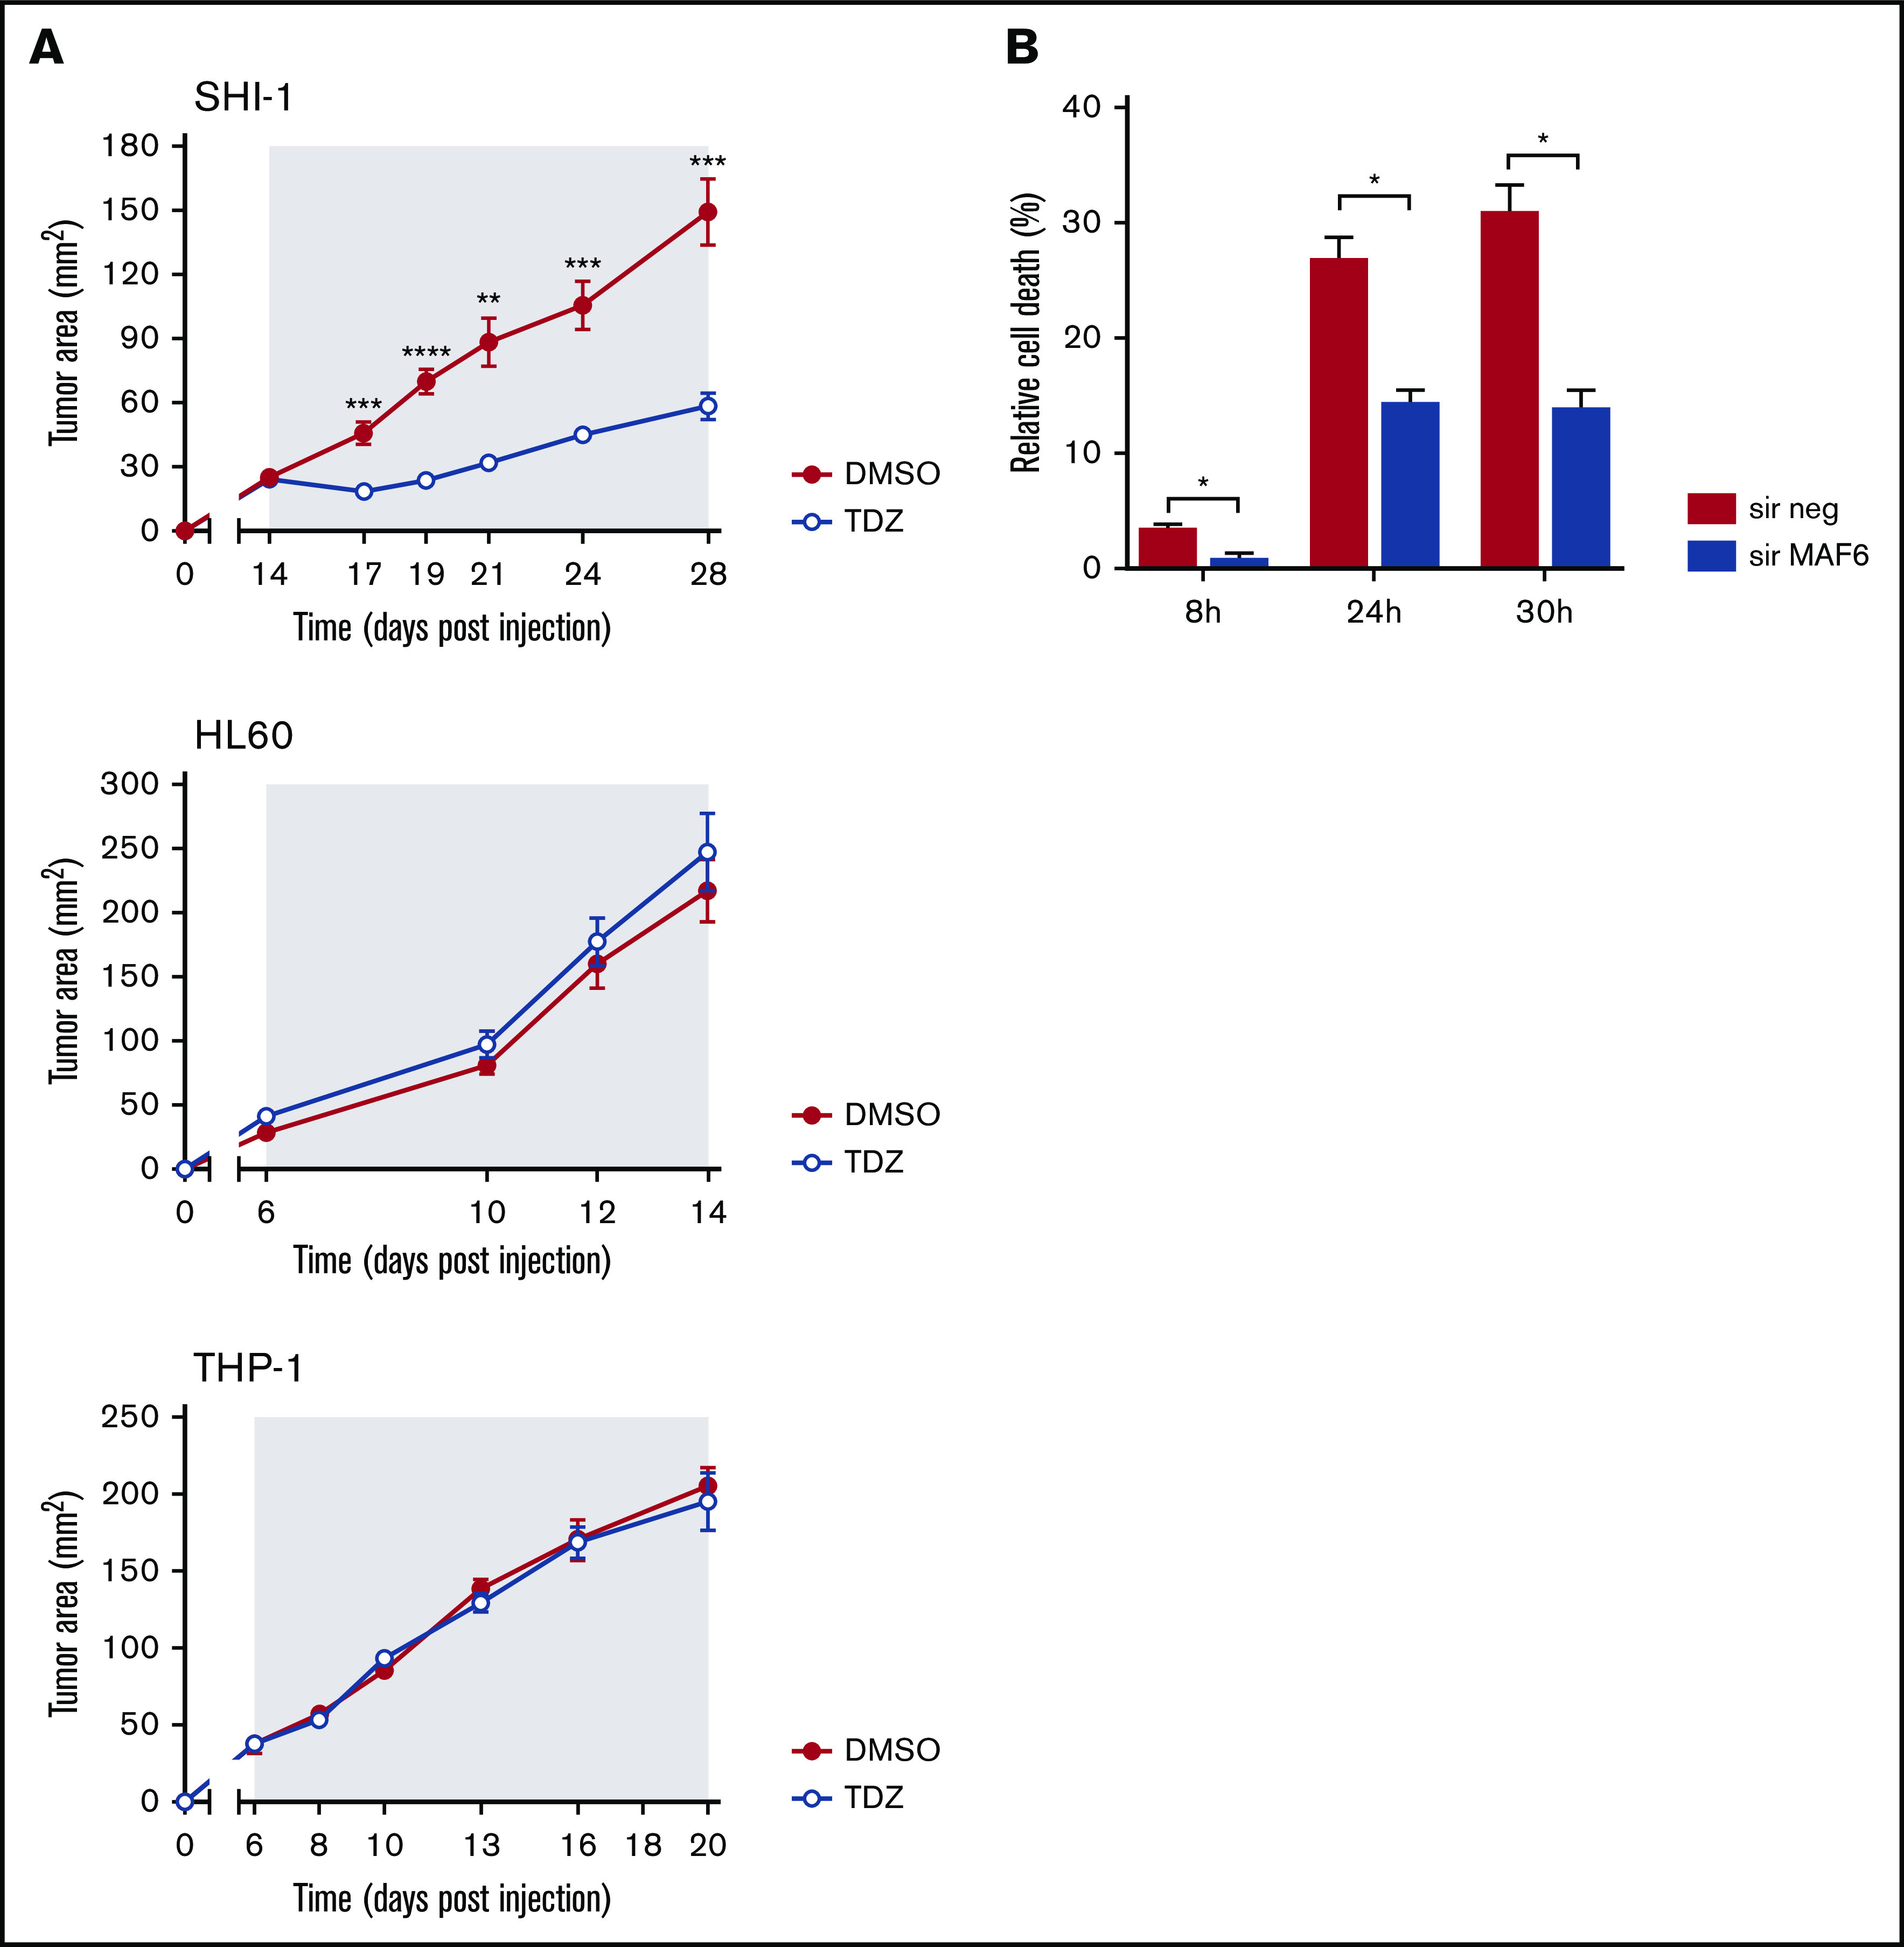
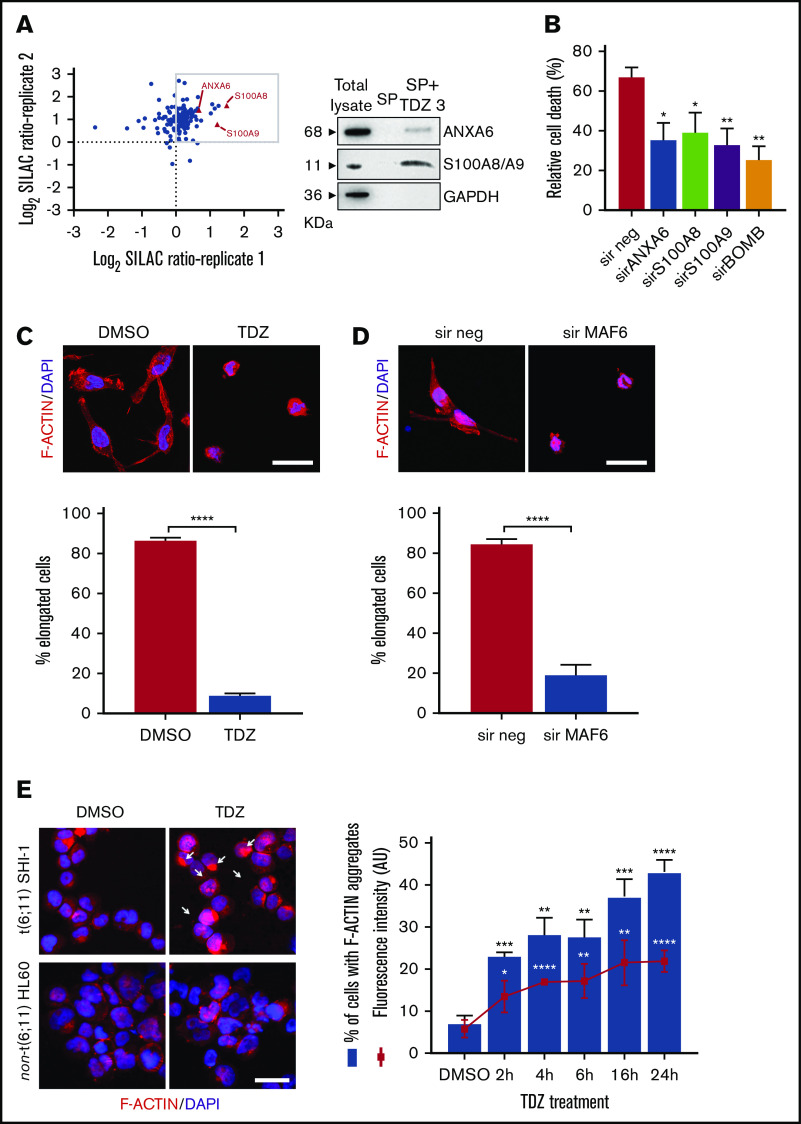
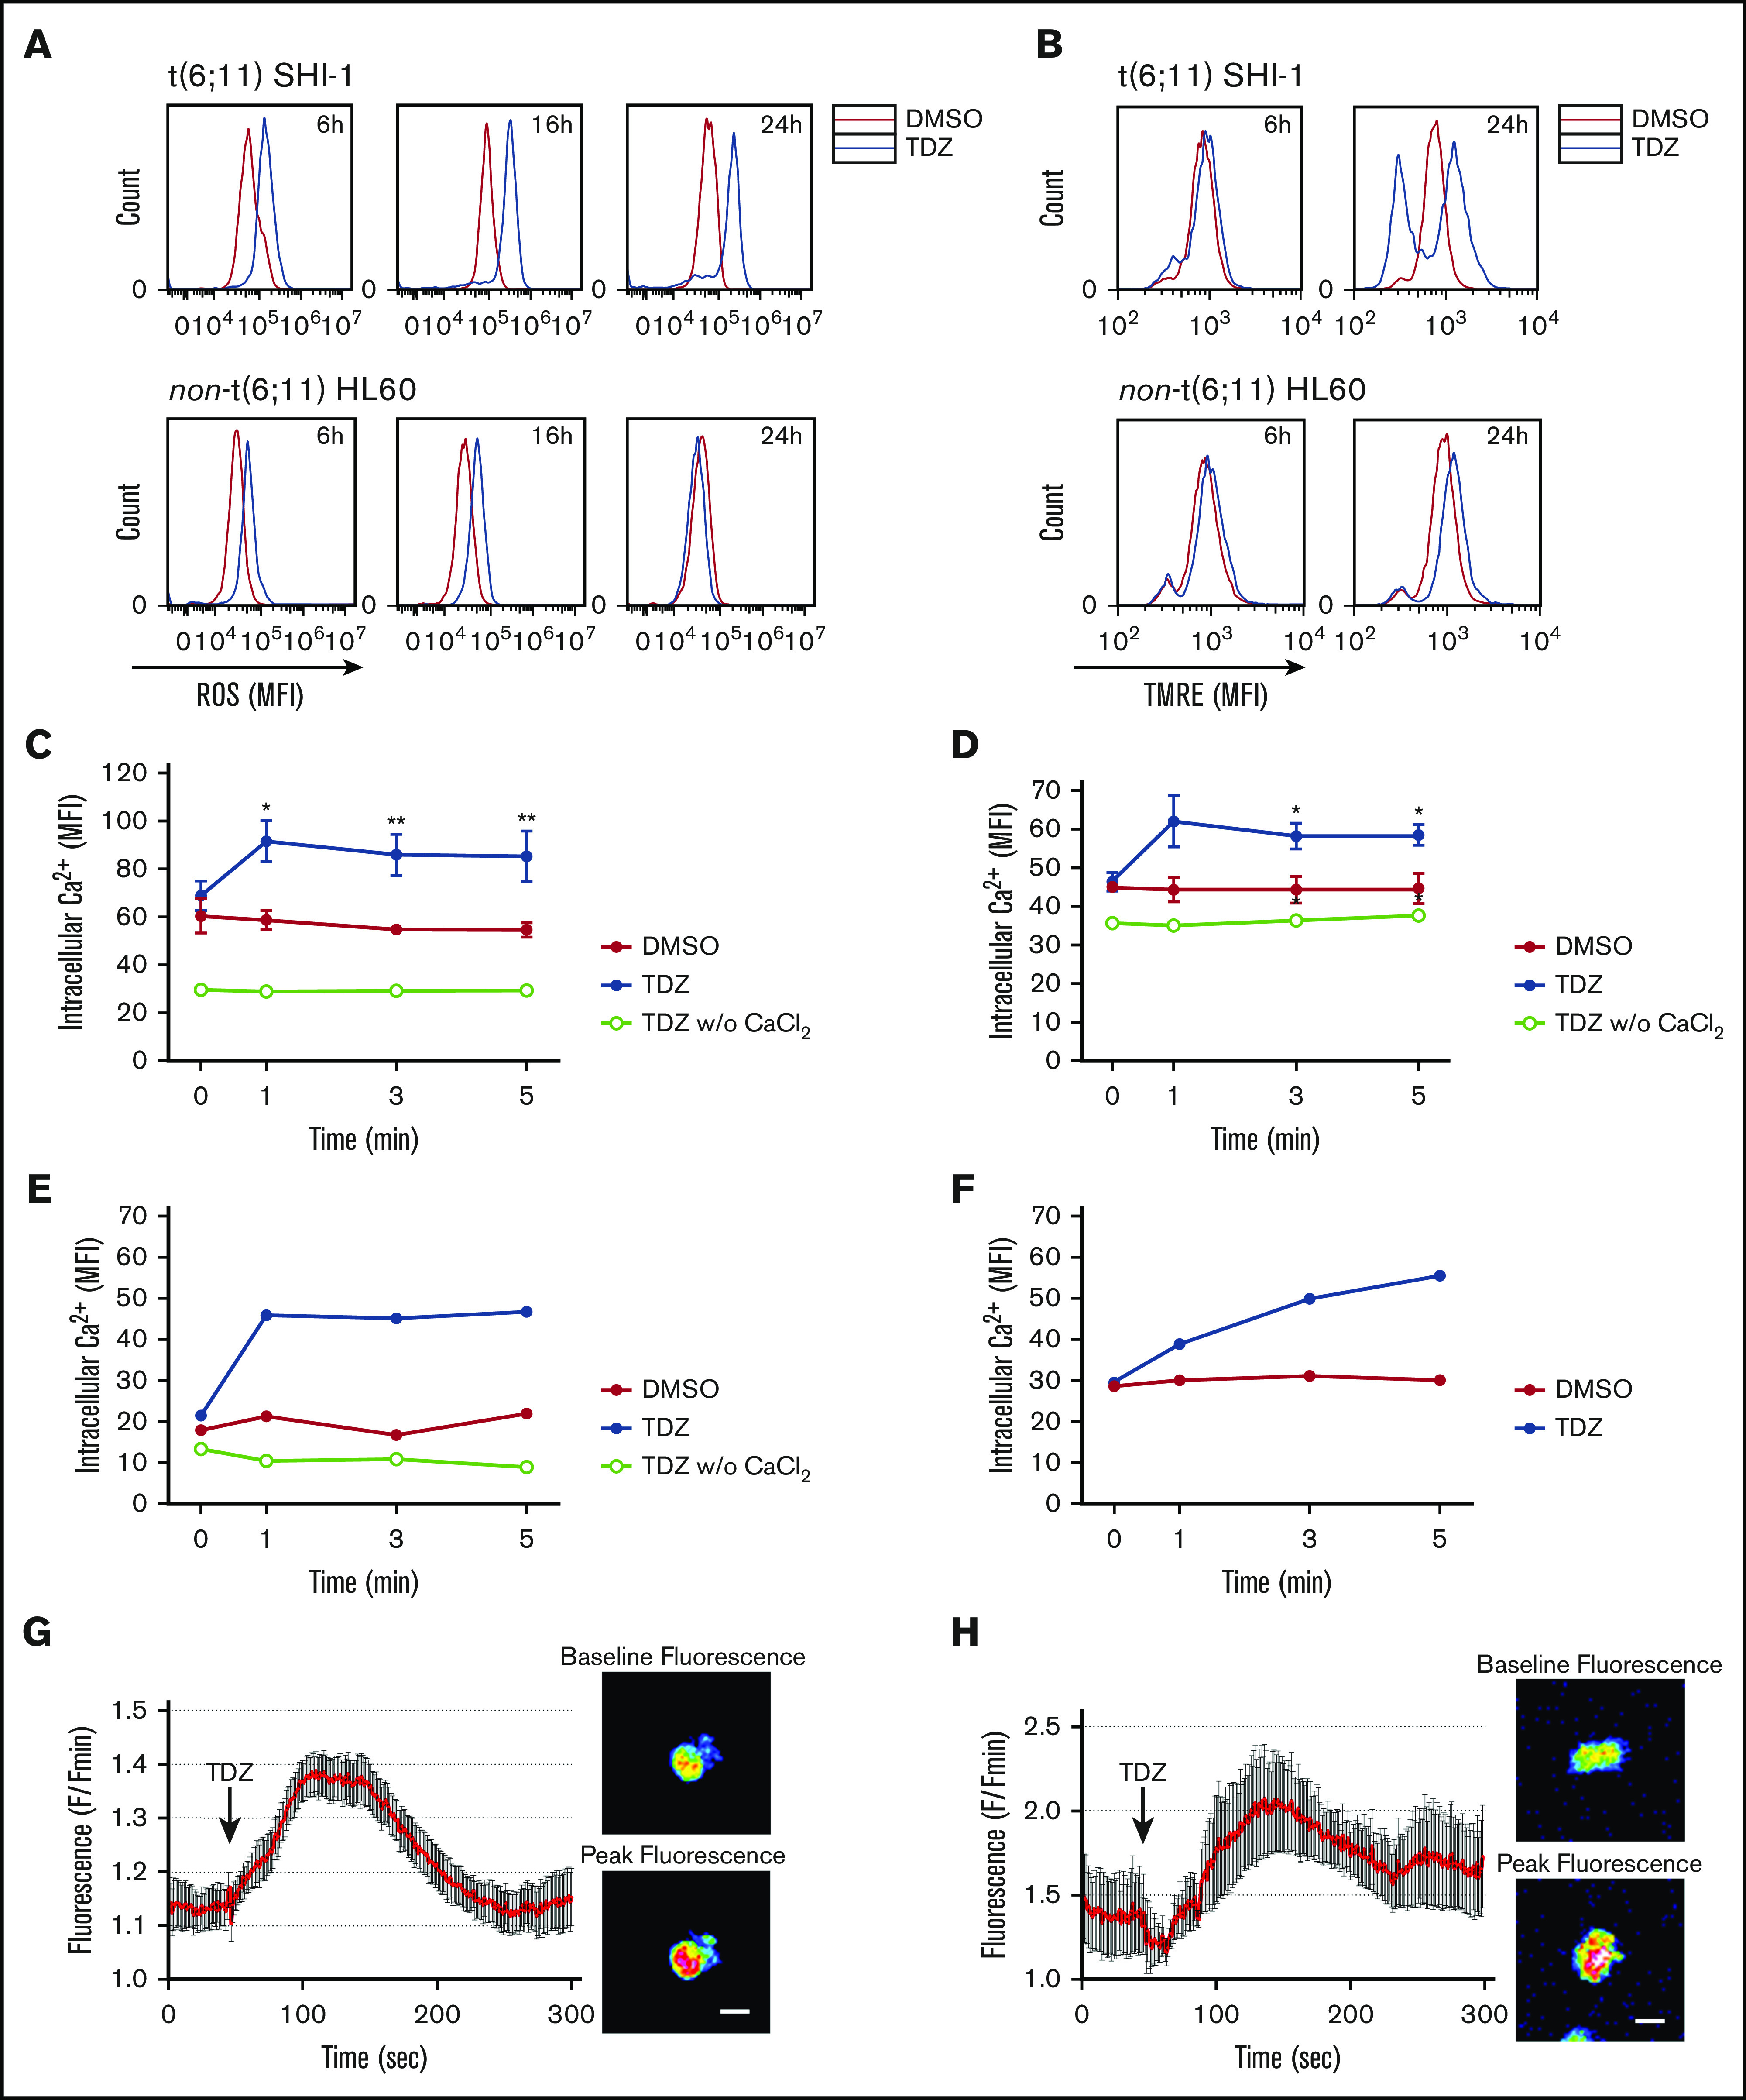
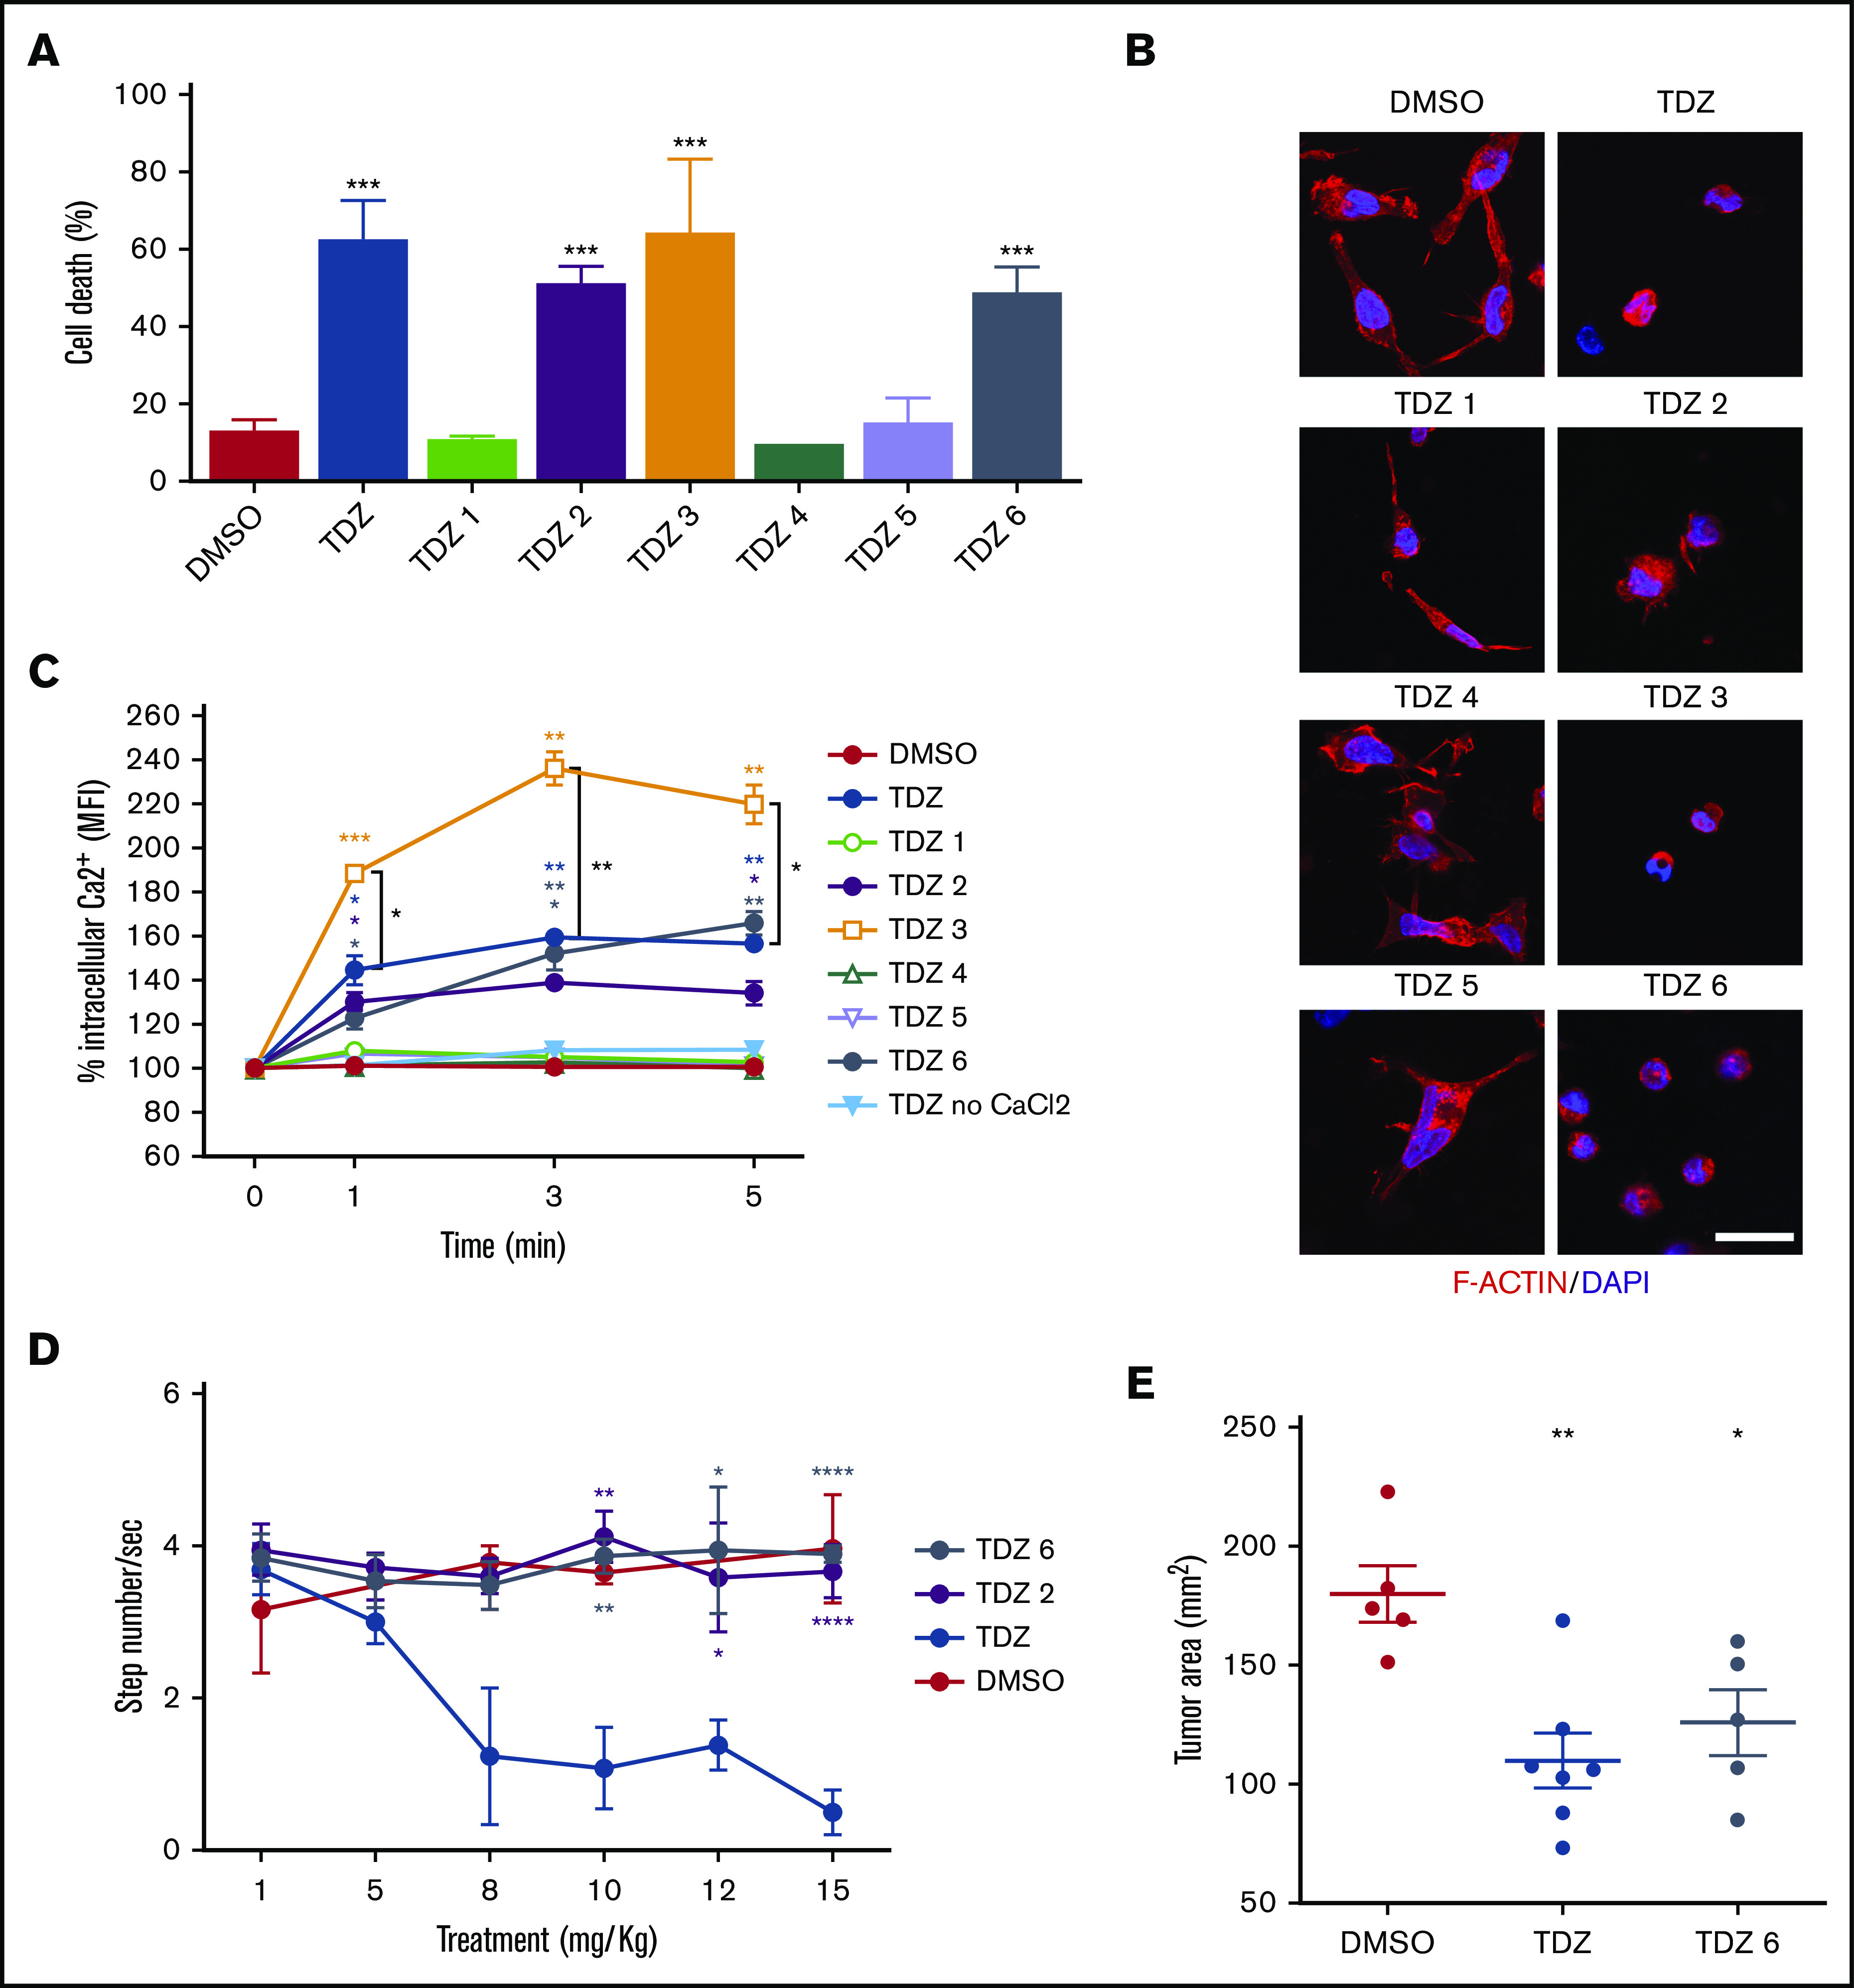
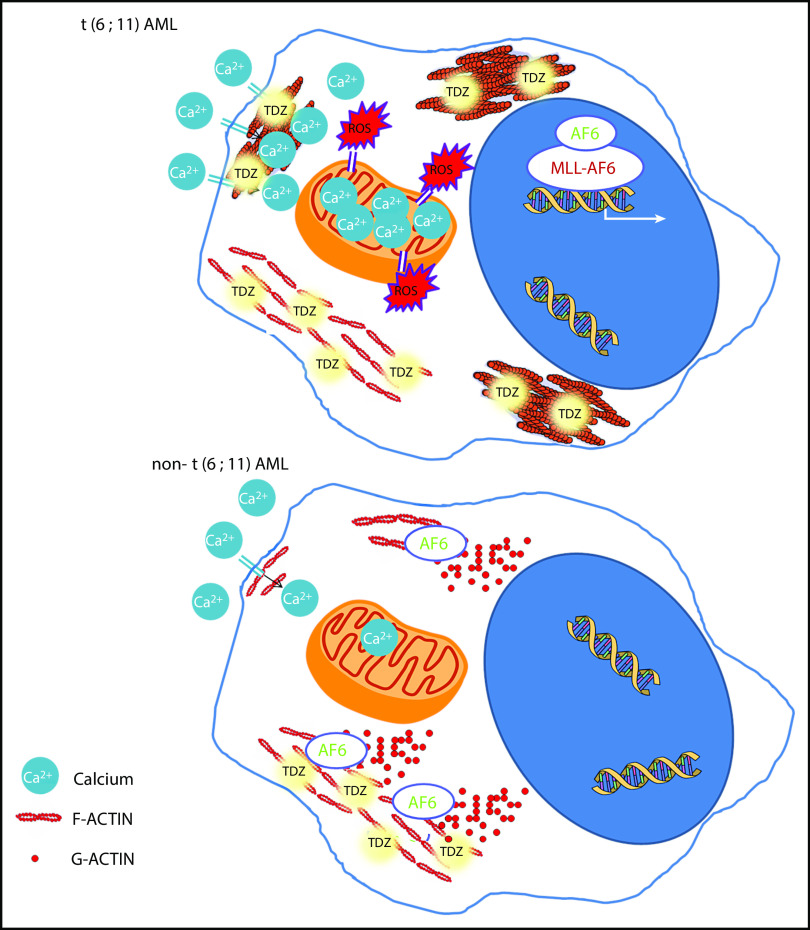
In pediatric acute myeloid leukemia (AML), intensive chemotherapy and allogeneic hematopoietic stem cell transplantation are the cornerstones of treatment in high-risk cases, with severe late effects and a still high risk of disease recurrence as the main drawbacks. The identification of targeted, more effective, safer drugs is thus desirable. We performed a high-throughput drug-screening assay of 1280 compounds and identified thioridazine (TDZ), a drug that was highly selective for the t(6;11)(q27;q23) MLL-AF6 (6;11)AML rearrangement, which mediates a dramatically poor (below 20%) survival rate. TDZ induced cell death and irreversible progress toward the loss of leukemia cell clonogenic capacity in vitro. Thus, we explored its mechanism of action and found a profound cytoskeletal remodeling of blast cells that led to Ca2+ influx, triggering apoptosis through mitochondrial depolarization, confirming that this latter phenomenon occurs selectively in t(6;11)AML, for which AF6 does not work as a cytoskeletal regulator, because it is sequestered into the nucleus by the fusion gene. We confirmed TDZ-mediated t(6;11)AML toxicity in vivo and enhanced the drug's safety by developing novel TDZ analogues that exerted the same effect on leukemia reduction, but with lowered neuroleptic effects in vivo. Overall, these results refine the MLL-AF6 AML leukemogenic mechanism and suggest that the benefits of targeting it be corroborated in further clinical trials.


Conflict of interest statement

Conflict-of-interest disclosure: C.T., R.R., and M.P. are coinventors of the new TDZ compounds included in an Italian Patent (number 102019000015809) entitled “Composti Analoghi della Tioridazina.” The remaining authors declare no competing financial interests.

Figures

None
Graphical abstract
Figure 1.
Figure 1.
Drug screening pipeline and selected compounds. (A) The pipeline used to select compounds for t(6;11) cell lines: 1280 compounds were tested in ML-2 cells; 104 active drugs were tested in SHI-1; 93 active drugs were screened in the t(5;17) cell line HL60; and 20 nonactive drugs were tested in the t(9;11) cell lines THP-1 and NOMO-1. The 10 resulting compounds were considered selective for t(6;11)AML. Drug treatment was performed in triplicate, and compounds were considered active when cell viability was reduced to at least 60%. (B) Cell death (annexin V+, PI+, and annexin V+/PI+) induced by FLUS and TDZ in SHI-1 cells 24 and 48 hours after treatment (n = 3), relative to the DMSO value. (C) Colony-forming assay performed on viable SHI-1 cells seeded 24 hours after FLUS or TDZ treatment (n = 3). Data are the mean ± SEM. *P < .05; **P < .01; ***P < .001; ****P < .0001.
Figure 2.
Figure 2.
TDZ antagonizes MLL-AF6–mediated leukemia progression. (A) Tumor growth in mice that received flank injections of SHI-1, HL60, or THP1 cells and were treated daily with TDZ at 8 mg/kg, compared with the control group treated with DMSO (n = 6). The gray area indicates the treatment interval. (B) Cell death (annexin V+, PI+, and annexin V+/PI+) of SHI-1–injected mice treated with TDZ 16 hours after MLL-AF6 chimera silencing (sir), evaluated 8, 24, and 30 hours after treatment, compared with DMSO (n = 2). Data are the mean ± SEM. *P < .05; **P < .01; ***P < .001; ****P < .0001.
Figure 3.
Figure 3.
TDZ induces cytoskeletal rearrangement. (A) Scatterplot of the common SHI-1 proteins identified in 2 independent experiments of quantitative proteomics combined with affinity enrichment. Each data point is a single protein; proteins with log2 SILAC ratio >0 (box) denote the 88 inferred targets identified with buffer 1, whereas the 3 proteins represented by red triangles are those confirmed by buffer 2 (n = 2). Immunoblot analysis for SILAC validation. SHI-1 total proteins. Proteins eluted in the SP without TDZ3 (SP) and with TDZ3 (SP+TDZ3) were analyzed by western blot. (B) Cell death (annexin V+, PI+, and annexin V+/PI+) induced after 24 hours of treatment with TDZ 10 µM treatment in SHI-1 cell lines after ANXA6, S100A8, and S100A9 silencing (sir), used alone or combined (sirBOMB). (C-D) Representative confocal immunofluorescence images of SHI-1 cells seeded onto fibronectin-coated slides 4 hours after TDZ treatment (C), or 60 hours after silencing (sir) of MLL-AF6 fusion gene (D), stained with F-actin antibody (red) and diamidino-2-phenylindole (DAPI; blue) as the nuclear counterstain. Histograms represent the percentage of elongated cells (panel C; n = 46-146 cells and n = 114-225 cells). Original magnification ×63. Bars represent 10 μm. (E) Immunofluorescence of centrifuged SHI-1 and HL60 cells 4 hours after TDZ treatment, stained with F-actin antibody (red) and with DAPI (blue) as the nuclear counterstain. Arrows indicate F-actin aggregates. Histogram represents the percentage of SHI-1 cells containing F-actin aggregates 2, 4, 6, 16, or 24 hours after TDZ treatment (n = 152-333 cells). Original magnification ×63. Bar represents 10 μm. Data are the mean ± SEM. *P < .05; **P < .01; ***P < .001; ****P < .0001. Original magnification ×40. Bar represents 10 μm. AU, arbitrary unit.
Figure 4.
Figure 4.
TDZ induces ROS production and mitochondrial depolarization in t(6;11) AML cell through calcium influx. (A) ROS levels detected 6, 16, and 24 hours after TDZ treatment compared with DMSO, in SHI-1 and HL60 cells (n = 2). (B) Mitochondrial depolarization evaluated by tetramethylrhodamine ethyl (TMRE) fluorescence measurement, 6 and 24 hours after TDZ treatment compared with DMSO, in SHI-1 and HL60 cells (n = 5). (C-D) Live intracellular Ca2+ in t(6;11) SHI-1 (C) and in non-t(6;11) HL60 (D) cell lines, loaded with Fluo-4 AM Ca2+ indicator, measured by flow cytometry, in Ca2+-containing or -free buffer (n = 5). Values are the mean ± SEM. *P < .05; **P < .01. (E-F) Live intracellular Ca2+ in t(6;11) (E) and non-t(6;11) primary (F) cells, loaded with Fluo-4 AM Ca2+ indicator, measured by flow cytometry. (G-H) Intracellular Ca2+ in SHI-1 (G) and t(6;11) primary cells (H) measured with a 2-photon microscope. Values are the mean fluorescence of 10 cells ± SEM. Images show baseline vs peak fluorescence of a representative cell. Bars represent 20 μm.
Figure 5.
Figure 5.
Ca2+overload is toxic for t(6;11)AML cells. (A) Live intracellular Ca2+ measurement in SHI-1 cells loaded with Fluo-4 AM Ca2+ indicator, measured by flow cytometry. EGTA pretreatment was performed 30 minutes before TDZ, which was added at time 0 after the basal measurement. Fluorescence was detected 1, 3, and 5 minutes after TDZ treatment (n = 3). (B) Overlapping representative histograms showing mitochondrial depolarization evaluated by tetramethylrhodamine ethyl (TMRE) fluorescence measurement 24 hours after TDZ, EGTA, or EGTA+TDZ treatment (n = 3). (C) Cell death (annexin V+, PI+, and annexin V+/PI+) evaluated 6 and 24 hours after TDZ, EGTA, or EGTA+TDZ treatment, compared with the DMSO value (n = 2). (D) Histograms showing the percentage of elongated cells (n = 46-146 cells) and the percentage of cells containing F-actin aggregates (n = 156-408 cells), 4 hours after TDZ, EGTA, or EGTA+TDZ treatment. (B-D) EGTA pretreatment was performed 30 minutes before TDZ was added. (E) Representative overlapping histograms showing mitochondrial depolarization evaluated by TMRE measurement 6 and 24 hours after treatment with TDZ, KB-R7943, or KB-R7943+TDZ (n = 5). (F) Cell death (annexin V+, PI+, and annexin V+/PI+) evaluated 6 and 24 hours after TDZ, KB-R7943 or KB-R7943+TDZ treatment, compared with the DMSO value (n = 2). Data are the mean ± SEM. *P < .05; **P < .01; ***P < .001; ****P < .0001. ns, not significant.
Figure 6.
Figure 6.
TDZ analogues act on t(6;11)-AML cells with reduced neuroleptic side effects. (A) Cell death (annexin V+, PI+, and annexin V+/PI+) evaluated 24 hours after treatment with TDZ and the analogues TDZ1, TDZ2, TDZ3, TDZ4, TDZ5, and TDZ6, compared with the DMSO value (n = 3). (B) Confocal immunofluorescence images of SHI-1 cells stained with F-actin antibody and with diamidino-2-phenylindole (DAPI) as the nuclear counterstain, seeded onto fibronectin (FN)-coated slides 4 hours after treatment with TDZ or its analogues (n = 2). Original magnification ×63. Bar represents 10 μm. (C) Live intracellular Ca2+ measurement in cells loaded with Fluo-4 AM, a Ca2+ indicator, measured by flow cytometry in Ca2+-containing or in Ca2+-free buffer. TDZ and TDZ analogues (or DMSO as the control) were added after the basal measurement at time 0 (n = 2), and fluorescence was detected 1, 3, and 5 minutes after treatment with TDZ. (D) Stepped-dose test (evaluated as the number of steps per second) performed 1 hour after TDZ, TDZ2, or TDZ6 treatment in NSG mice at the quantities shown (n = 3). (E) Tumor area in mice receiving a flank injection of SHI-1 cells and treated daily with TDZ 8 mg/kg or TDZ-equivalent molar doses of TDZ and TDZ6, compared with the control group treated with DMSO (n = 5), at day 31 after injection, after 20 days of treatment. Gray area indicates treatment interval. Data are the mean ± SEM. *P < .05; **P < .01; ***P < .001; ****P < .0001.
Figure 7.
Figure 7.
TDZ-induced effects. In t(6;11)AML cells, where AF6 is sequestered in the nucleus, TDZ binds S100A8-A9-ANXA6, impairing actin turnover, promoting F-actin aggregates, and ultimately leading to massive Ca2+ influx, which in turn promotes ROS overproduction and mitochondrial depolarization, triggering cell death. Conversely, in non-t(6;11)AML cells, TDZ still binds S100A8-A9-ANXA6, but the functional cytoplasmic AF6 counteracts its action, inducing milder cytoskeletal rearrangement and Ca2+ influx, eliciting reversible effects.

References

    1. Bisio V, Zampini M, Tregnago C, et al. . NUP98-fusion transcripts characterize different biological entities within acute myeloid leukemia: a report from the AIEOP-AML group. Leukemia. 2017;31(4):974-977. - PubMed
    1. Masetti R, Pigazzi M, Togni M, et al. . CBFA2T3-GLIS2 fusion transcript is a novel common feature in pediatric, cytogenetically normal AML, not restricted to FAB M7 subtype. Blood. 2013;121(17):3469-3472. - PubMed
    1. Zwaan CM, Kolb EA, Reinhardt D, et al. . Collaborative Efforts Driving Progress in Pediatric Acute Myeloid Leukemia. J Clin Oncol. 2015;33(27):2949-2962. - PMC - PubMed
    1. Pession A, Masetti R, Rizzari C, et al. ; AIEOP AML Study Group . Results of the AIEOP AML 2002/01 multicenter prospective trial for the treatment of children with acute myeloid leukemia. Blood. 2013;122(2):170-178. - PubMed
    1. Ebinger S, Özdemir EZ, Ziegenhain C, et al. . Characterization of Rare, Dormant, and Therapy-Resistant Cells in Acute Lymphoblastic Leukemia. Cancer Cell. 2016;30(6):849-862. - PMC - PubMed

Publication types