

Physiological mechanism and spatial distribution of increased alveolar dead-space in early ARDS: An experimental study
- PMID: 32931610
- PMCID: PMC9846860
- DOI: 10.1111/aas.13702
Physiological mechanism and spatial distribution of increased alveolar dead-space in early ARDS: An experimental study
Abstract
Background: We aimed to investigate the physiological mechanism and spatial distribution of increased physiological dead-space, an early marker of ARDS mortality, in the initial stages of ARDS. We hypothesized that: increased dead-space results from the spatial redistribution of pulmonary perfusion, not ventilation; such redistribution is not related to thromboembolism (ie, areas with perfusion = 0 and infinite ventilation-perfusion ratio, ), but rather to moderate shifts of perfusion increasing in non-dependent regions.
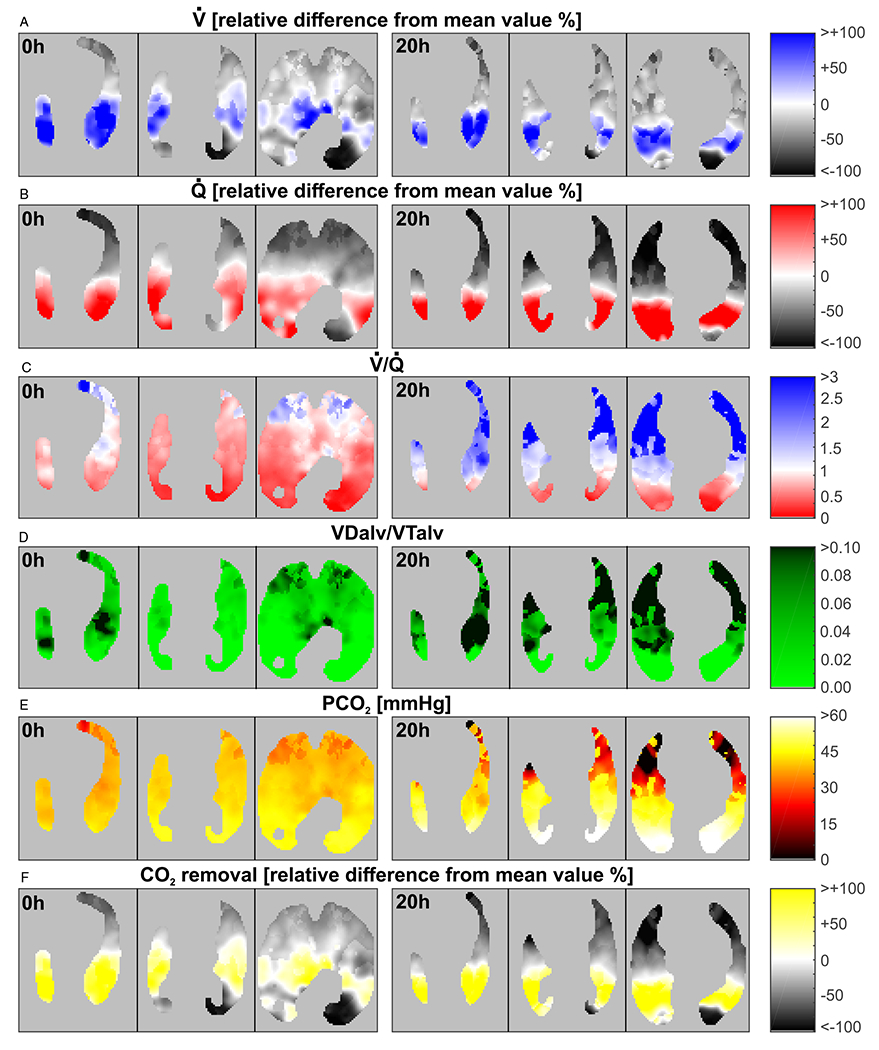
Methods: Five healthy anesthetized sheep received protective ventilation for 20 hours, while endotoxin was continuously infused. Maps of voxel-level lung ventilation, perfusion, , CO2 partial pressures, and alveolar dead-space fraction were estimated from positron emission tomography at baseline and 20 hours.
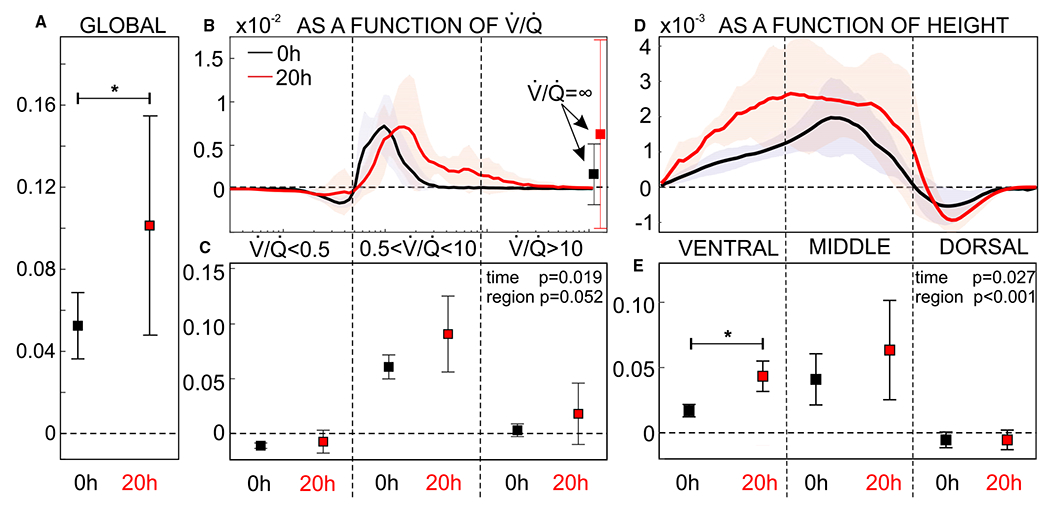
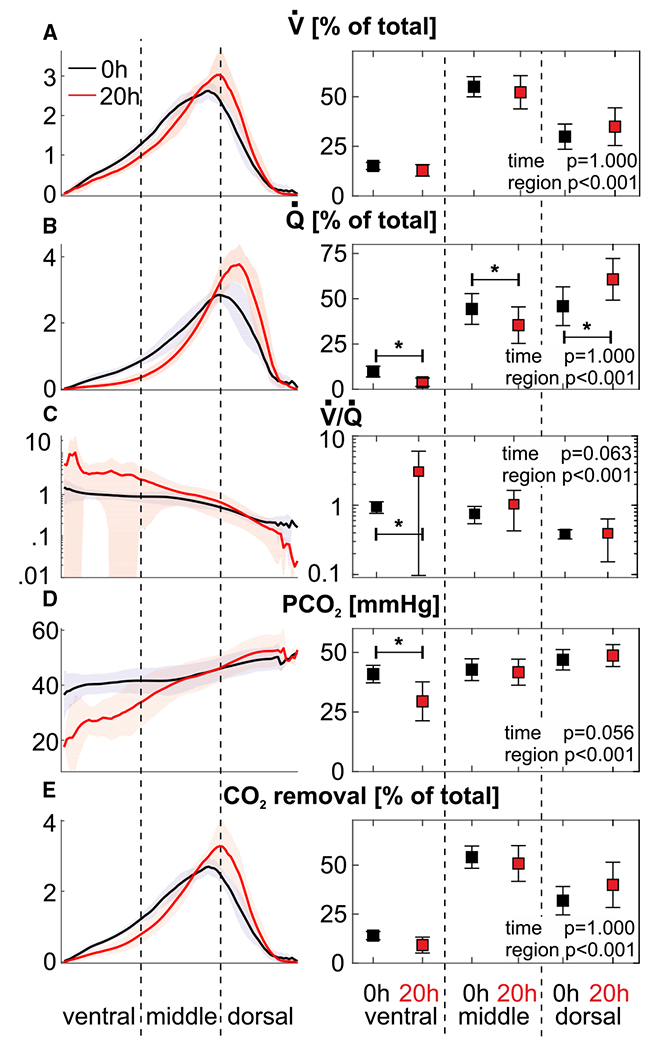
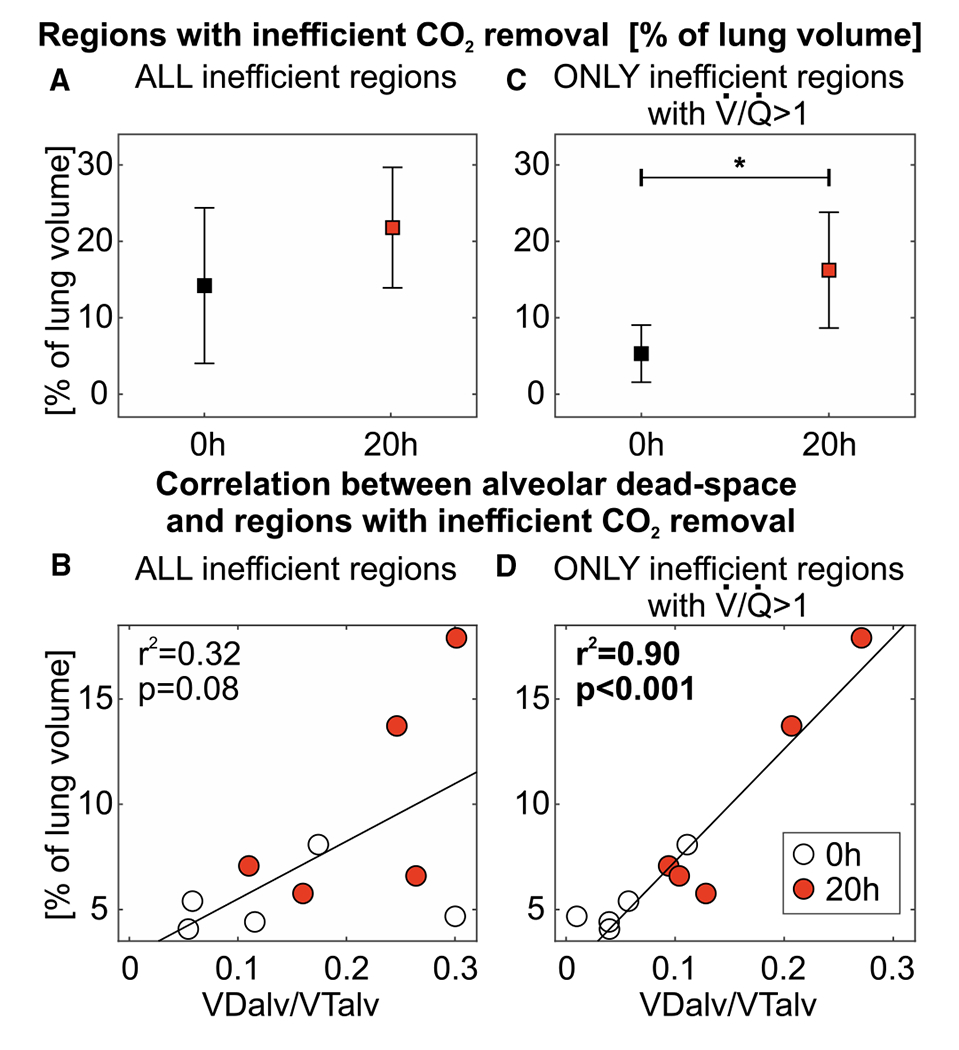
Results: Alveolar dead-space fraction increased during the 20 hours (+0.05, P = .031), mainly in non-dependent regions (+0.03, P = .031). This was mediated by perfusion redistribution away from non-dependent regions (-5.9%, P = .031), while the spatial distribution of ventilation did not change, resulting in increased in non-dependent regions. The increased alveolar dead-space derived mostly from areas with intermediate (0.5≤ ≤10), not areas of nearly "complete" dead-space ( >10).
Conclusions: In this early ARDS model, increases in alveolar dead-space occur within 20 hours due to the regional redistribution of perfusion and not ventilation. This moderate redistribution suggests changes in the interplay between active and passive perfusion redistribution mechanisms (including hypoxic vasoconstriction and gravitational effects), not the appearance of thromboembolism. Hence, the association between mortality and increased dead-space possibly arises from the former, reflecting gas-exchange inefficiency due to perfusion heterogeneity. Such heterogeneity results from the injury and exhaustion of compensatory mechanisms for perfusion redistribution.
© 2020 The Acta Anaesthesiologica Scandinavica Foundation. Published by John Wiley & Sons Ltd.
Conflict of interest statement
CONFLICTS OF INTEREST
Alessandro Beda is presently employed by Hamilton Medical AG, but the study, analysis, and drafting of the manuscript were performed before his employment, without any participation of Hamilton Medical AG. All other authors have disclosed that they do not have any conflicts of interest.
Figures
References
-
- Nuckton TJ, Alonso JA, Kallet RH, et al. Pulmonary dead-space fraction as a risk factor for death in the acute respiratory distress syndrome. N Engl J Med. 2002;346:1281–1286. - PubMed
-
- Lucangelo U, Bernabè F, Vatua S, et al. Prognostic value of different dead space indices in mechanically ventilated patients with acute lung injury and ARDS. Chest. 2008;133:62–71. - PubMed
-
- Kallet RH, Alonso JA, Pittet J-F, Matthay MA. Prognostic value of the pulmonary dead-space fraction during the first 6 days of acute respiratory distress syndrome. Respir Care. 2004;49:1008–1014. - PubMed
-
- West JB, Dollery CT, Naimark A. Distribution of blood flow in the isolated lung; relation to vascular and alveolar pressures. J Appl Physiol. 1964;19:713–724. - PubMed
Publication types
MeSH terms
Grants and funding
LinkOut - more resources
Full Text Sources
