

Correlation of tumor-infiltrating immune cells of melanoma with overall survival by immunogenomic analysis
- PMID: 32931642
- PMCID: PMC7666744
- DOI: 10.1002/cam4.3466
Correlation of tumor-infiltrating immune cells of melanoma with overall survival by immunogenomic analysis
Abstract
Aims: Different types of tumor-infiltrating immune cells not only augment but also dampen antitumor immunity in the microenvironment of melanoma. Therefore, it is critical to provide an overview of tumor-infiltrating immune cells in melanoma and explore a novel strategy for immunotherapies.
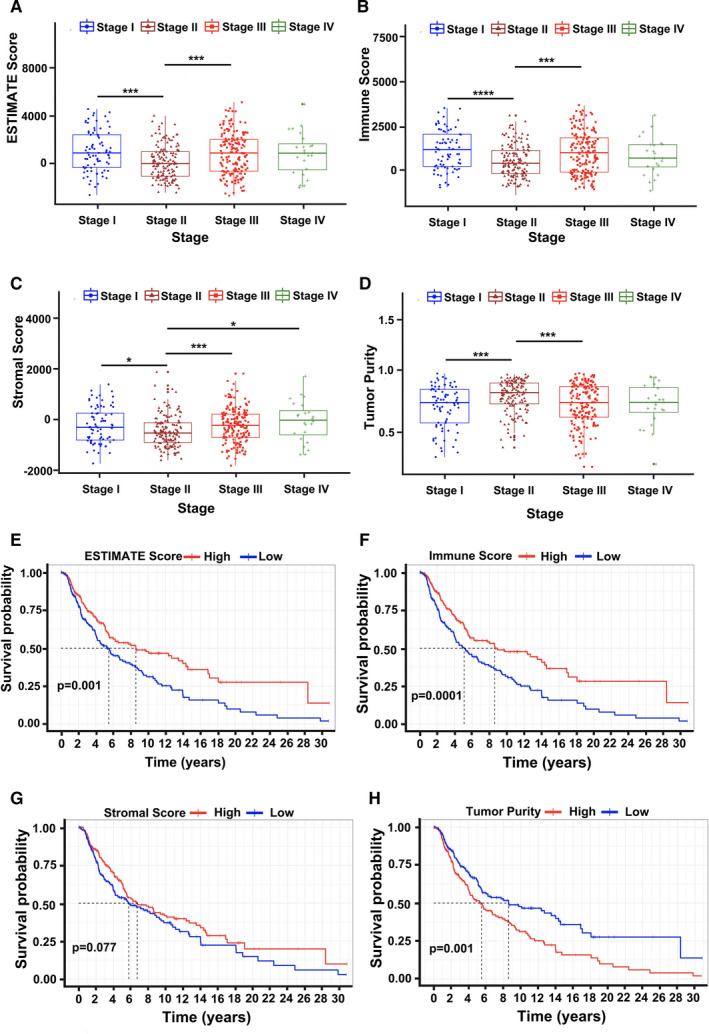
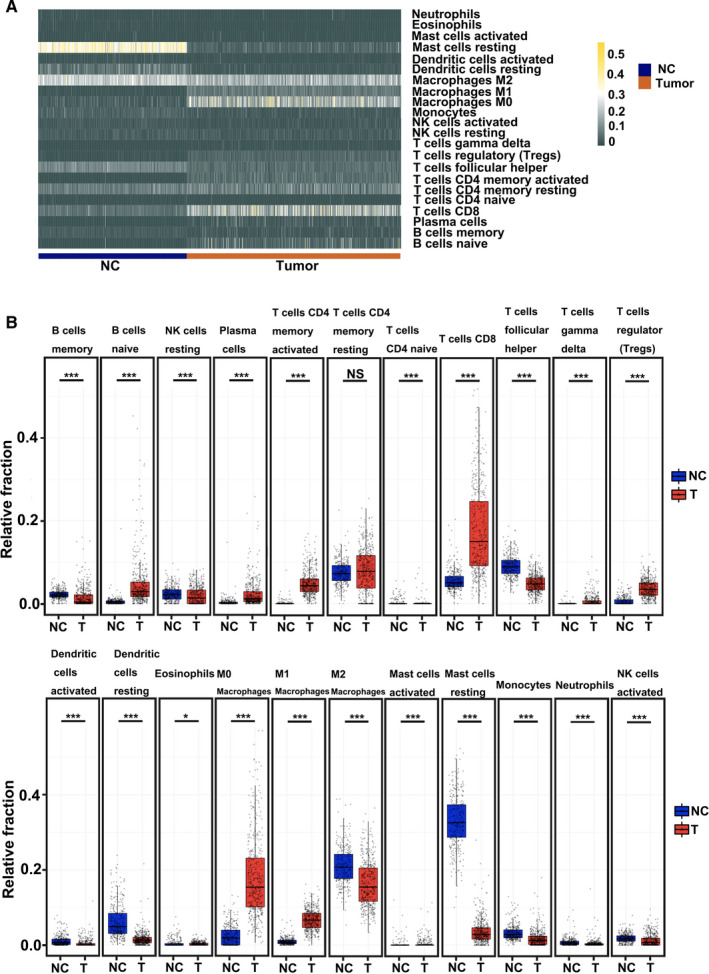
Methods: We analyzed the immune states of different stages in melanoma patients by the immune, stromal, and estimation of stromal and immune cells in malignant tumor tissues using expression data (ESTIMATE) scores. Immune cell types were identified by the estimating relative subsets of RNA transcripts (CIBERSORTx) algorithm in 471 melanoma and 324 healthy tissues. Moreover, we performed a gene set variation analysis (GSVA) to determine the differentially regulated pathways in the tumor microenvironment.
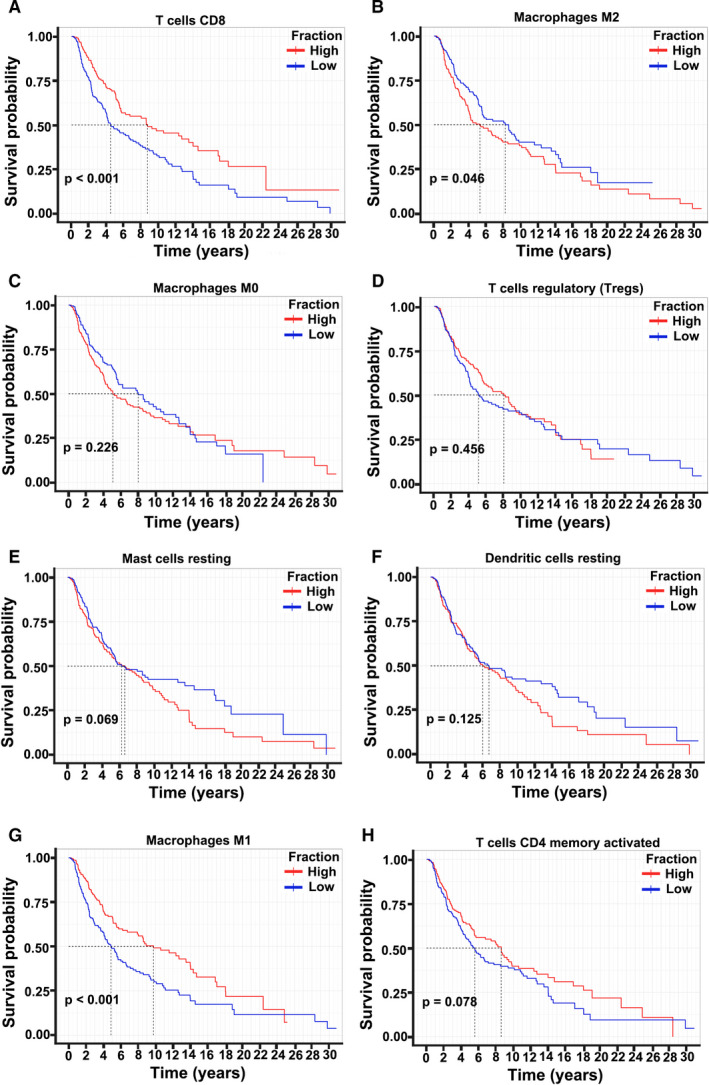
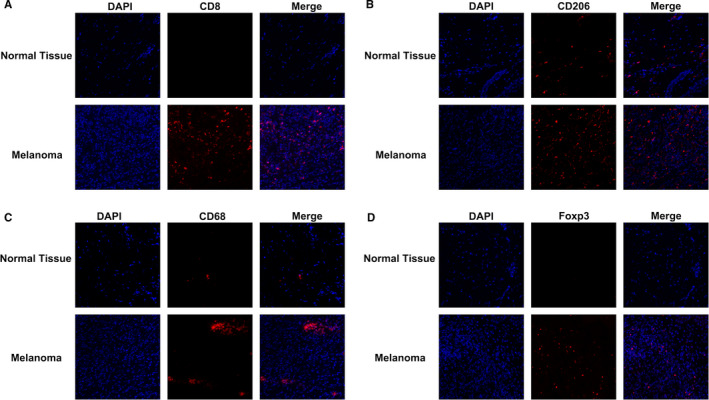
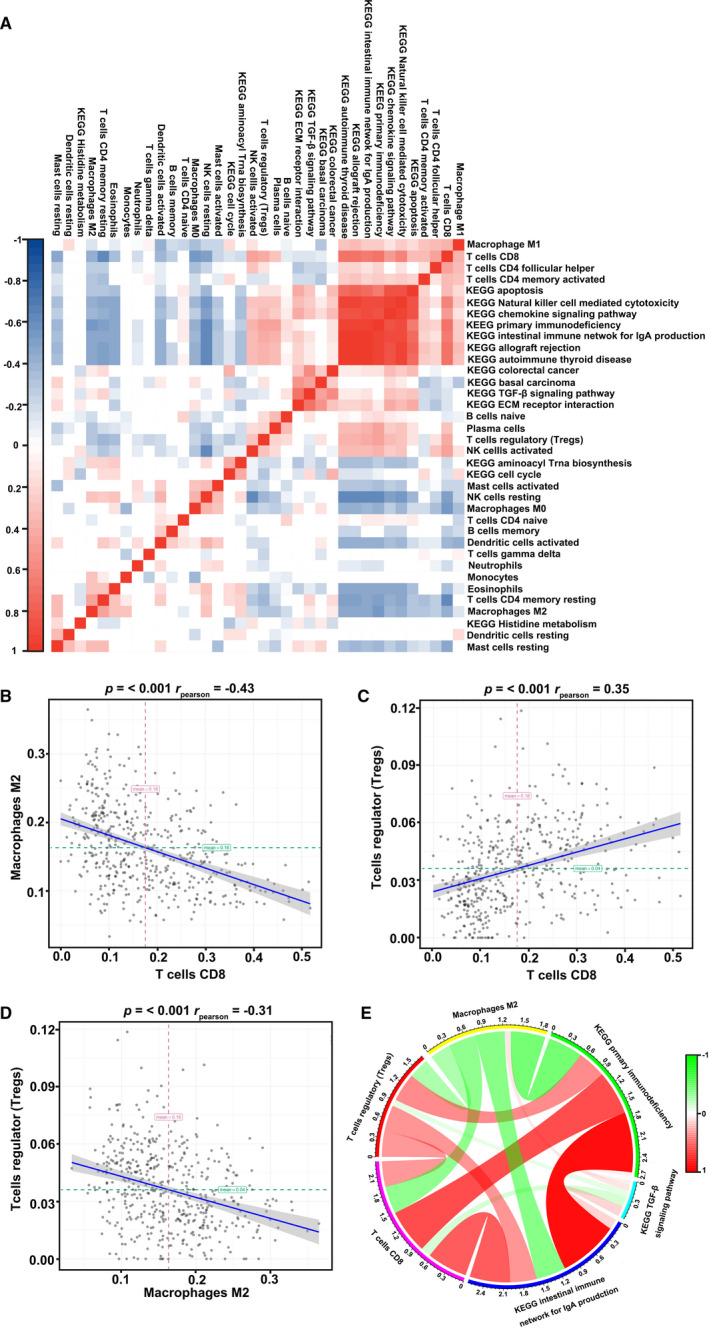
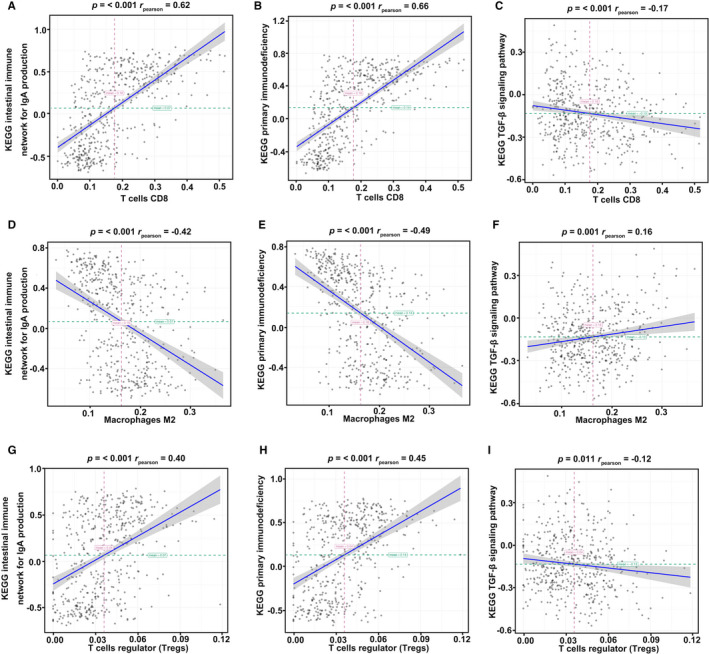
Results: In melanoma cohorts, we found that ESTIMATE and immune scores were involved in survival or tumor clinical stage. Among the 22 immune cells, CD8+ T cells, M2 macrophages, and regulatory T cells (Tregs) showed significant differences using the CIBERSORTx algorithm. Furthermore, GSVA identified the immune cell-related pathways; the primary immunodeficiency pathway, intestinal immune network for IgA, and TGF-β pathways were identified as participants of the crosstalk in CD8+ T cells, Tregs, and M2 macrophages in the melanoma microenvironment.
Conclusion: These results reveal the cellular and molecular characteristics of immune cells in melanoma, providing a method for selecting targets of immunotherapies and promoting the efficacy of therapies for the treatment of melanoma.
Keywords: CD8+ T cells; M2 macrophage; melanoma; tumor-infiltrating immune cells.
© 2020 The Authors. Cancer Medicine published by John Wiley & Sons Ltd.
Conflict of interest statement
The authors declare no competing interests.
Figures
References
-
- Corrie P, Hategan M, Fife K, et al. Management of melanoma. Br Med Bull. 2014;111:149‐162. - PubMed
-
- Blankenstein SA, van Akkooi ACJ. Adjuvant systemic therapy in high‐risk melanoma. Melanoma Res. 2019;29:358‐364. - PubMed
-
- Robert C, Long GV, Brady B, et al. Nivolumab in previously untreated melanoma without BRAF mutation. N Engl J Med. 2015;372:320‐330. - PubMed
-
- Lee CS, Thomas CM, Ng KE. An overview of the changing landscape of treatment for advanced melanoma. Pharmacotherapy. 2017;37:319‐333. - PubMed
Publication types
MeSH terms
LinkOut - more resources
Full Text Sources
Medical
Research Materials
Miscellaneous
