. 2020 Oct 1;80(1):87-101.e5.
doi: 10.1016/j.molcel.2020.08.017. Epub 2020 Sep 14.

Cell-Autonomous versus Systemic Akt Isoform Deletions Uncovered New Roles for Akt1 and Akt2 in Breast Cancer

Affiliations

Cell-Autonomous versus Systemic Akt Isoform Deletions Uncovered New Roles for Akt1 and Akt2 in Breast Cancer

Xinyu Chen et al. Mol Cell. .

Abstract

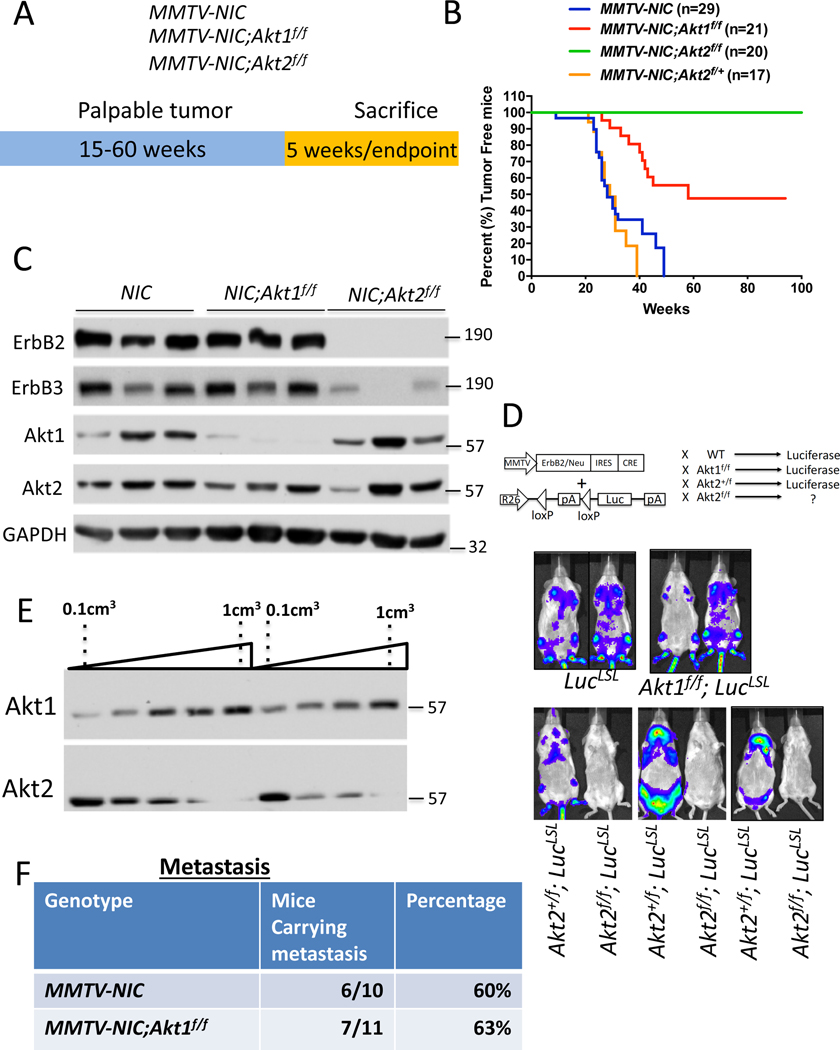
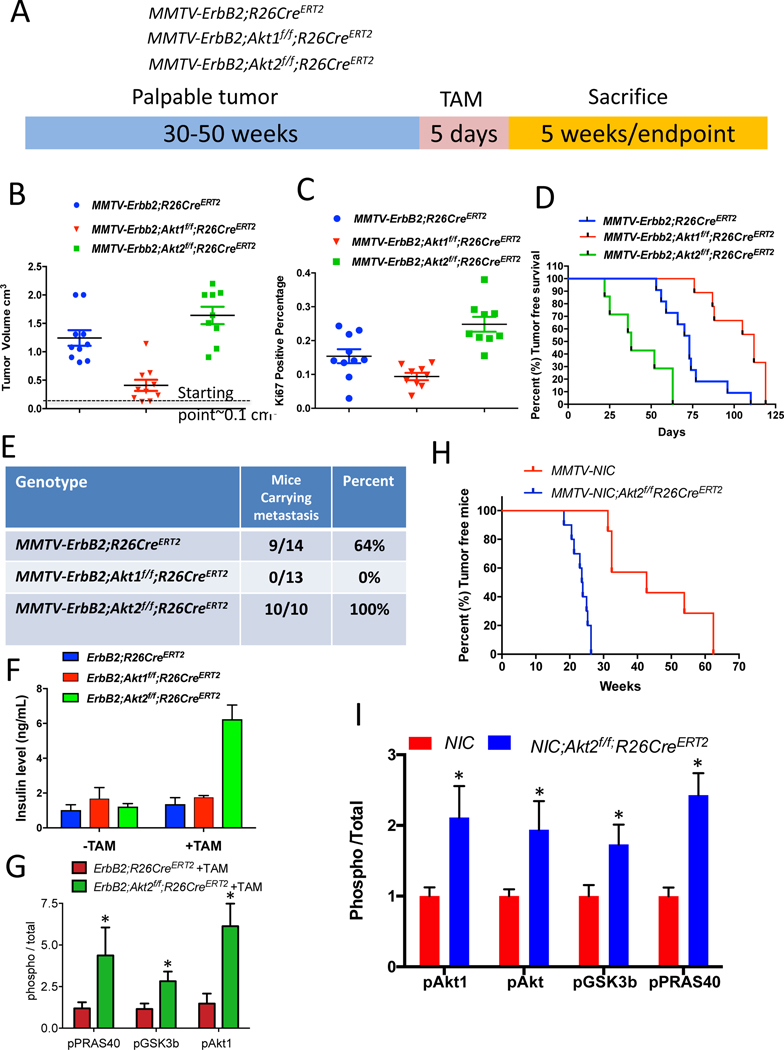
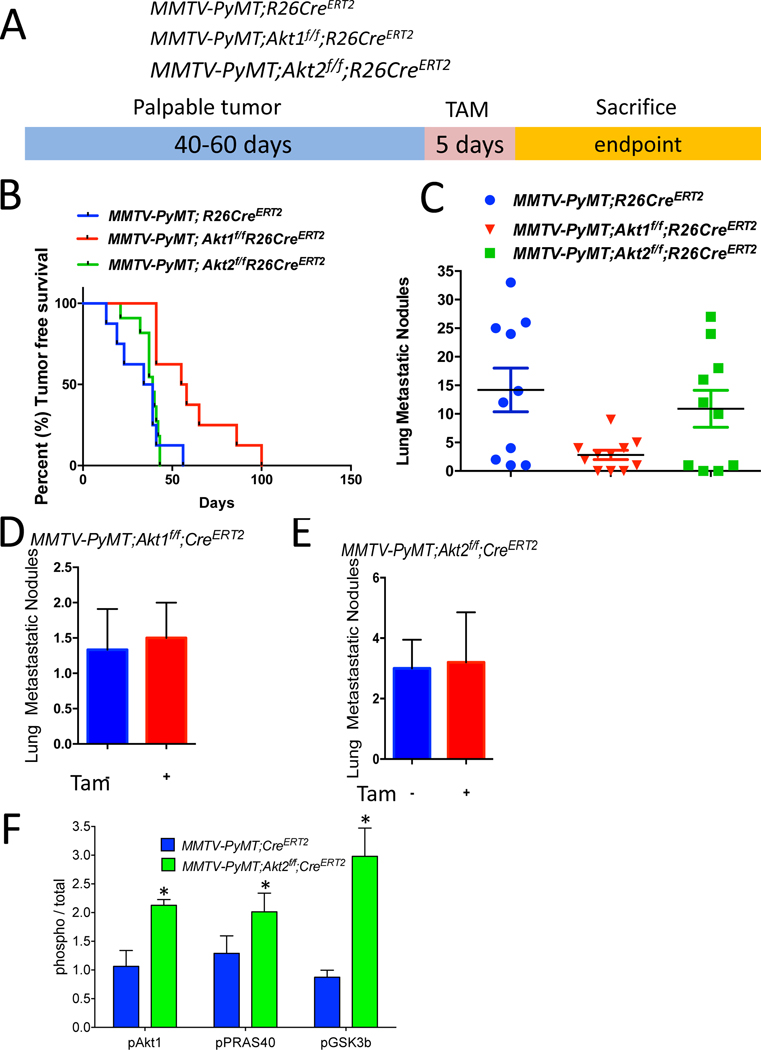
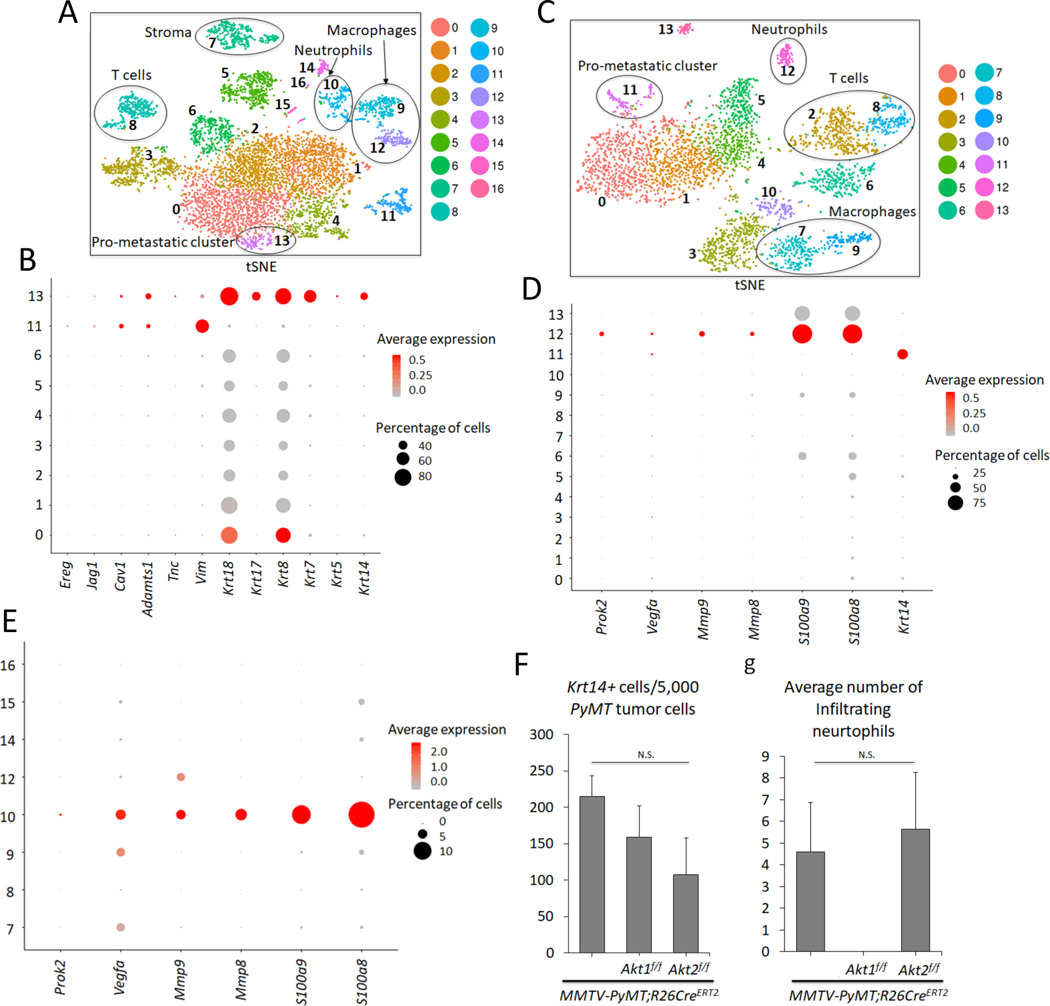
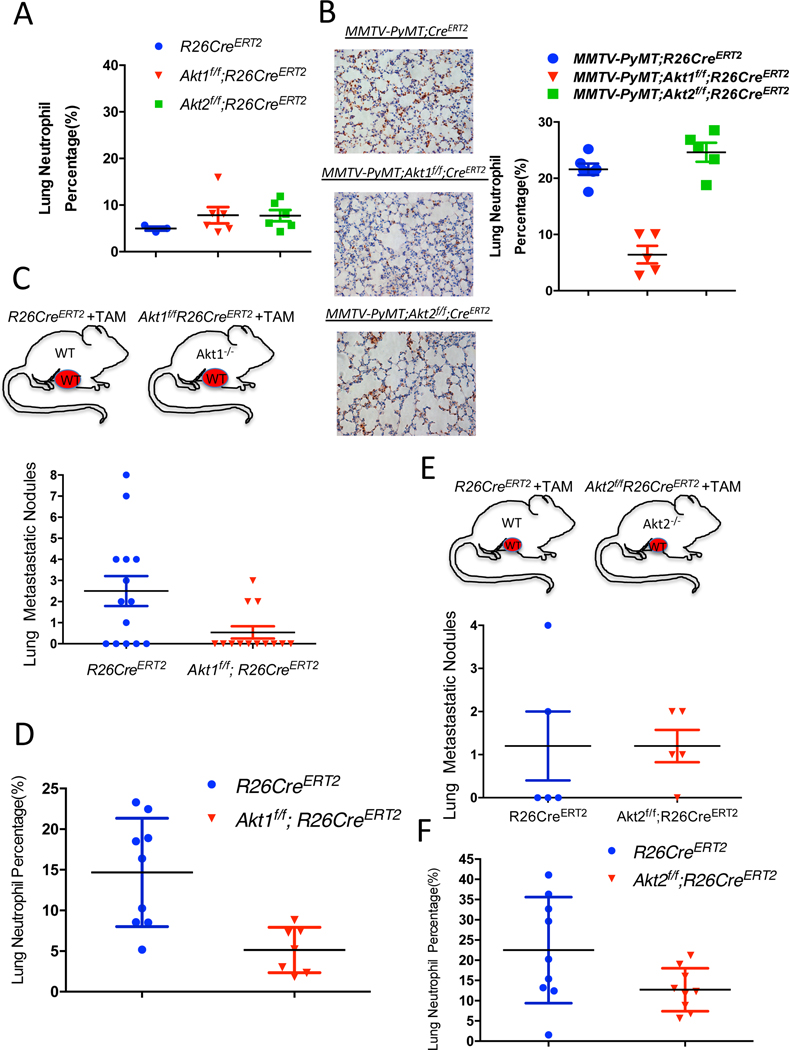
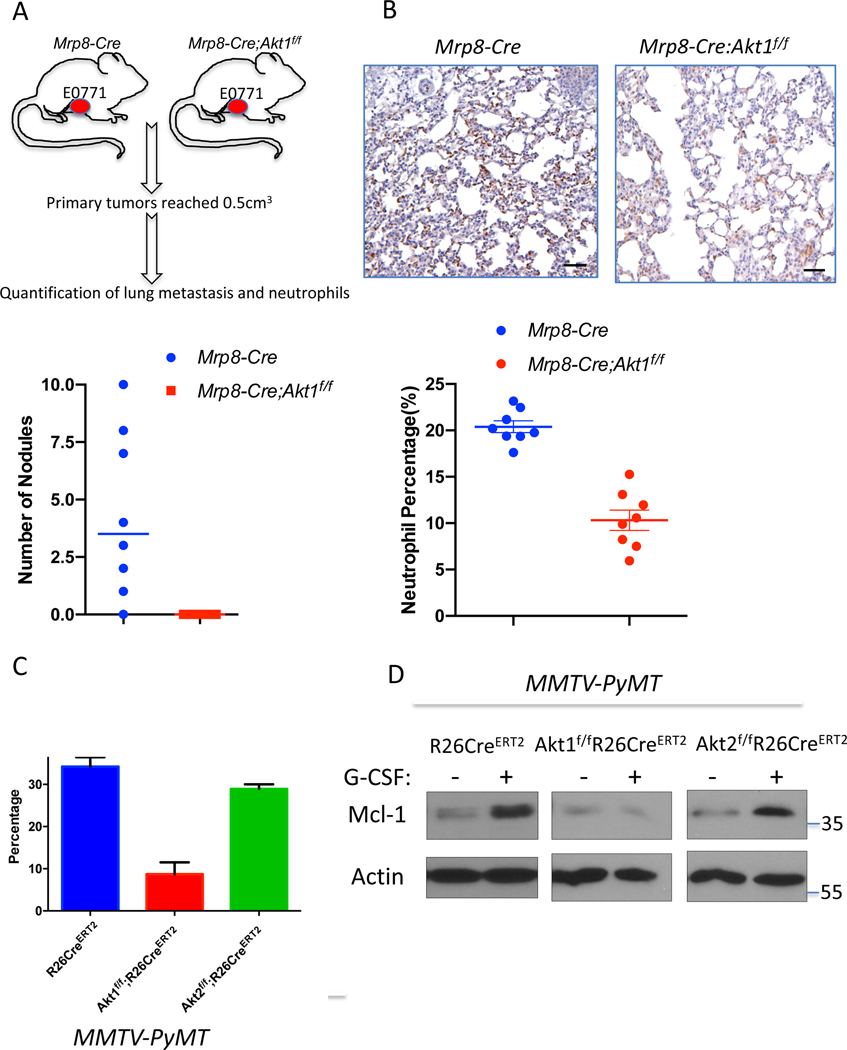
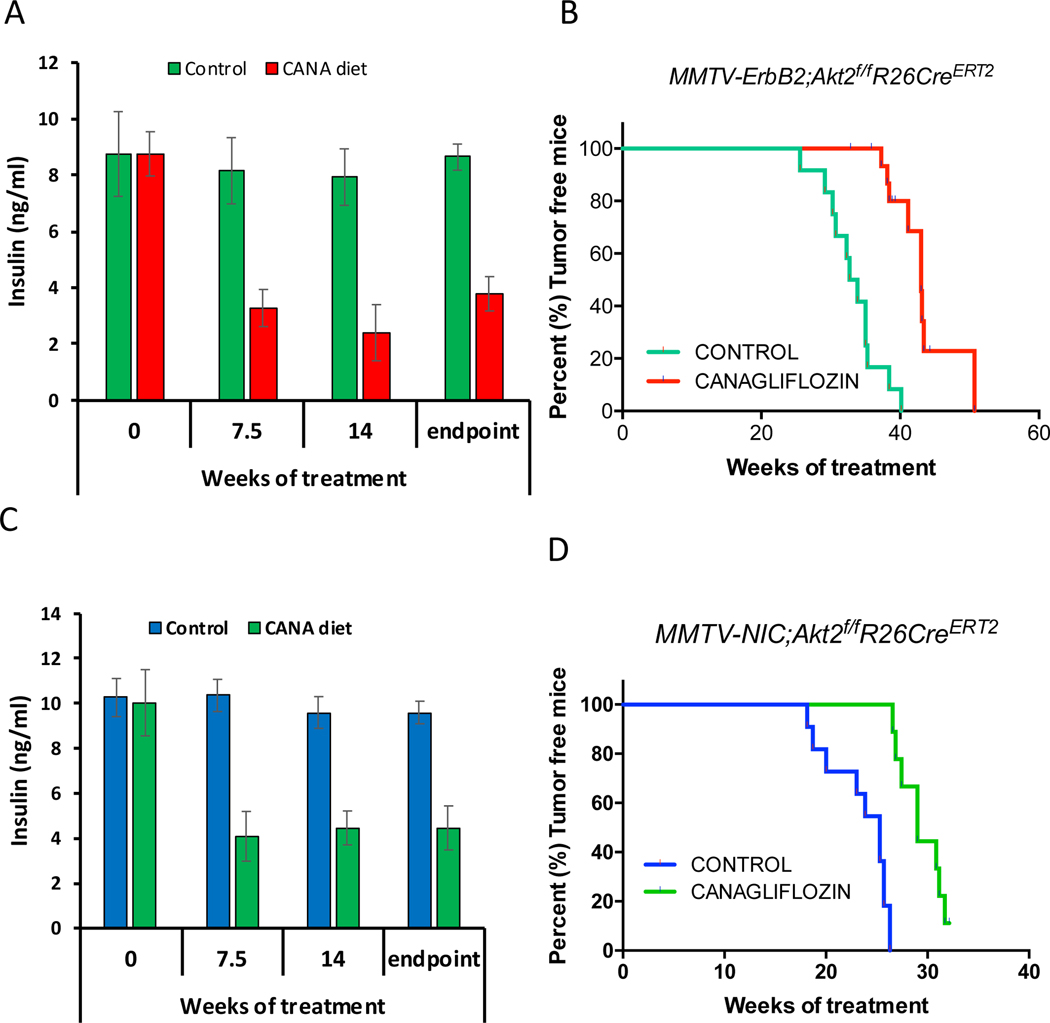
Studies in three mouse models of breast cancer identified profound discrepancies between cell-autonomous and systemic Akt1- or Akt2-inducible deletion on breast cancer tumorigenesis and metastasis. Although systemic Akt1 deletion inhibits metastasis, cell-autonomous Akt1 deletion does not. Single-cell mRNA sequencing revealed that systemic Akt1 deletion maintains the pro-metastatic cluster within primary tumors but ablates pro-metastatic neutrophils. Systemic Akt1 deletion inhibits metastasis by impairing survival and mobilization of tumor-associated neutrophils. Importantly, either systemic or neutrophil-specific Akt1 deletion is sufficient to inhibit metastasis of Akt-proficient tumors. Thus, Akt1-specific inhibition could be therapeutic for breast cancer metastasis regardless of primary tumor origin. Systemic Akt2 deletion does not inhibit and exacerbates mammary tumorigenesis and metastasis, but cell-autonomous Akt2 deletion prevents breast cancer tumorigenesis by ErbB2. Elevated circulating insulin level induced by Akt2 systemic deletion hyperactivates tumor Akt, exacerbating ErbB2-mediated tumorigenesis, curbed by pharmacological reduction of the elevated insulin.

Keywords: Akt1; Akt2; breast cancer; insulin; metastasis; neutrophils; therapy.


Conflict of interest statement

Declaration of Interests The authors declare no competing interests.

Figures

Figure 1:
Figure 1:. The effect of the Akt1 or Akt2 cell autonomous deletion on ErbB2-mediated mammary primary tumors and metastasis.
A. The genotypes of mice and experimental strategy. Mice were euthanized at 5 weeks after tumor palpation, for immunoblotting, and at endpoint when tumors reached 2cm in diameter. B. Kaplan-Meier plots showing percent of tumor free mice as determined by the time tumor is palpated, of MMTV-NIC, MMTV-NIC-Akt1f/f, MMTV-NIC-Akt2f/f and MMTV-NIC-Akt2+/f mice. The number of mice is indicated. p<0.0001 MMTV-NIC versus MMTV-NIC-Akt1f/f and MMTV-NIC-Akt2f/f, p>0.05, MMTV-NIC versus MMTV-NIC-Akt1+/f using the log-rank test. C. Immunoblot showing ErbB2, ErbB3, Akt1 and Akt2 protein expression in the mammary glands of MMTV-NIC, MMTV-NIC;Akt1f/f and MMTV-NIC;Akt2f/f mice. Akt2 is not co-expressed with ErbB2 (see text). D. Luminescent imaging showing luciferase expression in MMTV-NIC;LSL-Luc, MMTV-NIC;Akt1f/f;LSL-Luc, MMTV-NIC;Akt2+/f;LSL-Luc, and MMTV-NIC;Akt2f/f;LSL-Luc mice. E. Representative immunoblot showing the expression of Akt1 and Akt2 during primary tumor development in MMTV-NIC mice. F. Table summarizing the incidence of lung metastasis in MMTV-NIC and MMTV-NIC;Akt1f/f mice. The mice were sacrificed at the primary tumor endpoint, and the lungs were scored for metastasis.
Figure 2:
Figure 2:. Consequences of the systemic deletion of Akt1 or Akt2 after tumor onset in MMTV-ErbB2 mice.
A. The genotypes of mice and experimental strategy. Mice were euthanized at two different time points. At 5 weeks after tumor palpation, to determine relative tumor growth and for immunoblotting, and at endpoint when tumors reached 2cm in diameter. B. Tumor volume at 5 weeks after tamoxifen injection. Data are presented as the means ±SEM. p<0.001 MMTV-ErbB2;Akt1f/f;R26CreERT2 vs. MMTVErbB2;R26CreERT2, p<0.025 MMTV-ErbB2;Akt2f/f;R26CreERT2 vs. MMTV-ErbB2;R26CreERT2, using an unpaired t test. C. Percentage of Ki67-positive cells in tumor sections. Data are presented as the means ± SEM. P=0.017, MMTV-ErbB2;Akt1f/f;R26CreERT2 vs. MMTV-ErbB2;R26CreER. P=0.006, MMTV-ErbB2;Akt2f/f;R26CreERT2 vs. MMTV-ErbB2;R26CreERT2 using an unpaired t test. D. Kaplan-Meier tumor free survival curves as determined by tumor endpoint. P=0.0007, MMTV-ErbB2;Akt1f/f;R26CreERT2 vs. MMTV-ErbB2;R26CreER. P=0.0018, MMTV-ErbB2;Akt2f/f;R26CreERT2 vs. MMTV-ErbB2;R26CreERT2. E. Table summarizing the incidence of lung metastasis. F. Circulating levels of insulin in the absence of or after tamoxifen injection. Data are presented as the means ± SEM. P=0.0005, MMTV-ErbB2;Akt2f/f;R26CreERT2 vs. MMTV-ErbB2;R26CreERT2. G. Quantification of phosphorylated PRAS40, GSK3b, and Akt1(pSer473) relative to total PRAS40, GSK3b, and Akt1 in tumor extracts after tamoxifen injection into MMTV-ErbB2;R26CreERT2 or MMTV-ErbB2;Akt2f/f;R26CreERT2 mice. Data are presented as the means ± SEM. * P<0.03 using an unpaired t test. H. Kaplan-Meier plot showing percentage of tumor-free mice after tamoxifen injection into one-month-old MMTV-NIC;Akt2f/f;R26CreERT2 mice. I. Quantification of phosphorylated Akt1 (ser473), phosphorylated pan-Akt (ser473), phosphorylated PRAS40, and phosphorylated GSK3β, relative to total Akt1, total pan-Akt, total PRAS40, and total GSK3 in tumor extracts. Data are presented as the means ±SEM. * P<0.05 using an unpaired t test.
Figure 3:
Figure 3:. Consequences of systemic deletion of Akt1 or Akt2 after tumor onset in MMTV-PyMT mice.
A. The genotypes of mice and experimental strategy. B. Kaplan-Meier tumor free survival curves as determined by the tumor endpoint. p=0.0092, MMTV-PyMT;Akt1f/f;R26CreERT2 vs. MMTV-PyMT;R26CreERT2. C. Quantification of lung metastatic nodules. Data are presented as the means ± SEM. P=0.0066, MMTV-PyMT;Akt1f/f;R26CreERT2 vs. MMTV-PyMT;R26CreERT2 D. Quantification of lung metastatic nodules after orthotopic transplantation of MMTV-PyMT;Akt1f/f;R26CreERT2 cells into NOG mice in the presence or absence of Akt1. Data are presented as the means ± SEM. P=0.919, using an unpaired t test. E. Quantification of lung metastasis nodules after the orthotopic transplantation of MMTV-PyMT;Akt2f/f;R26CreERT2 cells into NOG mice in the presence or absence of Akt2. Data are presented as the means ± SEM. P=0.789, using an unpaired t test. F. Quantification of phosphorylated PRAS40, GSK3b, and Akt1 relative to total PRAS40, GSK3b, and Akt1 in tumor extracts after tamoxifen injection into MMTV-PyMT;R26CreERT2, MMTV-PyMT;Akt1f/f;R26CreERT2, and MMTV-PyMT;Akt2f/f;R26CreERT2 mice. Data are presented as the means ± SEM. * P<0.05, using an unpaired t test.
Figure 4.
Figure 4.. Analysis of primary and metastatic tumors by scRNA-seq.
A. t-Distributed Stochastic Neighbor Embedding (t-SNE) plot of primary mammary gland tumors in MMTV-PyMT mice. Each cluster is characterized by a unique gene expression signature. A total of 7,791 primary breast tumor cells (N = 5) were used. Clusters 0, 1, 2, 3, 4, 5, 6, 11, and 13 are tumor cells expressing PyMT, whereas the remaining clusters are non-tumor cells. The clusters are color-coded. B. Dot plot showing expression of metastatic markers Ereg, Jag1, Cav1, Adamts1, Tnc, Vim, as well as Krt18, Krt17, Krt8, Krt7, Krt5, and Krt14 across the PyMT primary tumor clusters. C. tSNE plot of 3,979 metastatic tumor cells in the lung (N = 3). Clusters 0, 1, 4, 5 and 11 are PyMT-positive. D. Dot plot depicting expression of Prok2, Vegfa, Mmp9, Mmp8, S100a9, S100a8, and the prometastatic marker Krt14 across the clusters in the lung metastatic scRNA-seq analysis. E. Dot plot in the primary non-tumor clusters indicate that cluster 10 has a predominant gene expression profile of neutrophil markers Prok2, Vegfa, Mmp9, Mmp8, S100a9, S100a8. F. Graph showing the average number of pro-metastatic Krt14-positive cells for every 5,000 PyMT-positive tumor cells based on the scRNA-seq results. N(MMTV-PyMT) = 5, N(MMTV-PyMT; Akt1f/f) = 3, N(MMTV-PyMT; Akt2f/f) = 3. N. S = not significant (p>0.05). One-way analysis of variance (ANOVA) was used to calculate significance. G. Graph showing the average number of infiltrating neutrophils in each genotype. scRNA-seq reveals the absence of neutrophil cells in primary systemic Akt1 knockout tumors across all 3 biological replicates. N(MMTV-PyMT) = 5, N(MMTV-PyMT; Akt1f/f) = 3, N(MMTV-PyMT; Akt2f/f) = 3. N.S = not significant (p>0.05). One-way ANOVA was used to calculate significance. Error bars represent standard error.
Figure 5.
Figure 5.. The effect of the systemic Akt1 or Akt2 deletion on neutrophil accumulation in the lungs of tumor-bearing mice.
A. Percentage of neutrophils in the lungs of nontumor-bearing mice after tamoxifen injection to systemically delete Akt1 or Akt2. The percentage of neutrophils was calculated by counting the number of Ly6G-positive cells relative to total hematoxylin and eosin-stained cells in lung tissue at endpoint sections as described in the Methods section. Data are presented as the means +/− SEM. P= 0.3, using unpaired t test. B. Quantification of lung neutrophils in control MMTV-PyMT mice and after systemic deletion of Akt1 or Akt2 at endpoint. Left: Representative lung section images stained with anti-Ly6G. Right: Quantification was performed after the primary tumors reached the endpoint. Data are presented as the means ± SEM. P=0.0066, MMTV-PyMT;Akt1f/f;R26CreERT2 vs. MMTV-PyMT;R26CreERT2 and p=0.518, MMTV-PyMT;Akt2f/f;R26CreERT2 vs. MMTV-PyMT;R26CreERT2 using an unpaired t test. Quantification of metastatic nodules (C) and neutrophils (D) in the lungs of R26CreERT2 and Akt1f/f;R26CreERT2 mice, which were orthotopically transplanted with MMTV-PyMT (WT) tumor cells and injected with tamoxifen at palpation. Upper panel shows schematic of experimental design. Quantification was performed when the primary tumors reached the endpoint. Data are presented as the means ±SEM. P=0.019 for metastatic nodules, and P=0.0034 for neutrophils using an unpaired t test. Quantification of metastatic nodules (E) and neutrophils (F) in the lungs of R26CreERT2 and Akt2f/f;R26CreERT2 mice, which were orthotopically transplanted with MMTV-PyMT (WT) tumor cells and injected with tamoxifen at palpation. Upper panel shows schematic of experimental design. Quantification was performed when the primary tumors reached the endpoint. Data are presented as the means ±SEM. P>0.05 for metastatic nodules and neutrophils using an unpaired t test.
Figure 6.
Figure 6.. Consequences of Akt isoform deletion in the neutrophils of tumor-bearing mice.
A. The effect of Akt1 deletion on metastasis in MRP8-Cre mice after orthotopic transplantation of E0771 cells. Upper panel: Schematic of experimental design. Bottom panel: Quantification of metastasis. B. The effect of Akt1 deletion on neutrophils in the lungs of MRP8-Cre tumor-bearing mice (n=8). Upper panels show representative lung section images stained with anti-Ly6G. Data are presented as the means ±SEM. P<0.0001, for metastatic nodules and neutrophils using an unpaired t test. C. The effect of G-CSF on the survival of neutrophils isolated from control, and systemically deleted Akt1 and Akt2 tumor-bearing mice. Data are presented as the mean ± SEM. p=0.0055 for Akt1f/f;R26CreERT2 versus R26CreERT2 and p=0.099 for Akt2f/f;R26CreERT2 versus R26CreERT2. D. The effect of G-CSF on the level of MCL1 in neutrophils isolated from control and systemically deleted Akt1 and Akt2 tumor-bearing mice.
Figure 7.
Figure 7.. Reducing circulating levels of insulin by SGLT2 inhibitor attenuates the mammary gland tumorigenesis after systemic Akt2 deletion.
MMTV-ErbB2;Akt2f/f;R26CreERT2 or MMTV-ErbB2;Akt2f/f;R26CreERT2 mice were injected with tamoxifen at 6 weeks of age and were subjected to either control chow diet or diet that includes canagliflozin (CANA). A,C. Insulin level at the indicated time points after chow diet or CANA diet. B,D. Kaplan-Meier curves showing percentage of tumor free mice after chow diet or CANA diet.

References

    1. Abram CL, Roberge GL, Hu Y, and Lowell CA (2014). Comparative analysis of the efficiency and specificity of myeloid-Cre deleting strains using ROSA-EYFP reporter mice. J Immunol Methods 408, 89–100. - PMC - PubMed
    1. Butler A, Hoffman P, Smibert P, Papalexi E, and Satija R. (2018). Integrating single-cell transcriptomic data across different conditions, technologies, and species. Nat Biotechnol 36, 411–420. - PMC - PubMed
    1. Chen J, Tang H, Hay N, Xu J, and Ye RD (2010). Akt isoforms differentially regulate neutrophil functions. Blood 115, 4237–4246. - PMC - PubMed
    1. Cheung KJ, Padmanaban V, Silvestri V, Schipper K, Cohen JD, Fairchild AN, Gorin MA, Verdone JE, Pienta KJ, Bader JS, and Ewald AJ (2016). Polyclonal breast cancer metastases arise from collective dissemination of keratin 14-expressing tumor cell clusters. Proc Natl Acad Sci U S A 113, E854–863. - PMC - PubMed
    1. Ciriello G, Gatza ML, Beck AH, Wilkerson MD, Rhie SK, Pastore A, Zhang H, McLellan M, Yau C, Kandoth C, et al. (2015). Comprehensive Molecular Portraits of Invasive Lobular Breast Cancer. Cell 163, 506–519. - PMC - PubMed

Publication types