. 2020 Nov 11;108(3):451-468.e9.
doi: 10.1016/j.neuron.2020.08.002. Epub 2020 Sep 14.

Sensory Experience Engages Microglia to Shape Neural Connectivity through a Non-Phagocytic Mechanism

Affiliations

Sensory Experience Engages Microglia to Shape Neural Connectivity through a Non-Phagocytic Mechanism

Lucas Cheadle et al. Neuron. .

Abstract

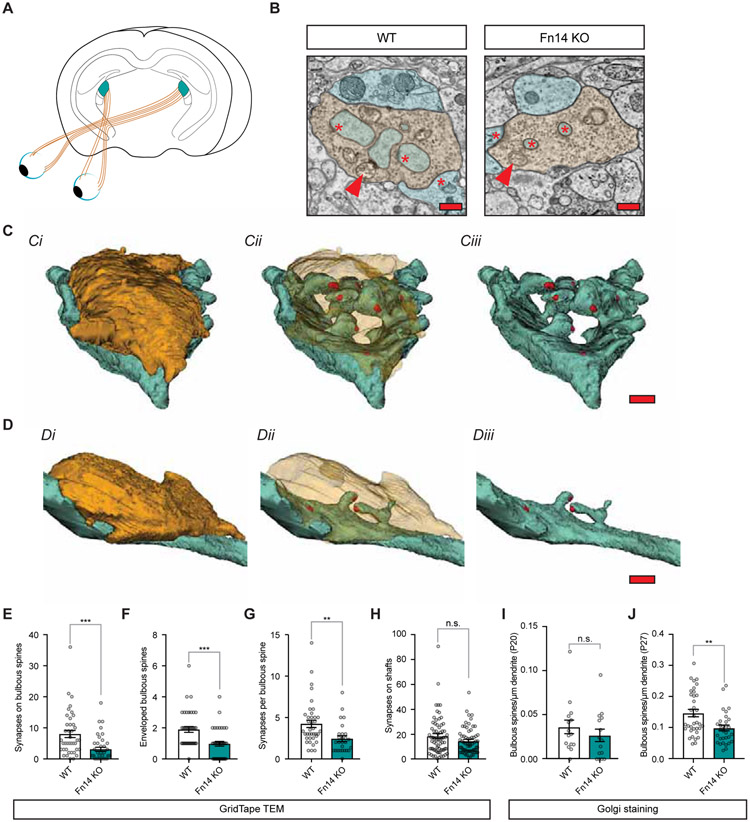
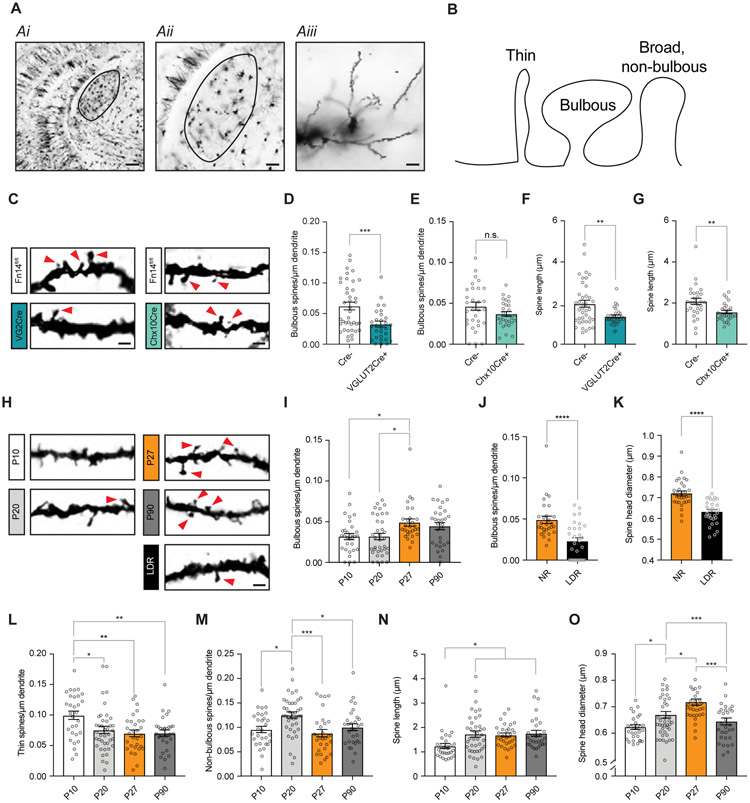
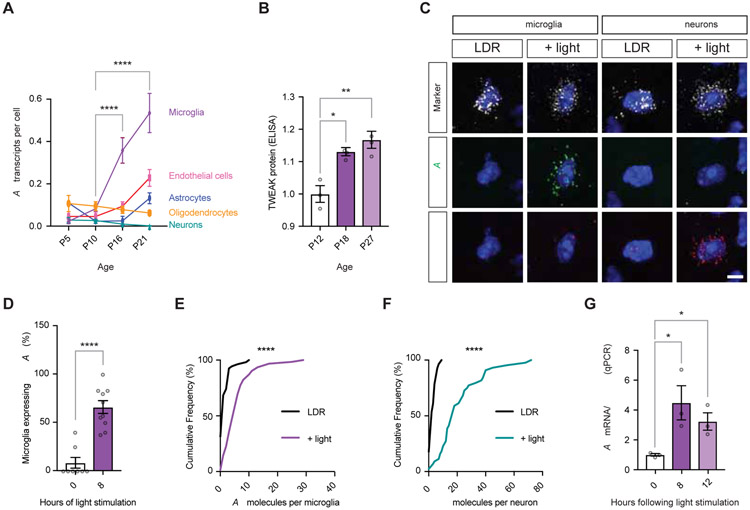
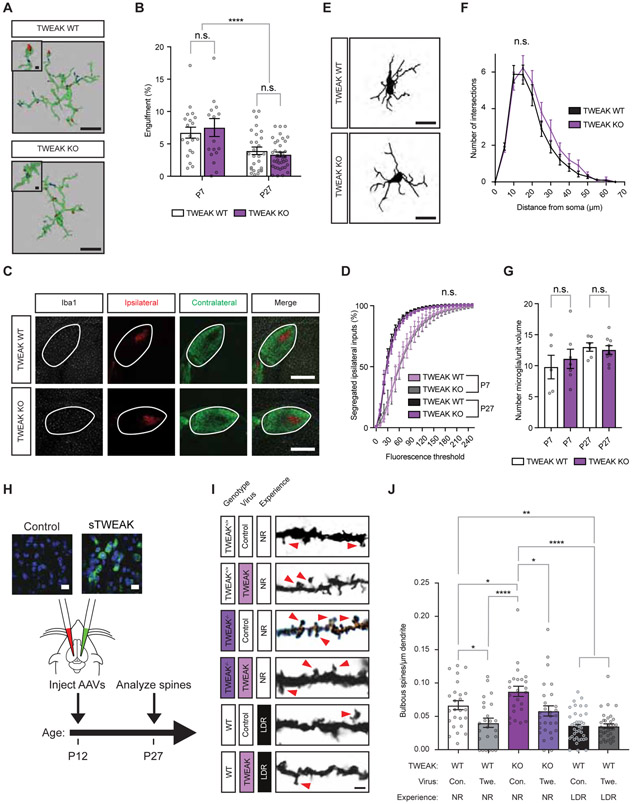
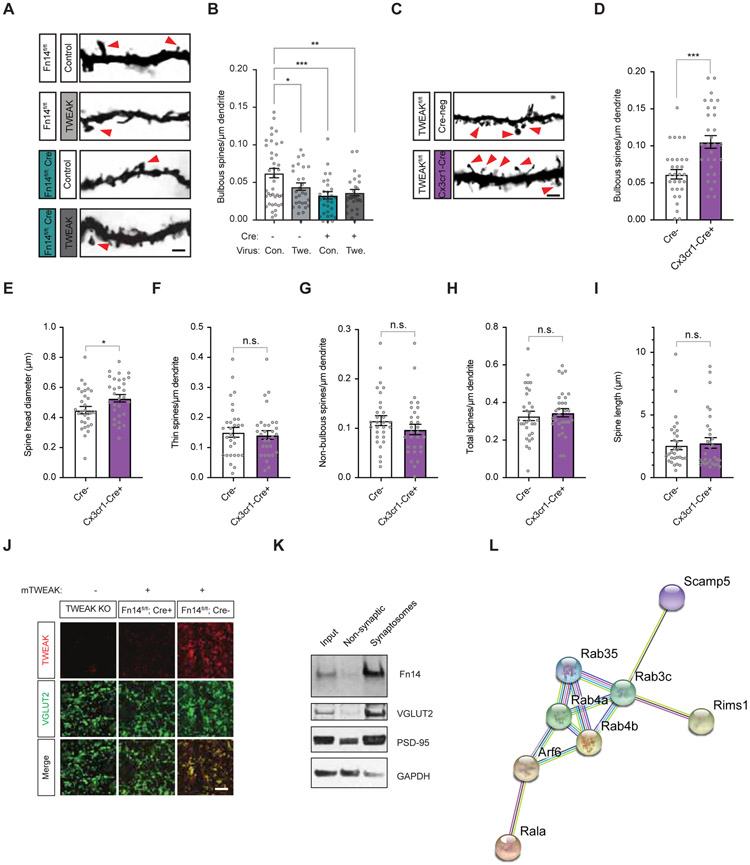
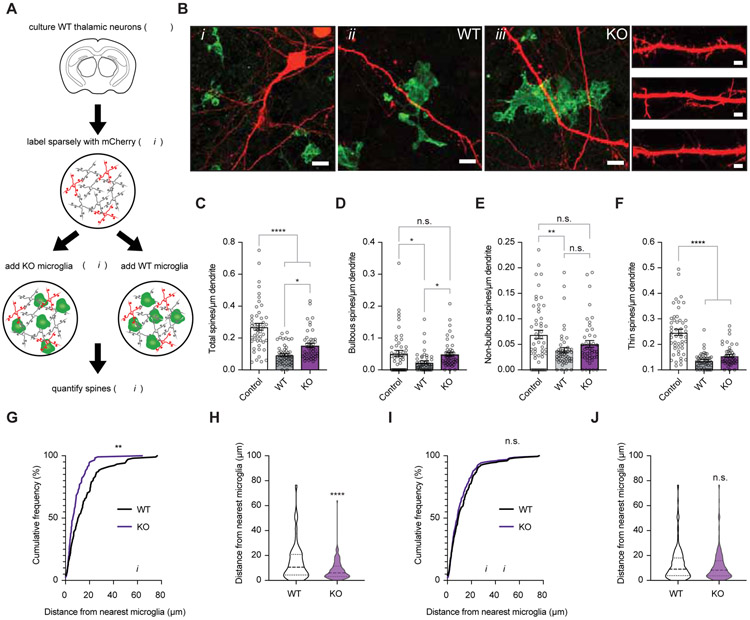
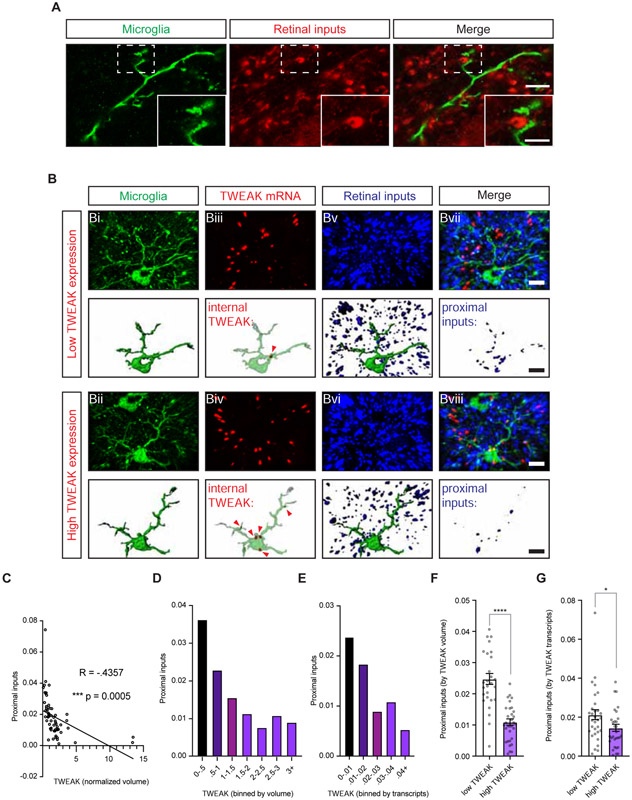
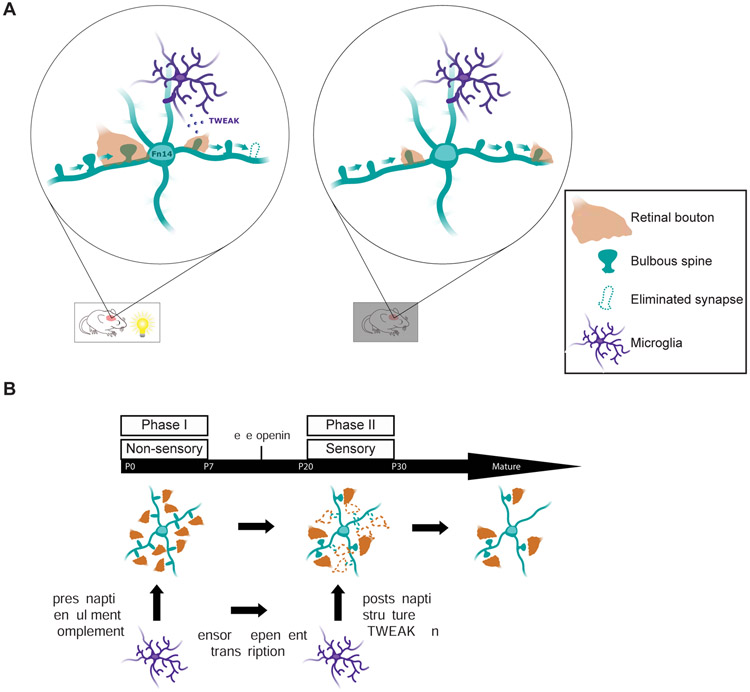
Sensory experience remodels neural circuits in the early postnatal brain through mechanisms that remain to be elucidated. Applying a new method of ultrastructural analysis to the retinogeniculate circuit, we find that visual experience alters the number and structure of synapses between the retina and the thalamus. These changes require vision-dependent transcription of the receptor Fn14 in thalamic relay neurons and the induction of its ligand TWEAK in microglia. Fn14 functions to increase the number of bulbous spine-associated synapses at retinogeniculate connections, likely contributing to the strengthening of the circuit that occurs in response to visual experience. However, at retinogeniculate connections near TWEAK-expressing microglia, TWEAK signals via Fn14 to restrict the number of bulbous spines on relay neurons, leading to the elimination of a subset of connections. Thus, TWEAK and Fn14 represent an intercellular signaling axis through which microglia shape retinogeniculate connectivity in response to sensory experience.

Keywords: dendritic spine; development; microglia; pruning; sensory experience; synapse; synaptic refinement.


Conflict of interest statement

Declaration of Interests L.C.B. and K.A.E. are employees and shareholders of Biogen.

Figures

Figure 1.
Figure 1.. Sensory experience increases the number of spine-associated synapses through Fn14.
(A) Schematic of the retinogeniculate circuit. Axons of retinal ganglion cells (RGCs; orange) synapse onto relay neurons of the dorsal lateral geniculate nucleus (dLGN) of the thalamus (teal). (B) Single panel cross-sections of retinogeniculate connections in Fn14 knockout (KO) and wildtype (WT) mice identified by GridTape. Synapses, red asterisks; dendrites, blue; spines, teal; boutons, orange; arrows, mitochondria. Scale bar, 500 nm. (C) Three-dimensional reconstruction of a RGC bouton (orange) converging upon relay neuron dendrites (blue) and spines (teal) in the WT mouse. Synapses in red. Ci, Opague bouton; Cii, Transparent bouton; Ciii, No bouton. Scale bar, 500 nm. (D) Reconstruction of a retinogeniculate connection in the Fn14 KO mouse, color conventions and figure organization as described in (C). Scale bar, 500 nm. (E) The number of bulbous-spine-associated synapses is decreased in the Fn14 KO mouse compared to WT. (F) The number of bulbous spines enveloped by RGC boutons is decreased in the Fn14 KO mouse compared to WT. (G) The number of synapses per bulbous spine is decreased in the Fn14 KO mouse compared to WT. (H) The number of synapses on dendritic shafts is unaffected by loss of Fn14. (I) The density of bulbous spines as measured by Golgi staining is unaffected by loss of Fn14 at P20. (J) The density of bulbous spines as measured by Golgi staining is significantly decreased in constitutive Fn14 KO mice at P27. Student’s t-test. **p < 0.01; ***p < 0.001. Means plotted with individual data points, +/− S.E.M. N values in STAR methods.
Figure 2.
Figure 2.. Developmental changes in spines require experience and postsynaptic Fn14.
(A) Low- and high-magnification images of a Golgi-stained brain section centered on the dLGN (outlined). Scale bars, 200 (Ai), 100 (Aii), and 10 (Aiii) μm. (B) Schematic of spine types defined in the study. (C) Example images of Golgi-stained spines in Fn14fl/fl; VGLUT2-Cre mice, Fn14fl/fl; Chx10-Cre mice, and Cre-negative littermates at P27. As in other panels, contrast increased to better display spine morphology. Arrows, bulbous spines. Scale bar, 2 μm. (D) Bulbous spine density is decreased by genetic ablation of Fn14 in postsynaptic relay neurons. (E) Bulbous spine density is unaffected by genetic ablation of Fn14 in presynaptic RGCs. (F) Spine length is decreased by genetic ablation of Fn14 in relay neurons. (G) Spine length is decreased by genetic ablation of Fn14 in RGCs. (H) Examples of Golgi-stained dendrites and spines analyzed across postnatal development and in animals subjected to late-dark-rearing (LDR). Arrows, bulbous spines. Scale bar, 2 μm. (I) Bulbous spine density increases between P20 and P27 in wildtype (WT) mice. (J) Bulbous spine density is significantly decreased in LDR mice compared to normally reared (NR) mice. (K) Spine head diameter across all spine types is decreased by LDR. (L) Thin spine density decreases between P10 and P20 in WT mice. (M) Non-bulbous spine density increases between P10 and P20 then decreases between P20 and P27 in WT mice. (N) Spine length across all spine types increases during development. (O) Spine head diameter increases between P10 and P27 in WT mice. Statistical analysis for (D) – (G), (J), and (K), Student’s t-test. (I) and (L) - (O), One-way ANOVA with Tukey’s post hoc comparison. *p < 0.05; **p < 0.01; ***p < 0.001; ****p < 0.0001. Means plotted with individual data points, +/− S.E.M.
Figure 3.
Figure 3.. Experience drives the expression of TWEAK in microglia and Fn14 in relay neurons.
(A) Single-cell RNA-sequencing analysis of TWEAK expression across postnatal development in the dLGN. Y-axis, TWEAK mRNA transcripts per cell. X-axis, age. (B) TWEAK protein levels as measured by ELISA increase across postnatal development. Levels normalized to P12. (C) Confocal images of mRNA expression in the dLGNs of mice subjected to late-dark-rearing (LDR; unstimulated controls) or mice subjected to LDR then acutely re-exposed to light for eight hours (+ light). Sections were probed for markers of either microglia (Cx3cr1) or relay neurons (VGLUT2)(white), TWEAK (green), and Fn14 (red). Scale bar, 5 μm. (D) Percentage of microglia expressing at least 3 TWEAK mRNA molecules is significantly increased in light-stimulated mice. (E) Cumulative frequency distribution plot displaying increased TWEAK expression per microglia following light re-exposure. (F) Cumulative frequency distribution plot displaying increased Fn14 expression per relay neuron following light re-exposure. (G) qPCR quantification of TWEAK expression in microglia isolated from the visual cortices of mice following LDR and light re-exposure for eight or twelve hours. TWEAK expression normalized to Cx3cr1 expression to account for variability in enrichment efficiency. Statistical analysis (A), (B), and (G): One-way ANOVA with Tukey’s post hoc comparison. (D), Student’s t-test. (E) and (F), Kolmogorov-Smirnov distribution test. *p < 0.05; **p < 0.01; ****p < 0.0001. Means plotted with individual data points, +/− S.E.M.
Figure 4.
Figure 4.. TWEAK promotes experience-dependent spine loss through a non-phagocytic mechanism.
(A) Surface renderings of microglia (green) containing phagocytosed retinal boutons (blue and red) labeled by ocular injection of fluorophore-conjugated tracers in mice at P27. Microglial reconstructions based upon a combination of Iba-1 and P2ry12 marker immunostaining. Scale bars, 10 μm (inset, 1 μm). (B) Quantification of the volume of individual microglia occupied by retinal inputs, plotted as the percentage of a given microglial cell occupied. (C) Confocal images of fluorescently labeled RGC boutons in contralateral (green) and ipsilateral (red) dLGN. Microglia immunostained for Iba-1 shown in white. Scale bar, 400 μm. (D) Quantification of the overlap between ipsi- and contralateral inputs measured by co-localized signal in Imaris. (E) Example tracings of microglia analyzed by Sholl morphological analysis. Scale bar, 10 μm. (F) Sholl analysis of morphological complexity indicating the number of microglial projections intersecting with a series of concentric circles radiating outward from the soma. (G) Quantification of the number of microglia per dLGN volume based upon Iba-1 staining. (H) Schematic of the viral overexpression experiments probing the role of TWEAK in spine development. Inset, fluorescence in situ hybridization probing for TWEAK mRNA (green). Scale bar, 12 μm. (I) Example images of dendritic spines in the dLGNs of TWEAK KO and WT mice of different genotypes following viral infection. Arrows, bulbous spines. Scale bar, 2 μm. (J) Quantification of bulbous spine densities in TWEAK KO and WT mice following viral infection, with or without experience. Con., control virus. Twe., TWEAK virus. NR, normally reared. LDR, late-dark-reared. Statistical analysis: One-way ANOVA with Tukey’s post hoc comparison. *p < 0.05; **p < 0.01; ****p < 0.0001. Means plotted with individual data points, +/− S.E.M.
Figure 5.
Figure 5.. Microglial TWEAK signals through postsynaptic Fn14 to decrease bulbous spine number.
(A) Example images of spines in the dLGNs of Fn14fl/fl Cre-negative or VGLUT2-Cre-positive mice following viral infection. Scale bar, 2 μm. (B) Quantification of bulbous spine densities following TWEAK or mCherry expression in the dLGNs of Cre-negative (−) and VGLUT2-Cre-positive (+) mice. Comparison between mCherry-infected conditions also plotted in Fig. 2D. Con., control virus. Twe., TWEAK virus. (C) Example images of spines in the dLGNs of TWEAKfl/fl Cre-negative or Cx3cr1-Cre-positive mice. Scale bar, 2 μm. (D) Bulbous spine density is increased by genetic ablation of TWEAK in microglia. (E) Spine head diameter is increased by genetic ablation of TWEAK in microglia. (F) Thin spine density is unaffected by genetic ablation of TWEAK in microglia. (G) Non-bulbous spine density is unaffected by genetic ablation of TWEAK in microglia. (H) Total spine density is unaffected by genetic ablation of TWEAK in microglia. (I) Spine length is unaffected by genetic ablation of TWEAK in microglia. (J) Confocal images of dLGNs from a TWEAK KO mouse, a Fn14fl/fl Cre-negative mouse, and a Fn14fl/fl; VGLUT2-Cre+ mouse following bath application of recombinant mouse TWEAK and subsequent immunostaining for TWEAK (red) and VGLUT2 (green). Scale bar, 10 μm. (K) Western blot of whole mouse forebrain fractionated to enrich for synaptosomes. Blots probed for Fn14, the retinal presynaptic marker VGLUT2, the postsynaptic marker PSD-95, and GAPDH, a non-synaptic control. (L) Functional protein association network determined by STRING analysis illustrating known and predicted interactions between proteins identified as potential Fn14 interactors by mass spectrometry. Statistical analysis: (B), One-way ANOVA with Tukey’s post hoc comparison; (D) – (I), Student’s t-test. *p < 0.05; **p < 0.01; ***p < 0.001. Means plotted with individual data points, +/− S.E.M.
Figure 6.
Figure 6.. Microglial TWEAK selectively eliminates proximal bulbous spines in vitro.
(A) Schematic of the in vitro co-culture experiment. Neurons from embryonic thalami (thal.) were sparsely transfected to express mCherry then seeded with microglia isolated from TWEAK knockout (KO); Cx3cr1-GFP or wildtype (WT); Cx3cr1-GFP mice. Spines were analyzed 24 hours later. (B) Confocal images of neurons (red) co-cultured with TWEAK KO or WT microglia (green). Bi, mCherry-filled neuron contacted by WT GFP+ microglia. Scale bar, 15 μm. Bii, example of a WT microglia contacting the dendrite of a neuron. Scale bar, 5 μm. Biii, example of a TWEAK KO microglia contacting the dendrite of a neuron. Scale bar, 5 μm. Dendrites with spines from each condition, Scale bar, 2 μm. (C) Total spine density in cultures without microglia (control) or with TWEAK WT or TWEAK KO microglia. Neurons co-cultured with TWEAK KO microglia maintained significantly more spines than those co-cultured with WT microglia. (D) Quantification of bulbous spine density reveals that bulbous spines are protected when microglial TWEAK is ablated. (E) Quantification of non-bulbous spine density in co-cultures. (F) Quantification of thin spine density in co-cultures. (G) Cumulative frequency distribution plot reflecting the proximity of bulbous spines to the nearest microglia with or without TWEAK expression. Bulbous spines were maintained closer to microglia when microglia lacked TWEAK. (H) Violin plot reflecting median (dashed line) and quartile values (dotted lines) of the distance between bulbous spines and microglia with or without TWEAK. (I) Cumulative frequency distribution plot reflecting the proximity of thin spines to the nearest microglia in the co-cultures with WT microglia (black) or TWEAK KO microglia (purple). (J) Violin plot reflecting median (dashed line) and quartile values (dotted lines) of the distance between thin spines and microglia with or without TWEAK. Means plotted with individual data points +/− S.E.M. Statistical analysis, One-way ANOVA with Tukey’s post hoc comparison. Statistical analysis (G) and (I), Kolmogorov-Smirnov distribution comparison. (H) and (J), Student’s T-test. *p < 0.05; **p < 0.01; ****p < 0.0001.
Figure 7.
Figure 7.. Synapse number is negatively correlated with the level of TWEAK expression in nearby microglia.
(A) Stimulated emission depletion (STED) microscopy images of a microglial cell process visualized by immunostaining for both Iba-1 and P2ry12 (green) within nanometer distance of VGLUT2-immunostained retinogeniculate synapses (red). Scale bar, 4 μm; inset, 2 μm. (B) Confocal images and volumetric reconstructions of microglia (Iba-1 and P2ry12, Bi and Bii), TWEAK mRNA (Biii and Biv, red), and retinogeniculate synapses (VGLUT2, Bv and Bvi, blue). Bvii and Bviii, channels merged. Arrows mark TWEAK mRNA transcripts within microglia. Top rows, a microglia expressing only 1 mRNA of TWEAK. Bottom rows, a microglia expressing 5 mRNAs of TWEAK. Scale bar, 5 μm. (C) Scatter plot of TWEAK expression (x-axis) and proximal retinogeniculate synapses (y-axis). (D) Bar graph displaying the number of proximal retinogeniculate synapses (y-axis) corresponding with increasing expression of TWEAK mRNA volume binned as shown. (E) Bar graph displaying the number of proximal retinogeniculate synapses (y-axis) corresponding with increasing number of TWEAK mRNA transcripts binned as shown. (F) Comparison of proximal synapses in microglia expressing less than the median level of TWEAK (low TWEAK) vs. those expressing greater than the median level of TWEAK (high TWEAK) assigned based upon microglial volume occupied by mRNA signal. (G) Same as (F) but mRNA plotted as transcripts per microglia. Values normalized to microglial volume. (C) Pearson’s correlation coefficient R = −.4357. ***p < 0.001. (F) and (G), Student’s t-test. *p < 0.05; ***p < 0.001. (F) and (G), means plotted with individual data points, +/− S.E.M. (D) and (E), average proximal input value across microglia per bin.
Figure 8.
Figure 8.. Model of TWEAK/Fn14-dependent synapse regulation during experience-dependent refinement.
(A) Schematic of retinal inputs (orange) converging onto the dendrites of a relay neuron (teal). Alone, Fn14 increases bulbous spines to strengthen and maintain synapses, while TWEAK binding at other synapses leads to their ultimate disassembly. In the absence of experience, neither TWEAK nor Fn14 is expressed so neither of these processes occur and synapses remain in a weakened state but are not properly removed. (B) We propose that the sensory-dependent period of postsynaptic regulation by microglia identified in this study constitutes a later phase of microglia-driven circuit-sculpting that follows earlier phases of phagocytic pruning and is driven by distinct molecular mechanisms.

Comment in

References

    1. Akiyoshi R, Wake H, Kato D, Horiuchi H, Ono R, Ikegami A, Haruwaka K, Omori T, Tachibana Y, Moorhouse AJ, et al. (2018). Microglia Enhance Synapse Activity to Promote Local Network Synchronization. eNeuro 5. - PMC - PubMed
    1. Assali A, Le Magueresse C, Bennis M, Nicol X, Gaspar P, and Rebsam A (2017). RIM1/2 in retinal ganglion cells are required for the refinement of ipsilateral axons and eye-specific segregation. Sci Rep 7, 3236. - PMC - PubMed
    1. Berry KP, and Nedivi E (2017). Spine Dynamics: Are They All the Same? Neuron 96, 43–55. - PMC - PubMed
    1. Cardona AE, Huang D, Sasse ME, and Ransohoff RM (2006). Isolation of murine microglial cells for RNA analysis or flow cytometry. Nat Protoc 1, 1947–1951. - PubMed
    1. Cheadle L, Tzeng CP, Kalish BT, Harmin DA, Rivera S, Ling E, Nagy MA, Hrvatin S, Hu L, Stroud H, et al. (2018). Visual Experience-Dependent Expression of Fn14 Is Required for Retinogeniculate Refinement. Neuron 99, 525–539 e510. - PMC - PubMed

Publication types

LinkOut - more resources