. 2021;11(2):407-431.
doi: 10.1016/j.jcmgh.2020.09.003. Epub 2020 Sep 12.

Cancer-Associated Fibroblasts Provide a Stromal Niche for Liver Cancer Organoids That Confers Trophic Effects and Therapy Resistance

Affiliations

Cancer-Associated Fibroblasts Provide a Stromal Niche for Liver Cancer Organoids That Confers Trophic Effects and Therapy Resistance

Jiaye Liu et al. Cell Mol Gastroenterol Hepatol. 2021.

Abstract

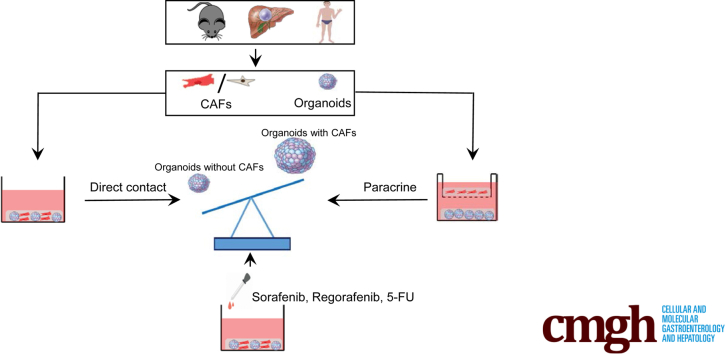
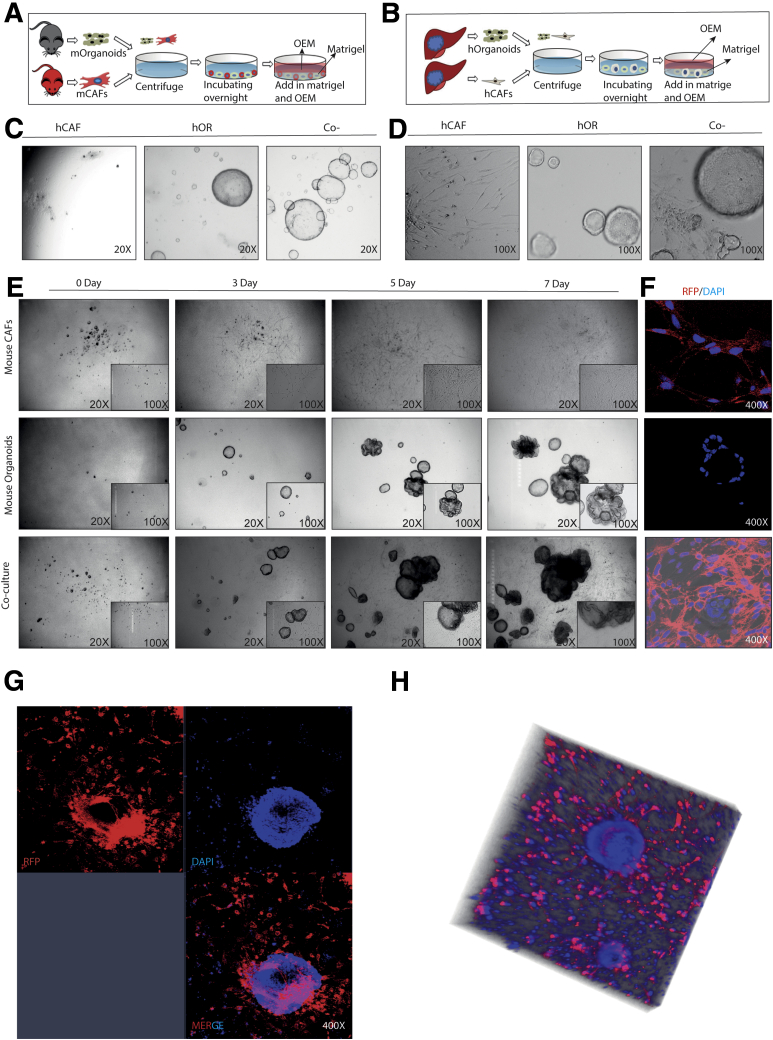
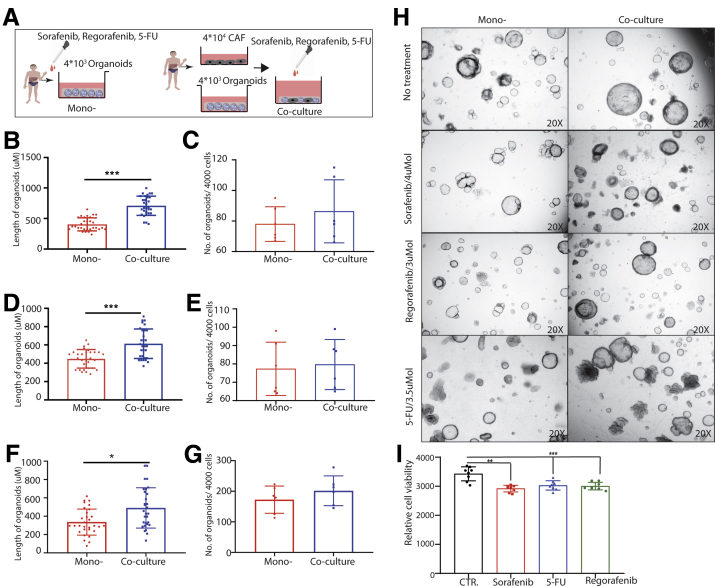
Background & aims: Cancer-associated fibroblasts (CAFs) play a key role in the cancer process, but the research progress is hampered by the paucity of preclinical models that are essential for mechanistic dissection of cancer cell-CAF interactions. Here, we aimed to establish 3-dimensional (3D) organotypic co-cultures of primary liver tumor-derived organoids with CAFs, and to understand their interactions and the response to treatment.

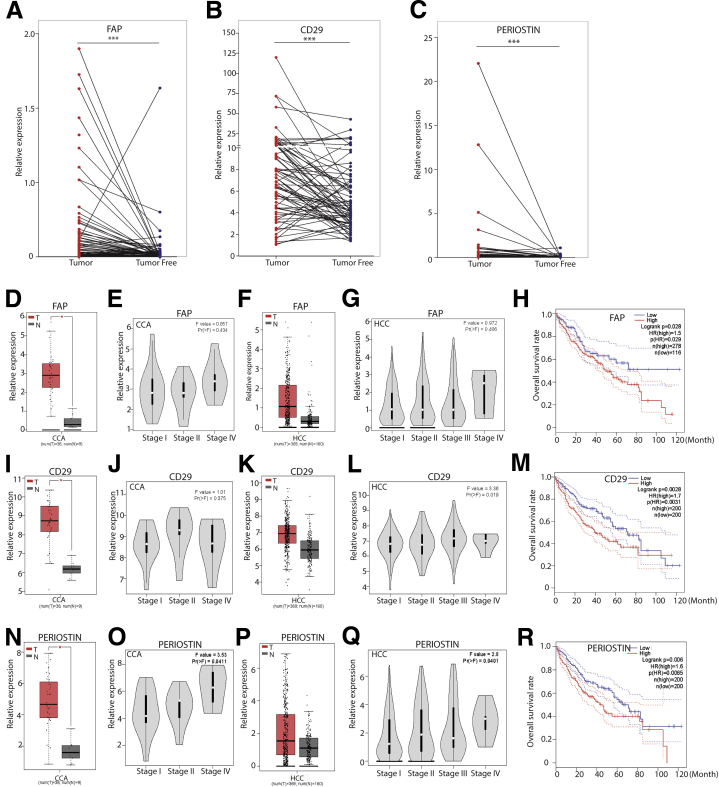
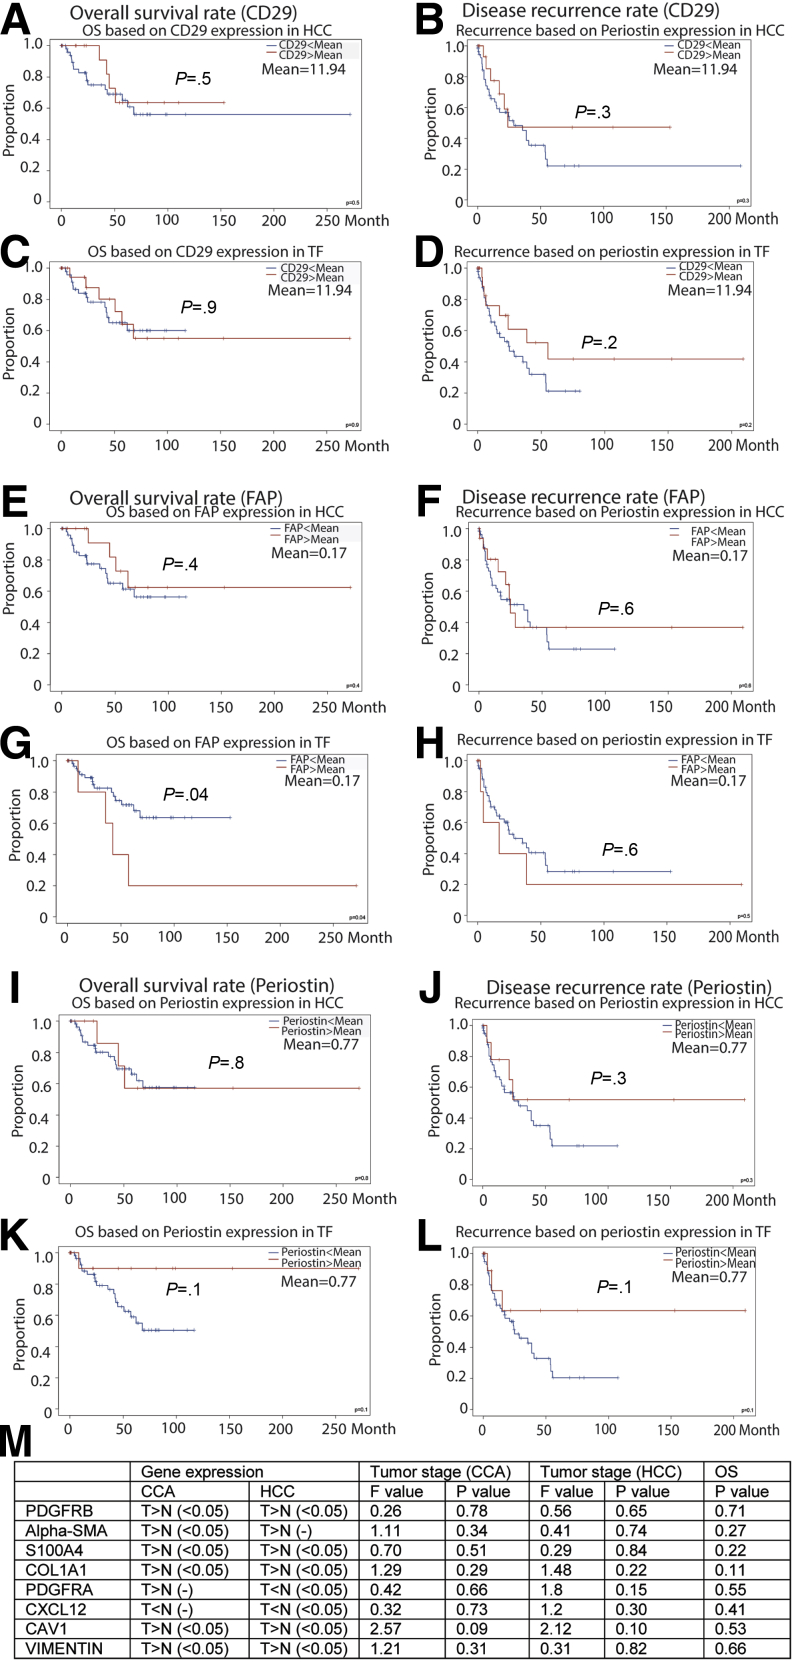
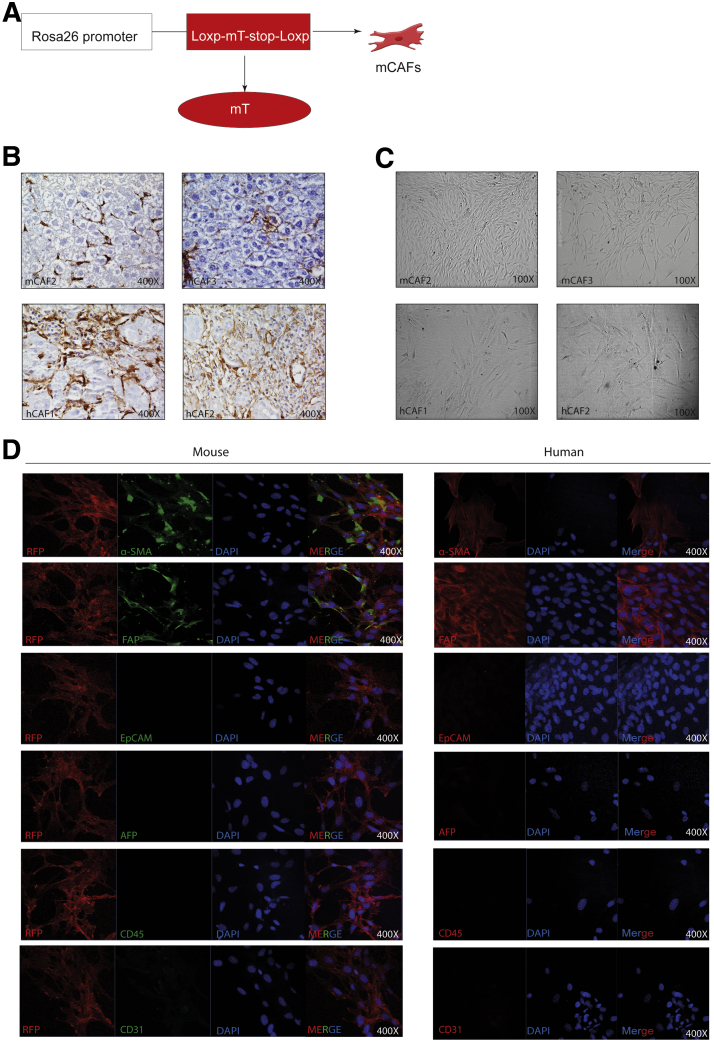
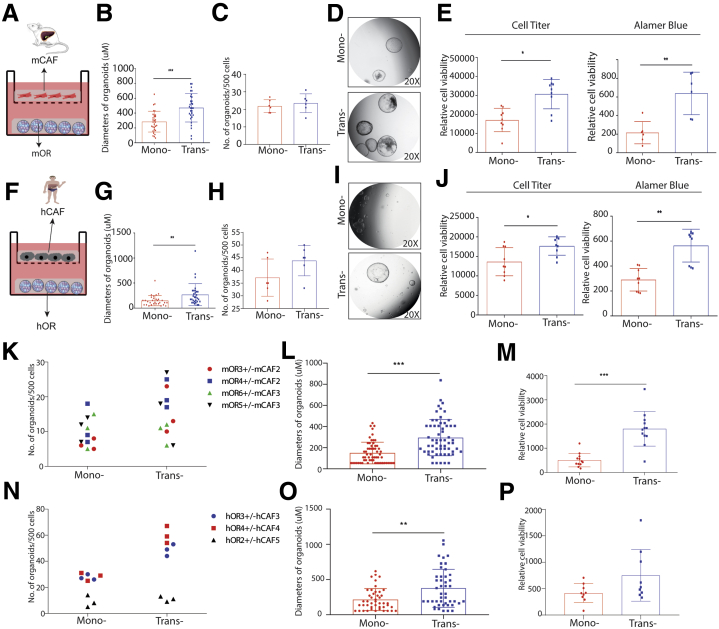
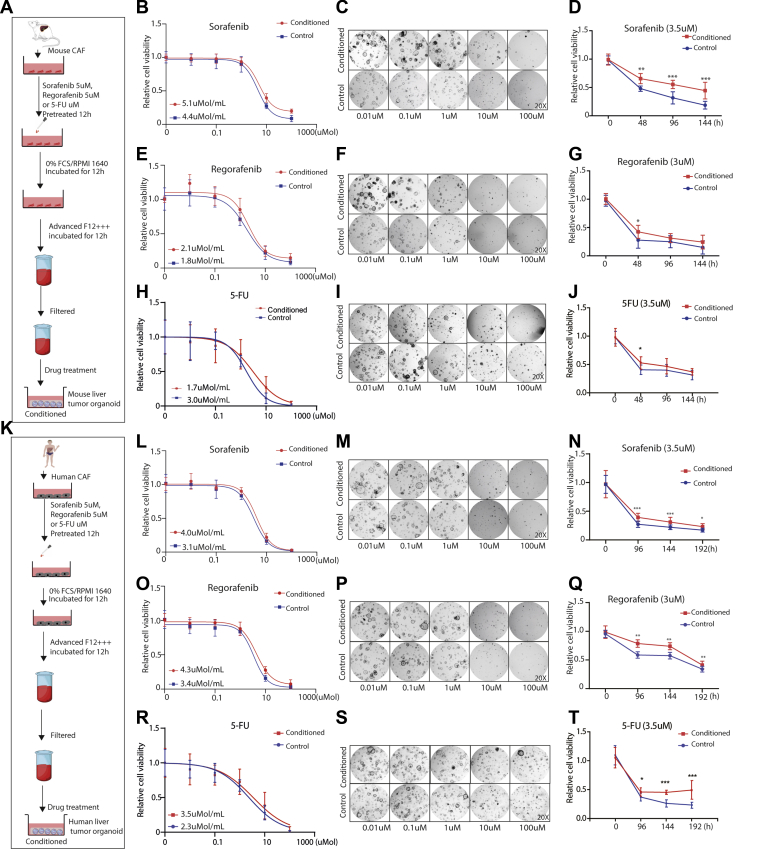
Methods: Liver tumor organoids and CAFs were cultured from murine and human primary liver tumors. 3D co-culture models of tumor organoids with CAFs and Transwell culture systems were established in vitro. A xenograft model was used to investigate the cell-cell interactions in vivo. Gene expression analysis of CAF markers in our hepatocellular carcinoma cohort and an online liver cancer database indicated the clinical relevance of CAFs.

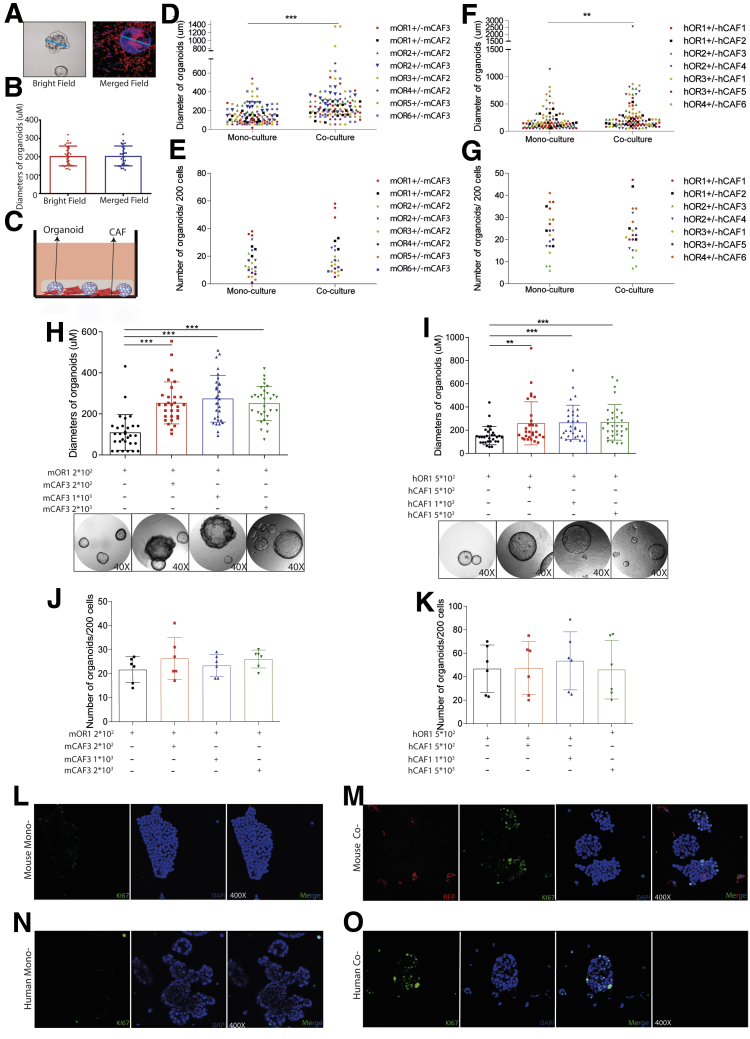
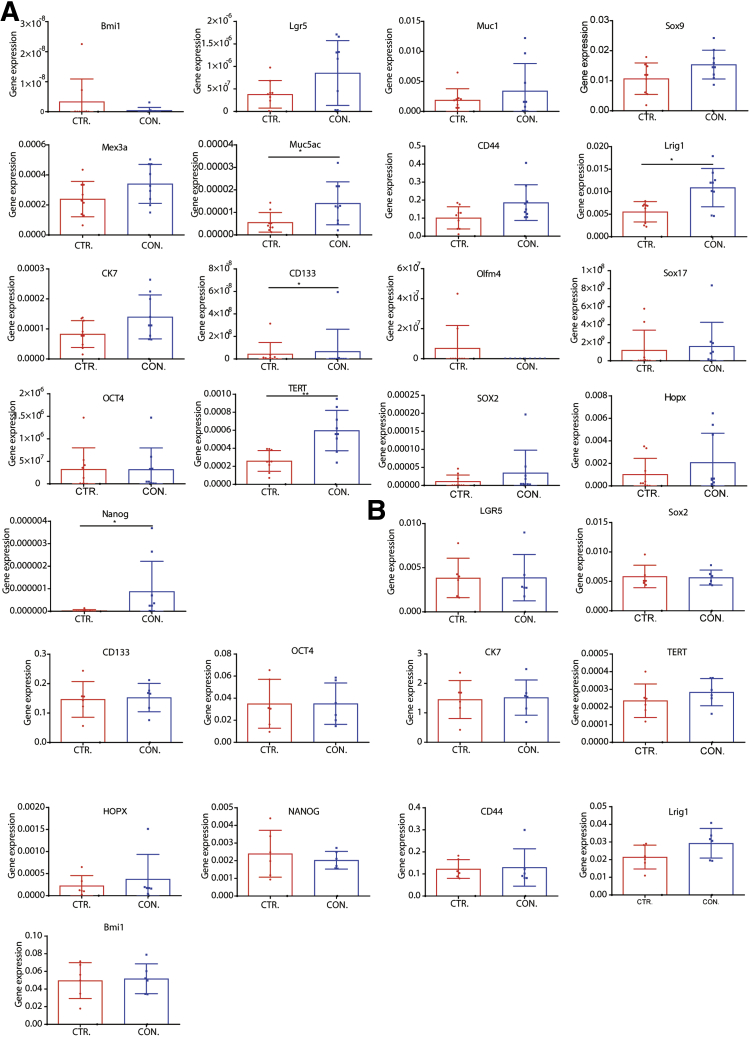
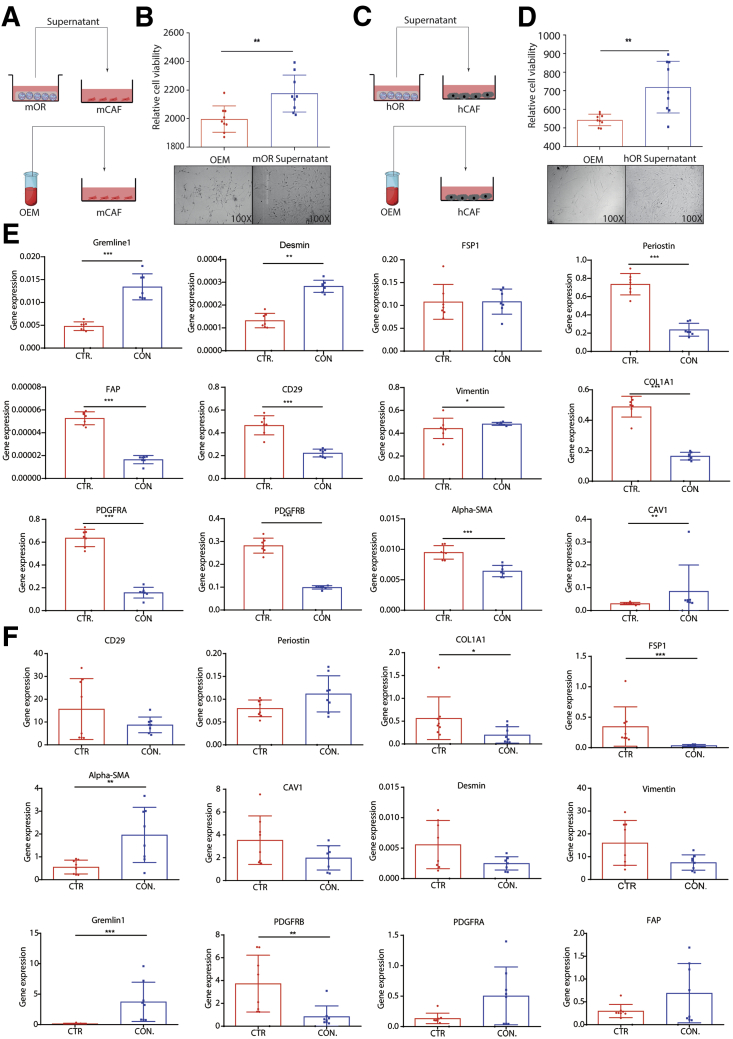
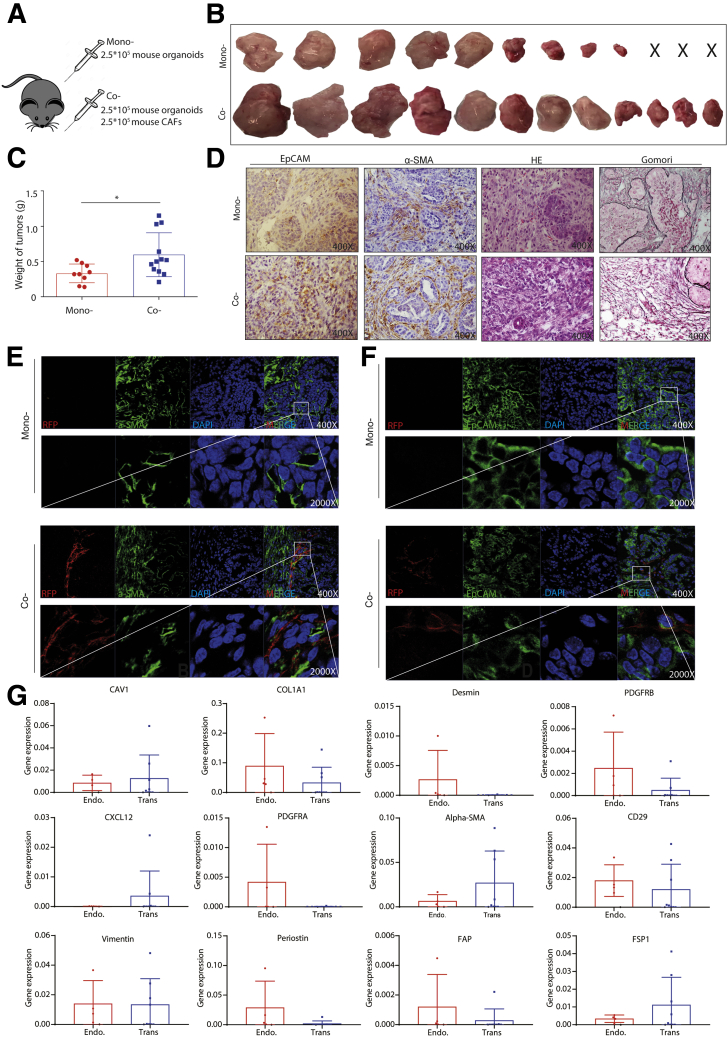
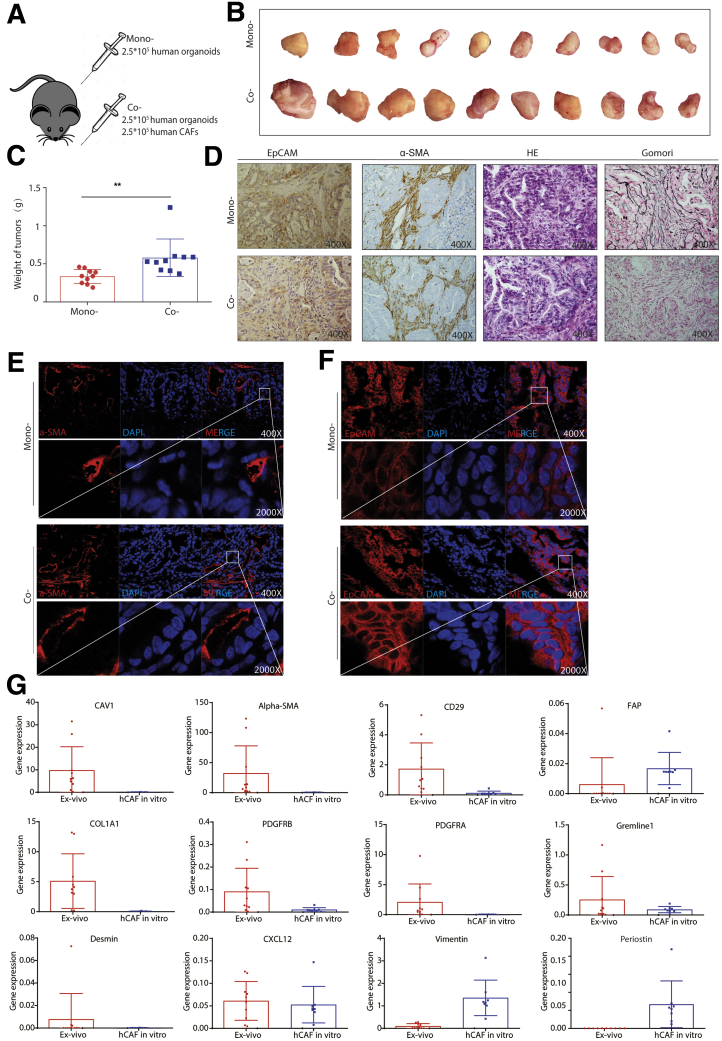
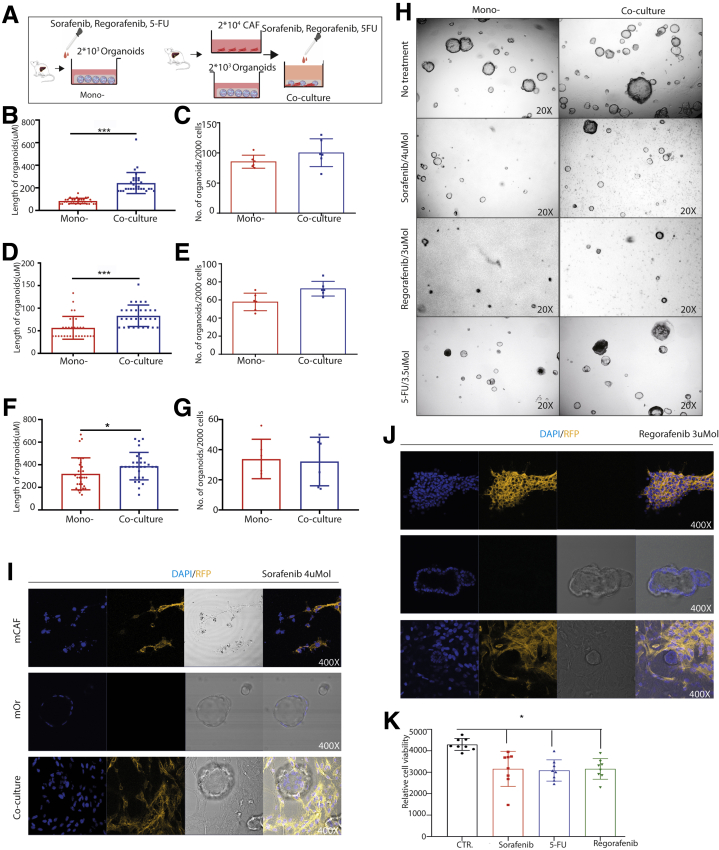
Results: To functionally investigate the interactions of liver cancer cells with CAFs, we successfully established murine and human 3D co-culture models of liver tumor organoids with CAFs. CAFs promoted tumor organoid growth in co-culture with direct cell-cell contact and in a Transwell system via paracrine signaling. Vice versa, cancer cells secrete paracrine factors regulating CAF physiology. Co-transplantation of CAFs with liver tumor organoids of mouse or human origin promoted tumor growth in xenograft models. Moreover, tumor organoids conferred resistance to clinically used anticancer drugs including sorafenib, regorafenib, and 5-fluorouracil in the presence of CAFs, or the conditioned medium of CAFs.

Conclusions: We successfully established murine and human 3D co-culture models and have shown robust effects of CAFs in liver cancer nurturing and treatment resistance.

Keywords: Cell–Cell Contact; Co-Culture; Liver Tumor Organoids; Paracrine Effect; Stromal Cells.


Figures

None
Graphical abstract
Figure 1
Figure 1
Bioinformatics analysis between FAP, CD29, and periostin gene expression and clinical relevance in liver cancer. (A–C) Gene expression of CAF markers FAP, CD29, and periostin in tumors compared with paired adjacent tumor-free liver tissues in our HCC cohort (N = 75 HCC, Mann–Whitney U tests). ∗∗∗P < .001. (D, I, and N) Gene expression of CAF markers FAP, CD29, and periostin in CCA compared with normal liver tissues in an online TCGA database (n = 9 for normal liver tissue, n = 36 for tumor tissue; 1-way analysis of variance). ∗P < .05. (F, K, and P) Gene expression of CAF markers FAP, CD29, and periostin in HCC compared with normal liver tissues in an online TCGA database (n = 160 for normal liver tissue, n = 369 for tumor tissue; 1-way analysis of variance). ∗P < .05. (E, J, and O) The expression of FAP, CD29, and periostin in different tumor stages of CCA (n = 36, 1-way analysis of variance). (G, L, and Q) The expression of FAP, CD29, and periostin in different tumor stages of HCC (n = 369, 1-way analysis of variance). (H, M, and R) Overall survival assessed using the online TCGA database at www.gepia.com. The differences in survival related to CAF markers CD29, FAP, and periostin messenger RNA expression were compared in each group involving all patients (Log-rank test, FAP [n = 36 for CCA, n = 358 for HCC]; CD29 [n = 36 for CCA, n = 364 for HCC]; periostin [n = 36 for CCA, n = 364 for HCC]). Dotted line indicates the 95% CI. HR, hazard ratio; N, normal liver tissue; T, tumor tissue.
Figure 2
Figure 2
Survival and recurrence analysis based on the gene expression of CD29, FAP, and periostin in our HCC cohort and bioinformatics analysis of other CAF markers in the GEPIA online database. (A–L) Overall survival and disease-free rate based on the gene expression of CD29, FAP, and periostin in tumor tissue or tumor-free liver tissue of our HCC patients (Kaplan–Meier analysis, N = 75). (M) Bioinformatics analysis of PDGFRB, α-SMA, S100A4, COL1A1, PDGFRA, CXCL12, CAV1, and vimentin in the GEPIA database. The gene expression of these markers in tumor and normal liver tissue (CCA: n = 9 for normal liver tissue; n = 36 for tumor tissue; HCC: n = 160 for normal liver tissue; n = 369 for tumor tissue) was assessed by 1-way analysis of variance. Gene expression of these markers in different stages of liver tumors (CCA: n = 36; HCC: n = 369) was assessed by 1-way analysis of variance. The differences in survival related to CAF markers PDGFRB, α-SMA, FSP1, COL1A1, PDGFRA, CXCL12, CAV1, and vimentin messenger RNA expression were compared in each group involving all patients (Log-rank test, n = 36 for CCA, n = 364 for HCC). (-) Without a statistically significant difference. CAV1, caveolin 1; COL1A1, collagen type I α 1; CXCL12, C-X-C motif chemokine ligand 12; FSP1, fibroblast-specific protein 1; N, normal liver tissue; OS, overall survival; PDGFRB, platelet-derived growth factor receptor β; T, tumor tissue; TF, tumor free.
Figure 3
Figure 3
Establishment of CAFs. (A) Rosa26-mT mouse treated with DEN for 17 weeks, and waiting 30 weeks for tumor formation. Then mouse CAFs were cultured according to our protocol. (B) Representative immunohistochemistry staining of α-SMA in mouse and human primary tissue (magnification, 400×). (C) Representative image of established human and mouse CAFs (magnification, 100×). (D) Representative immunofluorescence staining of α-SMA, FAP, EpCAM, AFP, CD45, and CD31 in mouse and human CAFs (magnification, 400×). DAPI, 4′,6-diamidino-2-phenylindole; hCAF, human cancer associated fibroblast; mCAF, mouse cancer associated fibroblast; mT, membrane tomato; RFP, red fluorescent protein.
Figure 4
Figure 4
Establishment of organoid and CAF co-culture models of mouse and human origins. (A and B) Schematic illustration of the co-culture models of murine and human origins. (C and D) Representative image of human CAFs, human organoids, and co-cultures at day 10 (C, magnification, 20×; D, magnification, 100×). (E) Representative image of mouse CAFs, mouse organoids, and co-cultures from day 0 to day 7 (magnification, 20×; inset: magnification, 100×). (F) Representative immunofluorescence staining of mouse CAFs, mouse organoids, and co-cultures (magnification, 400×). (G) Representative confocal image of mouse organoids and CAF co-culture model (magnification, 400×). (H) Representative 3D reconstruction of Z-stack of mouse organoids and CAF co-culture model. DAPI, 4′,6-diamidino-2-phenylindole; hCAF, human cancer associated fibroblast; hOR, human organoid; mCAF, mouse cancer associated fibroblast; mOrganoids, mouse organoids; RFP, red fluorescent protein.
Figure 5
Figure 5
The effects of CAFs on tumor organoid formation and growth. (A and B) Measuring the diameter of organoids under immunofluorescence and bright field vision (n = 6, 5 organoids for each well randomly were measured). (C) Mouse or human tumor organoids cultured with or without corresponding CAFs. (D) Diameters of mouse organoids cultured with or without mouse CAFs (n = 8 experimental settings with 3 biological replicates for each; 5 organoids for each well randomly were measured). (E) Number of mouse organoids cultured with or without mouse CAFs (n = 8 experimental settings with 3 biological replicates for each). (F) Diameters of human organoids cultured with or without human CAFs (n = 7 experimental settings with 3 biological replicates for each; 5 organoids for each well randomly were measured). (G) Number of human organoids cultured with or without mouse CAFs (n = 7 experimental settings with 3 biological replicates for each). (H and I) Diameters of formed organoids in mono- or co-cultures with different concentrations between organoids and CAFs (n = 6; 5 organoids for each well randomly were measured). (J and K) The number of formed organoids in mono- or co-cultures with different concentrations between organoids and CAFs (n = 6). (L) Ki67 staining for mouse organoid mono-culture (magnification, 400×). (M) Ki67 staining for mouse organoids and CAF co-culture (magnification, 400×). (N) Ki67 staining for human organoid mono-culture (magnification, 400×). (O) Ki67 staining for human organoids and CAF co-culture (magnification, 400×). (B and D–K) Data are expressed as means ± SD. Mann–Whitney U tests. ∗∗P < .01, ∗∗P < .05, ∗∗∗P < .001. hCAF, human cancer associated fibroblast; hOR, human organoid; mCAF, mouse cancer associated fibroblast; mOR, mouse organoid; RFP, red fluorescent protein.
Figure 6
Figure 6
The effects of CAFs on organoids on a Transwell platform. (A) Schematic illustration of a Transwell culture platform for mouse cells. (B) Diameters of mouse organoids on a Transwell platform with or without CAFs (n = 6; 5 organoids for each well randomly were measured). (C) Number of mouse organoids on a Transwell platform with or without CAFs (n = 6). (D) Representative images of mono-cultured, co-cultured mouse organoids. (E) Growth of mouse liver tumor organoids determined by CellTiter (n = 9) and Alamar Blue Assay (n = 6). (F) Schematic illustration of a Transwell culture platform for human cells. (G) Diameters of human organoids on a Transwell platform with or without CAFs (n = 6; 5 organoids for each well randomly were measured). (H) Number of human organoids on a Transwell platform with or without CAFs (n = 6). (I) Representative images of mono-cultured, co-cultured human organoids on a Transwell platform. (J) Growth of human organoids determined by CellTiter and Alamar Blue Assay (n = 9). (K) The number of formed mouse tumor organoids in the presence or absence of CAFs in a Transwell system (n = 4 experimental settings with 3 biological replicates for each, Mann–Whitney U tests). (L) The size of formed mouse tumor organoids in the presence or absence of CAFs in a Transwell system (n = 4 experimental settings with 3 biological replicates for each; 5 organoids for each well randomly were measured). (M) Growth of mouse liver tumor organoids determined by Alamar Blue Assay (n = 4 experimental settings with 3 biological replicates for each). (N) The number of formed human tumor organoids in the presence or absence of CAFs in a Transwell system (n = 3 experimental settings with 3 biological replicates for each, Mann–Whitney U tests). (O) The size of formed human tumor organoids in the presence or absence of CAFs in a Transwell system (n = 3 experimental settings with 3 biological replicates for each; 5 organoids for each well were measured randomly). (P) Growth of mouse liver tumor organoids determined by Alamar Blue Assay (n = 3 experimental settings with 3 biological replicates for each). (B, C, E, G, H, J, L, M, O, and P) Data are expressed as means ± SD. Mann–Whitney U tests. ∗P < .05, ∗∗P < .01, ∗∗∗P < .001. hCAF, human cancer associated fibroblast; hOR, human organoid; mCAF, mouse cancer associated fibroblast; mOR, mouse organoid.
Figure 7
Figure 7
The expression profile of stem cell markers in tumor organoids. (A) Stem cell marker expression of mouse organoids in the presence or absence of CAF-conditioned medium (n = 9). (B) Stem cell marker expression of human organoids in the presence or absence of CAF-conditioned medium (n = 6). (A and B) Data are expressed as means ± SD. Mann–Whitney U tests. ∗P < .05, ∗∗P < .01. CON, conditioned; CTR, control.
Figure 8
Figure 8
Supernatant of organoids on the growth, morphology, and gene expression of CAFs. (A and B) Growth of mouse CAFs in the presence or absence of organoid conditioned medium (n = 9). (C and D) Growth of human CAFs in the presence or absence of organoid conditioned medium (n = 9). (E) Expression profile of mouse CAFs markers in the presence or absence of organoid conditioned medium (n = 8). (F) Expression profile of human CAF markers in the presence or absence of organoid conditioned medium (n = 8). (B and DF) Data are presented as means ± SD. Mann–Whitney U tests. ∗P < .05, ∗∗P < .01, ∗∗∗P < .001. CTR, control; CON, conditioned; FSP1, fibroblast-specific protein 1; hCAF, human cancer associated fibroblast; hOR, human organoid; mCAF, mouse cancer associated fibroblast; mOR, mouse organoid.
Figure 9
Figure 9
Mouse CAFs promote the growth of mouse organoid-formed tumors in vivo. (A) Mouse tumor organoids (2.5 × 105) together with or without 2.5 × 105 mouse CAFs were transplanted into NSG mice. (B) Representative pictures show the tumors from mono- and co-transplantation. (C) The weight of tumors from mono- or co-transplantation (n = 9 for xenografts from organoid transplantation only, n = 12 for xenografts from CAFs and organoid co-transplantation; ∗P < .05). (D) The representative immunohistochemistry staining of EpCAM, α-SMA, H&E, and Gomori for tumors from mono- or co-transplantation (magnification, 400×). (E) The representative confocal image of α-SMA expression for tumors from mono- or co-transplantation (magnification, 400×; inset: magnification, 2000×). (F) The representative confocal image of EpCAM expression for tumors from mono- or co-transplantation (magnification, 400×; inset: magnification, 2000×). (G) Expression profile of CAF markers for transplanted and endogenously recruited mouse CAFs (endogenous, n = 4; transplanted, n = 8). (C and G) Data are presented as means ± SD. Mann–Whitney U tests. α-SMA, alpha smooth actin; CAFs, cancer associated fibroblasts; DAPI, 4′,6-diamidino-2-phenylindole; Endo, endogenous; EpCAM, epithelial cell adhesion molecule; H&E, hematoxylin and eosin; NSG, NOD scid gamma mouse; RFP, red fluorescent protein; Trans, transplant.
Figure 10
Figure 10
Human CAFs promote the growth of patient CCA organoid-formed tumors in vivo. (A) Human tumor organoids (2.5 × 105) together with or without 2.5 × 105 human CAFs were transplanted into NSG mice. (B) Representative pictures show the tumors from mono- and co-transplantation. (C) The weight of tumors from mono- or co-transplantation (n = 10 for both groups; ∗∗P < .01). (D) The representative immunohistochemistry staining of EpCAM, α-SMA, H&E, and Gomori for tumors from mono- or co-transplantation (magnification, 400×). (E) The representative confocal image of α-SMA expression for tumors of mono- or co-transplantation (magnification, 400×; inset: magnification, 2000×). (F) The representative confocal image of EpCAM expression for tumors from mono- or co-transplantation (magnification, 400×; inset: magnification, 2000×). (G) Expression profile of CAF markers for in vivo educated human CAFs from xenograft tumors compared with in vitro cultured CAFs (educated, n = 10; in vitro, n = 8). (C and G) Data are presented as means ± SD. Mann–Whitney U tests. α-SMA, alpha smooth actin; H&E, hematoxylin and eosin; DAPI, 4′,6-diamidino-2-phenylindole; EpCAM, epithelial cell adhesion molecule; hCAF, human cancer associated fibroblast; NSG, NOD scid gamma mouse.
Figure 11
Figure 11
Mouse organoids in the presence or absence of CAFs in response to anticancer drugs. (A) An outline of the experimental strategy used to illustrate the drug administration on mouse tumor organoids with or without CAFs. (B–G) Mouse organoids in response to treatment of sorafenib (4 umol), regorafenib (3 umol), or 5-FU (3.5 umol) with or without CAFs (n = 6). (H) Representative image of treatment for mouse mono-culture and co-culture (magnification, 20×). (I and J) Representative confocal image of mouse CAFs, organoids, and co-cultures in response to treatment with sorafenib and regorafenib (magnification, 400×). (K) Mouse CAFs in response to anticancer drugs (sorafenib, 5 umol; regorafenib, 5 umol; 5-FU, 5 umol; n = 8). (B, D, and F) Five organoids for each well were measured randomly. (B–G and K) Data are presented as means ± SD, Mann–Whitney U tests. ∗P < .05, ∗∗∗P < .001. CTR, control; DAPI, 4′,6-diamidino-2-phenylindole; mCAF, mouse cancer associated fibroblast; mOR, mouse organoid; RFP, red fluorescent protein.
Figure 12
Figure 12
Human organoids in the presence or absence of CAFs in response to anticancer drugs. (A) An outline of the experimental strategy used to illustrate the drug treatment on human tumor organoids with or without CAFs. (B–G) Human organoids in response to treatment with sorafenib (4 umol), regorafenib (3 umol), or 5-FU (3.5 umol) with or without CAFs. (H) Representative image of human mono-culture and co-culture with or without treatment (magnification, 20×). (I) Human CAFs in response to anticancer drugs (sorafenib, 5 umol; regorafenib, 5 umol; 5-FU, 5 umol; n = 8). (B, D, and F) Five organoids for each well were measured randomly. (B–G and I) Data are presented as means ± SD, Mann–Whitney U tests. ∗P < .05, ∗∗P < .01, ∗∗∗P < .001. CTR, control.
Figure 13
Figure 13
Organoids in the presence or absence of CAF conditioned medium in response to the anticancer treatment. (A and K) An outline of the experimental strategy used to illustrate drug treatment on tumor organoids with or without conditioned medium of pretreated CAFs. (B, E, H, L, O, and R) Organoids in the presence or absence of conditioned medium of pretreated CAFs were treated with a serial concentration of sorafenib, regorafenib, or 5-FU, and the half maximal inhibitory concentration was determined (n = 9; data are presented as means ± SD). (C, F, I, M, P, and S) Representative image of mouse or human tumor organoids in the presence or absence of conditioned medium of pretreated CAFs, treated with a serial concentration of sorafenib, regorafenib, or 5-FU for 10 days for mouse cells and 14 days for human cells (magnification, 20×). (D, G, J, N, Q, and T) Cell viability assays were performed and measured at the indicated times, using mouse or human tumor organoids incubated with the indicated anticancer drugs and parenthesized concentration in the presence or absence of conditioned medium of pretreated CAFs (n = 9). Graphs show means ± SD of data normalized to t = 0. Mann–Whitney U tests. ∗P < .05, ∗∗P < .01, ∗∗∗P < .001.

Similar articles

Cited by

References

    1. Liu J., Dang H., Wang X.W. The significance of intertumor and intratumor heterogeneity in liver cancer. Exp Mol Med. 2018;50:e416. - PMC - PubMed
    1. Batlle E., Clevers H. Cancer stem cells revisited. Nat Med. 2017;23:1124–1134. - PubMed
    1. Tuveson D., Clevers H. Cancer modeling meets human organoid technology. Science. 2019;364:952–955. - PubMed
    1. Broutier L., Mastrogiovanni G., Verstegen M.M., Francies H.E., Gavarro L.M., Bradshaw C.R., Allen G.E., Arnes-Benito R., Sidorova O., Gaspersz M.P., Georgakopoulos N., Koo B.K., Dietmann S., Davies S.E., Praseedom R.K., Lieshout R., JNM I.J., Wigmore S.J., Saeb-Parsy K., Garnett M.J., van der Laan L.J., Huch M. Human primary liver cancer-derived organoid cultures for disease modeling and drug screening. Nat Med. 2017;23:1424–1435. - PMC - PubMed
    1. Cao W., Liu J., Wang L., Li M., Verstegen M.M.A., Yin Y., Ma B., Chen K., Bolkestein M., Sprengers D., van der Laan L.J.W., Doukas M., Kwekkeboom J., Smits R., Peppelenbosch M.P., Pan Q. Modeling liver cancer and therapy responsiveness using organoids derived from primary mouse liver tumors. Carcinogenesis. 2019;40:145–154. - PubMed

Publication types

MeSH terms