. 2021;11(2):371-388.
doi: 10.1016/j.jcmgh.2020.09.002. Epub 2020 Sep 12.

Aryl Hydrocarbon Receptor Activity in Hepatocytes Sensitizes to Hyperacute Acetaminophen-Induced Hepatotoxicity in Mice

Affiliations

Aryl Hydrocarbon Receptor Activity in Hepatocytes Sensitizes to Hyperacute Acetaminophen-Induced Hepatotoxicity in Mice

Fenja A Schuran et al. Cell Mol Gastroenterol Hepatol. 2021.

Abstract

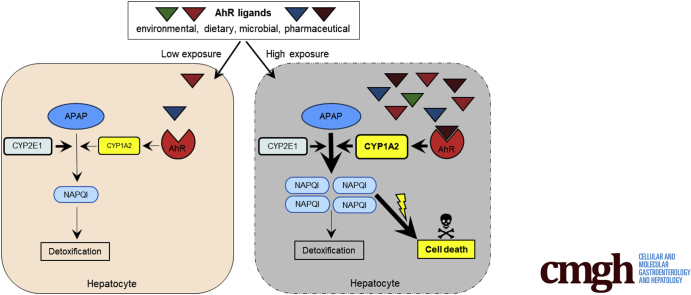
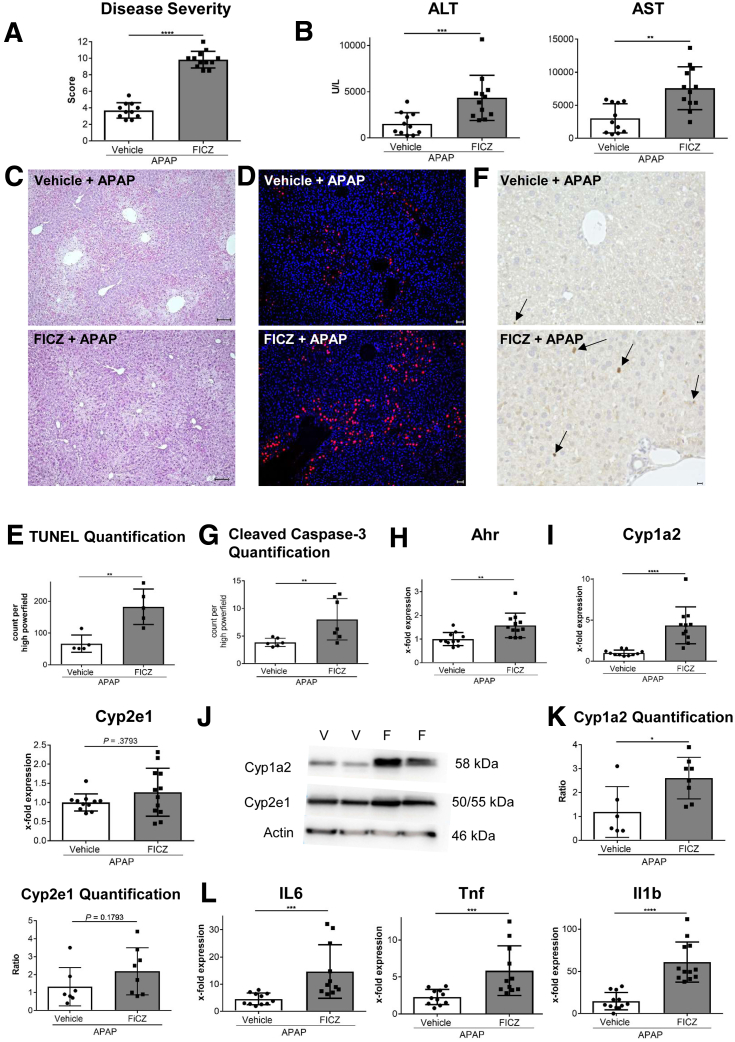
Background & aims: Acetaminophen (APAP)-induced liver injury is one of the most common causes of acute liver failure, however, a clear definition of sensitizing risk factors is lacking. Here, we investigated the role of the ligand-activated transcription factor aryl hydrocarbon receptor (Ahr) in APAP-induced liver injury. We hypothesized that Ahr, which integrates environmental, dietary, microbial and metabolic signals into complex cellular transcriptional programs, might act as a rheostat for APAP-toxicity.

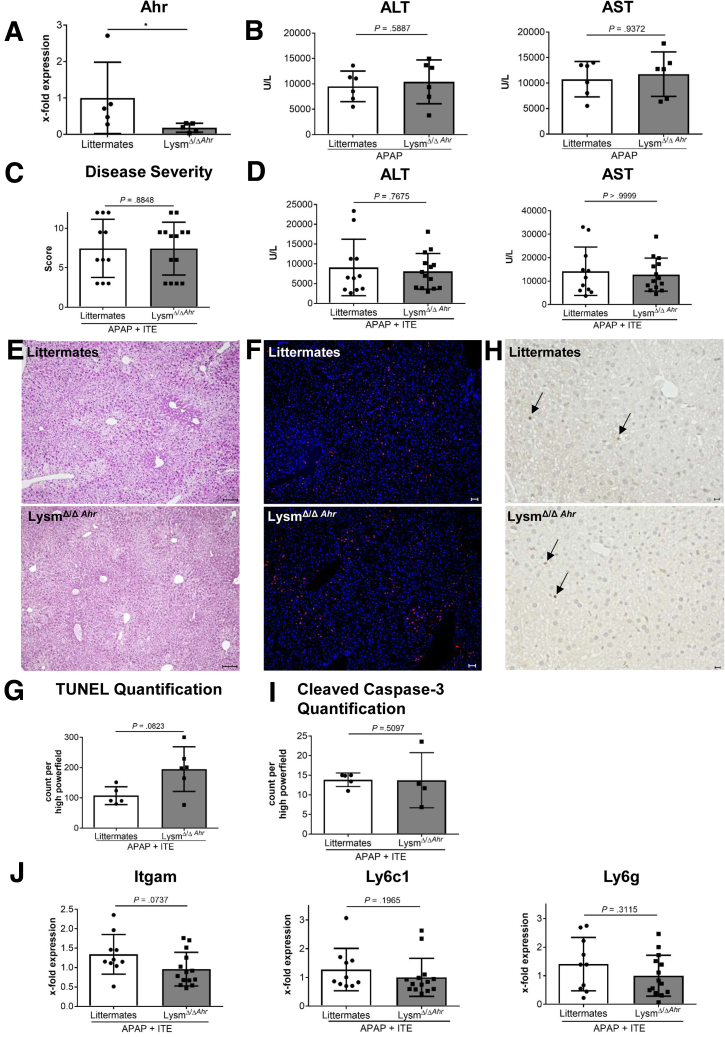
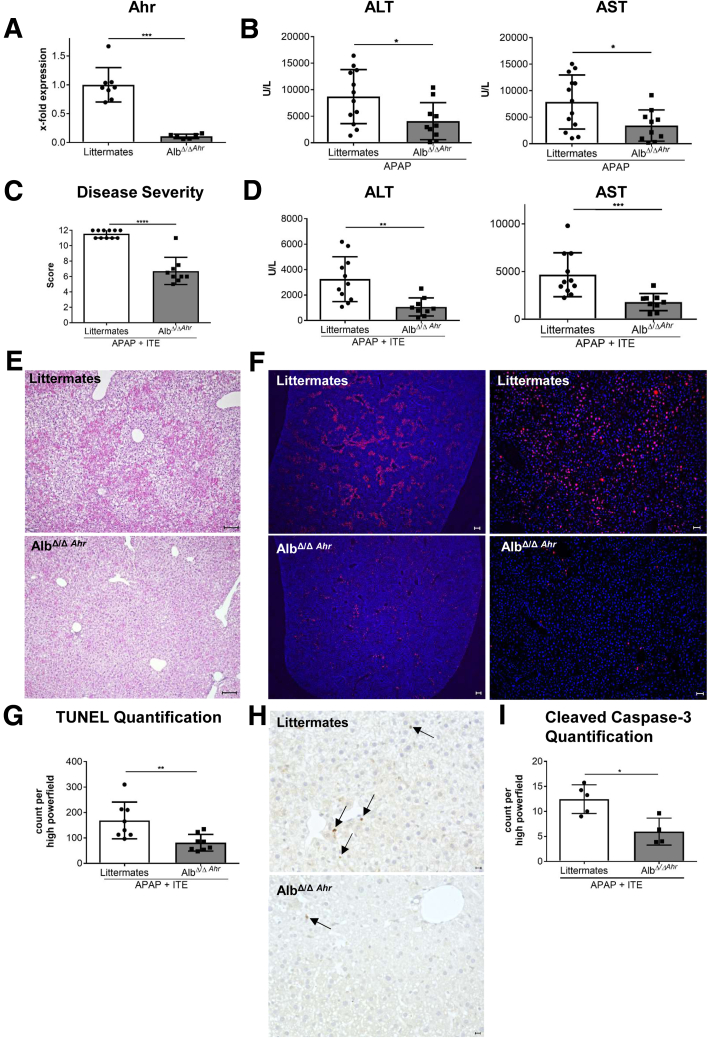
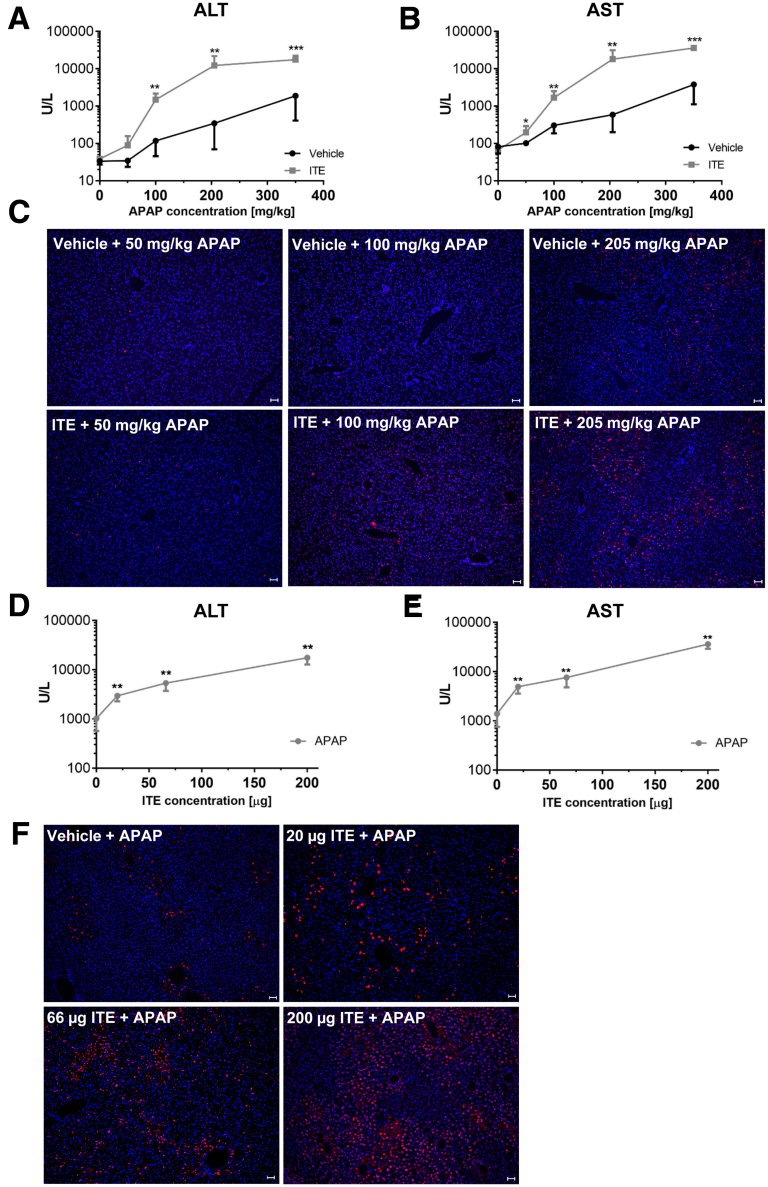
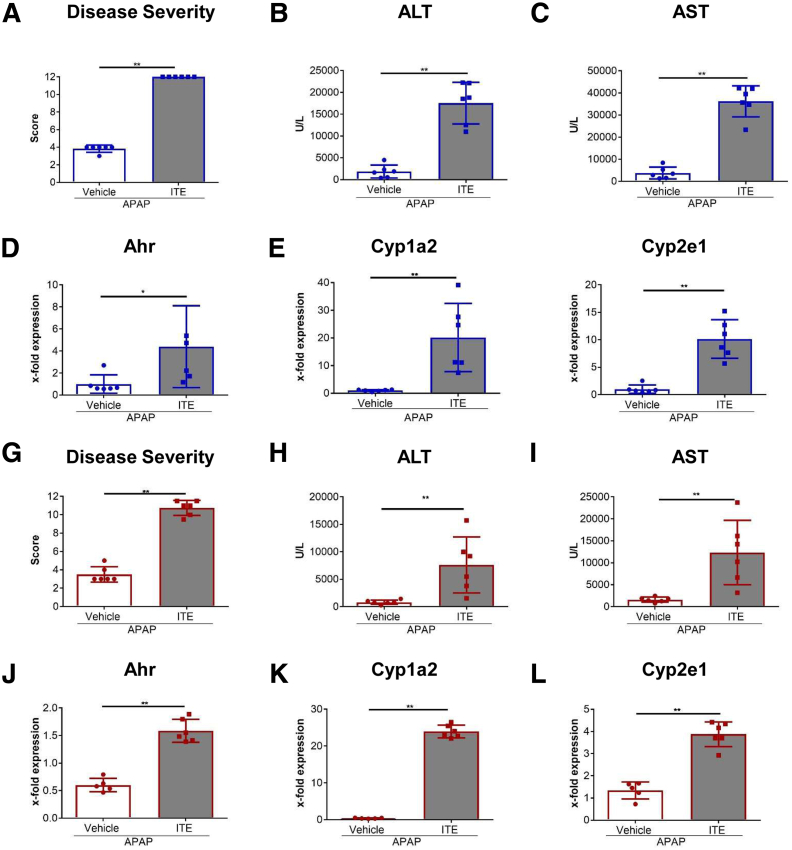
Methods: Wildtype or conditional Ahr knockout mice lacking Ahr in hepatocytes (AlbΔ/ΔAhr) or myeloid cells (LysMΔ/ΔAhr) were treated with the specific Ahr ligand 2-(1'H-indole-3'-carbonyl)-thiazole-4-carboxylic acid methyl ester (ITE) together with APAP.

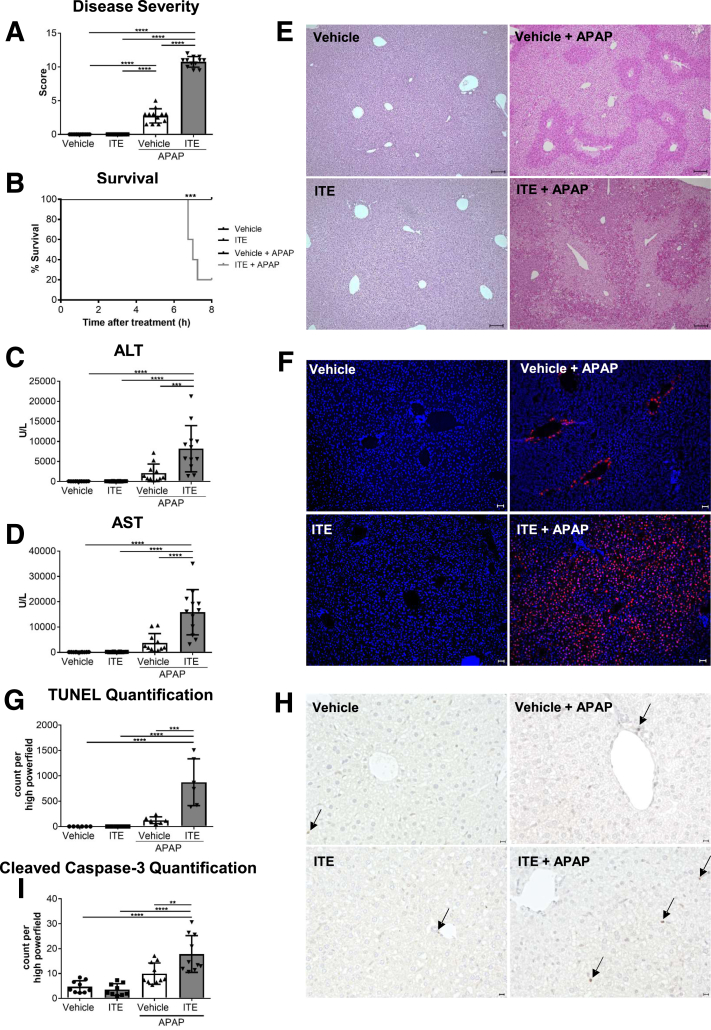
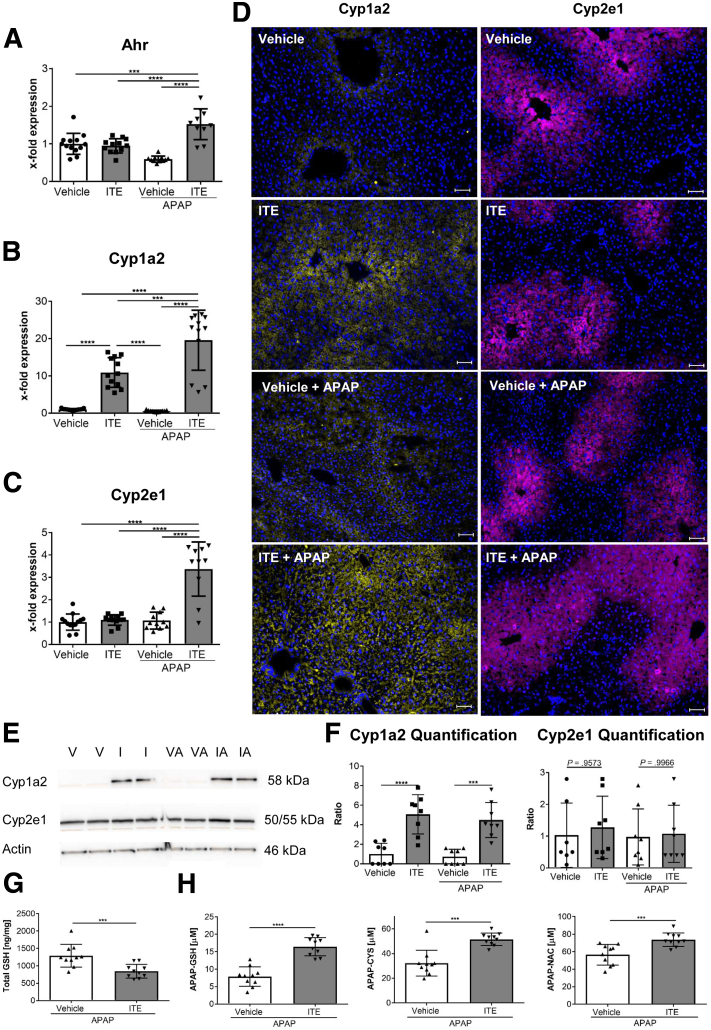
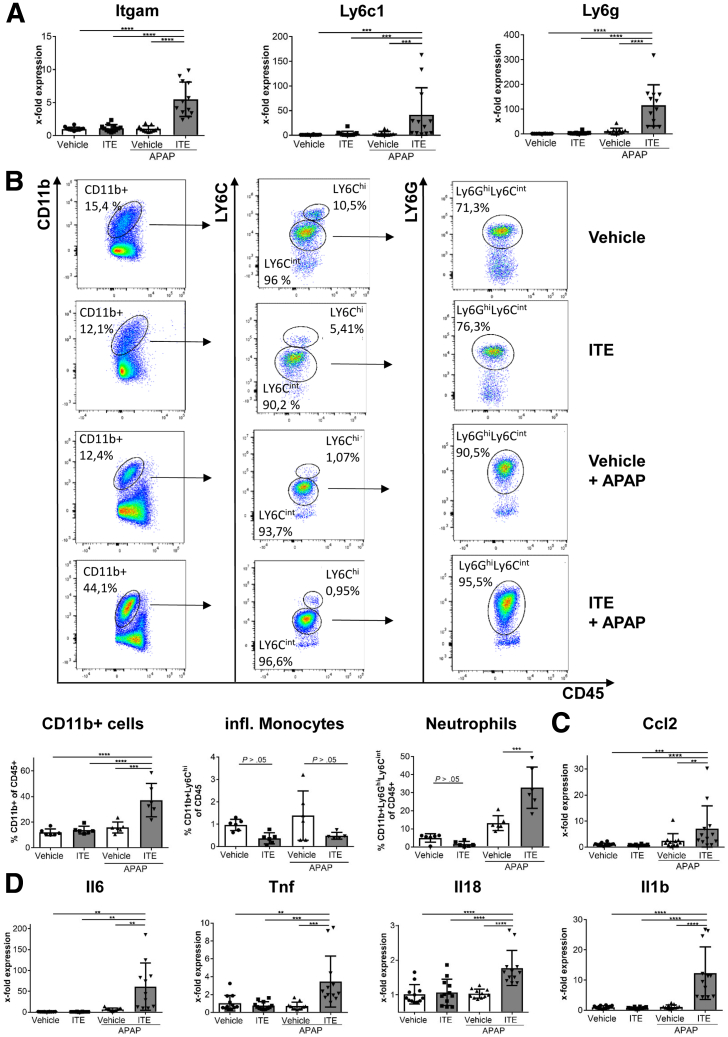
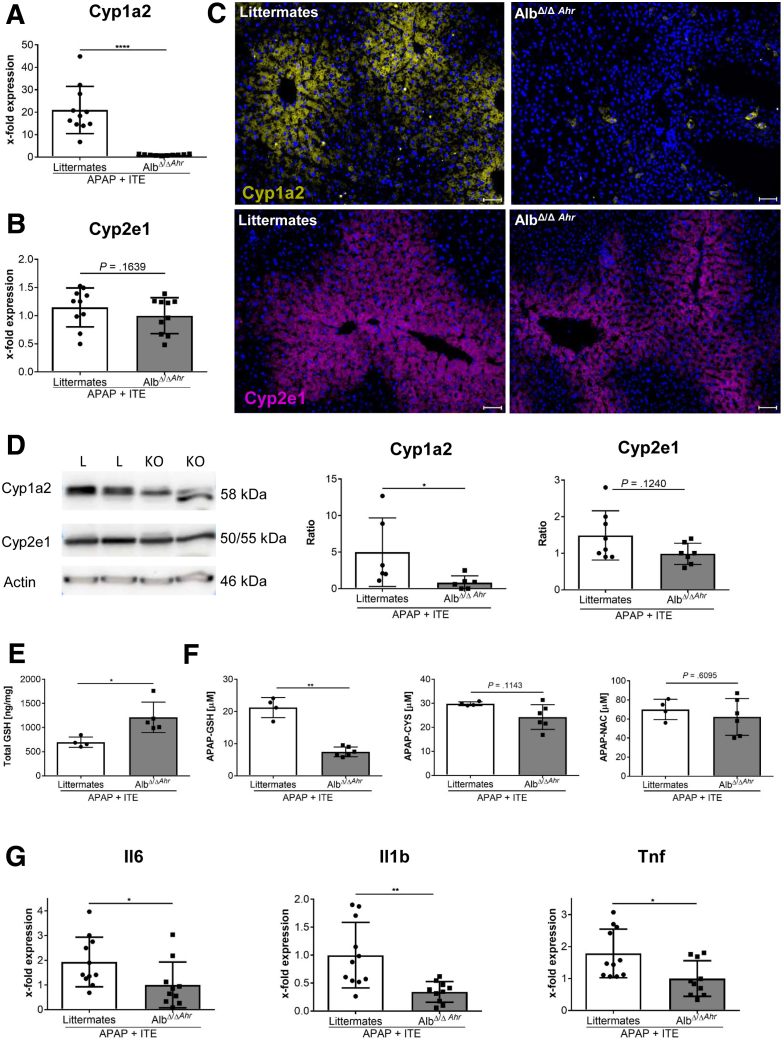
Results: Ahr activation by ITE, which by itself was non-toxic, exacerbated APAP-induced hepatotoxicity compared to vehicle-treated controls, causing 80% vs. 0% mortality after administration of a normally sublethal APAP overdose. Of note, Ahr activation induced hepatocyte death even at APAP doses within the therapeutic range. Aggravated liver injury was associated with significant neutrophil infiltration; however, lack of Ahr in myeloid cells did not protect LysMΔ/ΔAhr mice from exacerbated APAP hepatotoxicity. In contrast, AlbΔ/ΔAhr mice were largely protected from ITE-induced aggravated liver damage, indicating that Ahr activation in hepatocytes, but not in myeloid cells, was instrumental for disease exacerbation. Mechanistically, Ahr activation fueled hepatic accumulation of toxic APAP metabolites by up-regulating expression of the APAP-metabolizing enzyme Cyp1a2, a direct Ahr downstream target.

Conclusions: Ahr activation in hepatocytes potentiates APAP-induced hepatotoxicity. Thus, individual exposition to environmental Ahr ligands might explain individual sensitivity to hyperacute liver failure.

Keywords: APAP; Acute Liver Failure; Ahr; Cyp1a2.


Figures

None
Graphical abstract
Figure 1
Figure 1
Ahr activation by ITE induces hyperacute liver damage. Female wild-type mice were treated with vehicle or ITE alone, or with vehicle + APAP or ITE+ APAP (n = 12 each). Samples were analyzed 4 hours post-APAP treatment and survival was monitored for 8 hours. (A) Disease score reflecting general condition, (B) survival curve, (C, D) serum liver transaminases, (E) H&E staining of liver tissue (scale bar = 100 μm), (F,G) hepatocyte damage assessed by TUNEL staining (red; nuclei are stained in blue) (scale bar = 50 μm), (H, I) apoptotic cells visualized by cleaved caspase-3 staining. Scale bar = 50 μm. Pictures were taken using a Biorevo Keyence BZ-9000 microscope with objective from Nikon (Plan Apo 10x/0,45 ∞/0.17 WD 4.0) and the Keyence BZ II Viewer and Analyzer software. Two pooled experiments of 3 independent experiments are shown. For statistical analysis, a 1-way analysis of variance followed by Tukey’s multiple comparisons test was applied. For the survival curve, statistical significance was tested with the log-rank (Mantel-Cox test) and Gehan-Breslow-Wilcoxon test. Results are shown as mean ± SD. ∗∗P < .01, ∗∗∗P < .001, ∗∗∗∗P < .0001.
Figure 2
Figure 2
Ahr activation promotes accumulation of toxic acetaminophen metabolites. Female wild-type mice were treated with vehicle or ITE alone, or with vehicle + APAP or ITE + APAP (n = 12 each). Hepatic gene expression of (A) Ahr, (B) Cyp1a2 and (C) Cyp2e1 were analyzed 4 hours post-APAP treatment. Target gene expression is depicted as x- fold expression compared with the vehicle control. (D) Representative stainings of hepatic Cyp1a2 (yellow) and Cyp2e1 (purple) protein expression. Nuclei are stained in blue. Scale bar = 50 μm. Pictures were taken using a Biorevo Keyence BZ-9000 microscope with objective from Nikon (Plan Apo 10x/0,45 ∞/0.17 WD 4.0) and the Keyence BZ II Viewer and Analyzer software. (E, F) Western blot analysis of Cyp1a2 and Cyp2e1 protein expression (n = 8). (G) Total GSH levels in liver tissue and (H) toxic APAP adducts in plasma 30 min post APAP treatment (n = 10). Two pooled of 3 independent experiments are shown. For statistical analysis, a 1-way analysis of variance followed by Tukey’s multiple comparisons test was used. Results are shown as mean ± SD. ∗P < .05, ∗∗P < .01, ∗∗∗P < .001, ∗∗∗∗P < .0001. I, ITE; IA, ITE + APAP; V, vehicle; VA, vehicle + APAP.
Figure 3
Figure 3
Ahr-mediated hyperacute APAP hepatotoxicity is associated with increased infiltration of inflammatory cells. Female wild-type mice were treated with vehicle or ITE alone, or with vehicle + APAP or ITE + APAP (n = 12 each) and analyzed 4h post-APAP treatment. (A) Hepatic gene expression of the monocyte and neutrophil markers Itgam, Ly6c1, and Ly6g. (B) Flow cytometric analysis of liver-infiltrating CD11b+ Ly6Chi monocytes and CD11b+ Ly6Ghi Ly6Cint neutrophils (n = 6 each). (C) Hepatic gene expression of the inflammatory mediators Ccl2, Il6, Tnf, Il18, and Il1b. Two pooled experiments of 3 independent experiments are shown. Results are shown as mean ± SD. For statistical analysis, a 1-way analysis of variance followed by Tukey’s multiple comparisons test was performed. ∗P < .05, ∗∗P < .01, ∗∗∗P < .001, ∗∗∗∗P < .0001.
Figure 4
Figure 4
ITE-mediated Ahr activation in myeloid cells does not aggravate acetaminophen-induced liver injury. (A) Quantitative polymerase chain reaction–based verification of efficient Ahr knockdown in myeloid cells isolated from livers of female LysMΔ/ΔAhr mice as compared with littermate control mice without Ahr deficiency in myeloid cells (n = 5 each). (B) Serum ALT and AST levels of female LysMΔ/ΔAhr mice or their littermates 8 hours post APAP treatment (n = 6 each). (C-J) Male LysMΔ/ΔAhr mice (n = 14) or littermate control mice (n = 11) were treated with ITE + APAP and analyzed 4h post-APAP treatment. We found no significant differences in (C) disease severity, (D) serum transaminase levels, (E) histological tissue damage (scale bar = 100 μm), (F, G) hepatocellular death as assessed by TUNEL staining (red; scale bar = 50 μm), (H, I) apoptosis as shown by cleaved caspase-3 analysis (scale bar = 50 μm), and (J) infiltration of inflammatory monocytes or neutrophils as assessed by gene expression levels of Itgam, Ly6c1, and Ly6g. Pictures were taken using a Biorevo Keyence BZ-9000 microscope with objective from Nikon (Plan Apo 10x/0,45 ∞/0.17 WD 4.0) and the Keyence BZ II Viewer and Analyzer software. Pooled data from 2 of 3 independent experiments are shown. For statistical analysis, the Mann-Whitney test was performed. Results are shown as mean ± SD. ∗P < .05.
Figure 5
Figure 5
Ahr activation in hepatocytes is responsible for ITE-mediated induction of hyperacute APAP hepatotoxicity. (A) Quantitative polymerase chain reaction–based verification of efficient Ahr knockdown in hepatocytes of female AlbΔ/ΔAhr mice as compared with littermate control mice (n = 6–8). (B) Female AlbΔ/ΔAhr mice or their littermates were treated with APAP alone and serum transaminases 8h post treatment were measured (n = 10–12). (C–J) Female AlbΔ/ΔAhr mice (n = 9) or littermate control mice (n = 11) were treated with ITE + APAP and analyzed 4h post-APAP treatment. (C) Disease severity, (D) serum transaminases, (E) H&E staining (scale bar = 100 μm), (F, G) TUNEL staining of dead hepatocytes (red, scale bar = 200 μm [left panels], 50 μm [right panels]) and (H–I) analysis of the apoptosis marker cleaved caspase-3 revealed that AlbΔ/ΔAhr mice were protected from ITE-induced hyperacute APAP hepatotoxicity. Pictures were taken using a Biorevo Keyence BZ-9000 microscope (Keyence) with objective from Nikon (Plan Apo 10x/0,45 ∞/0.17 WD 4.0) and the Keyence BZ II Viewer and Analyzer software. Scale bar = 50 μm. Pooled data of 2 of 3 independent experiments are shown. For statistical analysis, the Mann-Whitney test was applied. Results are shown as mean ± SD. ∗∗P < .01, ∗∗∗P < .001, ∗∗∗∗P < .0001.
Figure 6
Figure 6
Hyperacute APAP-induced liver injury by Ahr activation in hepatocytes depends on accumulation of toxic APAP adducts. Female AlbΔ/ΔAhr mice and littermate control mice were treated with APAP+ITE (n = 9–11). Expression of the APAP- metabolizing enzymes Cyp1a2 and Cyp2e1 at (A, B) messenger RNA and (C, D) protein level 4 hours post APAP injection. (E) Total GSH levels in liver homogenate and (F) APAP adducts in serum 30 min post APAP injection (n = 4–6). (G) Hepatic expression of the inflammatory cytokines Il6, Il1b and Tnf 4 hours post APAP injection. Pictures were taken using a Biorevo Keyence BZ-9000 microscope with objective from Nikon (Plan Apo 10x/0,45 ∞/0.17 WD 4.0) and the Keyence BZ II Viewer and Analyzer software. Scale bar = 50 μm. Pooled data of 2 of 3 independent experiments are shown. For statistical analysis, the Mann-Whitney test was applied. Results are shown as mean ± SD. ∗∗P < .01, ∗∗∗P < .001, ∗∗∗∗P < .0001. KO, AlbΔ/ΔAhr; L, littermate.
Figure 7
Figure 7
Low-dose APAP in combination with ITE is sufficient to induce hepatocellular damage. (A–C) Male wild-type mice were treated with vehicle or ITE + escalating doses of APAP (0, 50, 100, 205, or 350 mg/kg; n = 6 each). (D–F) Alternatively, male wild-type mice were treated with vehicle or escalating doses of ITE (0, 20, 67, and 200 μg, n = 6 each) + 350 mg/kg APAP. (A, D) ALT and (B, E) AST serum levels were measured 4 hours post APAP treatment. (C, F) TUNEL staining (red) of representative liver sections. Nuclei are stained in blue. Pictures were taken using a Biorevo Keyence BZ-9000 microscope with objective from Nikon (Plan Apo 10x/0,45 ∞/0.17 WD 4.0) and the Keyence BZ II Viewer and Analyzer software. Scale bar = 50 μm. One representative of 3 independent experiments is shown. For statistical analysis, the Mann-Whitney test was applied. Results are shown as mean ± SD. ∗∗P < .01, ∗∗∗P < .001.
Figure 8
Figure 8
Ahr activation by FICZ induces hyperacute liver damage. Male wild-type mice were treated with vehicle + APAP or FICZ + APAP (n = 11–12). Samples were analyzed 4 hours post-APAP treatment. (A) Disease score reflecting general condition, (B) serum liver transaminases, and hepatocyte damage as assessed by (C) H&E (scale bar = 100 μm), (D, E) TUNEL (n = 5 each; red; nuclei are stained in blue) (scale bar = 50 μm), and (F, G) cleaved caspase-3 staining. Pictures were taken using a Biorevo Keyence BZ-9000 microscope with objectives from Nikon (Apo 2x/0.10, OFN25 WD 8.5; Plan Apo 10x/0,45 ∞/0.17 WD 4.0) and the Keyence BZ II Viewer and Analyzer software. (H, I, L) Hepatic gene expression of Ahr, Cyp1a2, Cyp2e1 and of the inflammatory cytokines Il6, Tnf, and Il1b. (J, K) Western blot analysis of Cyp1a2 and Cyp2e1 at protein level. Pooled data of 2 of 3 independent experiments are shown. For statistical analysis, the Mann-Whitney test was performed. Results are shown as mean ± SD. ∗∗P < .01, ∗∗∗P < .001, ∗∗∗∗P < .0001. F, FICZ + APAP; V, vehicle + APAP.
Figure 9
Figure 9
ITE-mediated exacerbation of APAP induced liver injury is similar in both sexes. (A–F) Male or (G–L) female C57Bl/6 mice (n = 6 each) were injected intraperitoneally on 2 consecutive days with 200 μg ITE or vehicle prior to intraperitoneal injection of 350 mg/kg APAP. (A, G) Disease severity, (B, H) ALT, and (C, I) AST serum levels, and gene expression of Ahr, Cyp1a2, and Cyp2e1 were analyzed. One representative experiment of 3 independent experiments is shown. For statistical analysis, the Mann-Whitney test was applied. Mean ± SD are shown. ∗P < .05, ∗∗P < .01.

Similar articles

Cited by

References

    1. Yoon E., Babar A., Choudhary M., Kutner M., Pyrsopoulos N. Acetaminophen-induced hepatotoxicity: a comprehensive update. J Clin Transl Hepatol. 2016;4:131–142. - PMC - PubMed
    1. Zaher H., Buters J.T., Ward J.M., Bruno M.K., Lucas A.M., Stern S.T., Cohen S.D., Gonzalez F.J. Protection against acetaminophen toxicity in CYP1A2 and CYP2E1 double-null mice. Toxicol Appl Pharmacol. 1998;152:193–199. - PubMed
    1. Herndon C.M., Dankenbring D.M. Patient perception and knowledge of acetaminophen in a large family medicine service. J Pain Palliat Care Pharmacother. 2014;28:109–116. - PubMed
    1. Heard K., Green J.L., Anderson V., Bucher-Bartelson B., Dart R.C. A randomized, placebo-controlled trial to determine the course of aminotransferase elevation during prolonged acetaminophen administration. BMC Pharmacol Toxicol. 2014;15:39. - PMC - PubMed
    1. Gulmez S.E., Larrey D., Pageaux G.P., Lignot S., Lassalle R., Jové J., Gatta A., McCormick P.A., Metselaar H.J., Monteiro E., Thorburn D., Bernal W., Zouboulis-Vafiadis I., de Vries C., Perez-Gutthann S., Sturkenboom M., Bénichou J., Montastruc J.L., Horsmans Y., Salvo F., Hamoud F., Micon S., Droz-Perroteau C., Blin P., Moore N. Transplantation for acute liver failure in patients exposed to NSAIDs or paracetamol (acetaminophen): the multinational case-population SALT study. Drug Saf. 2013;36:135–144. - PMC - PubMed

Publication types

MeSH terms

Substances