. 2020 Sep 12;21(18):6673.
doi: 10.3390/ijms21186673.

Mouse Ataxin-2 Expansion Downregulates CamKII and Other Calcium Signaling Factors, Impairing Granule-Purkinje Neuron Synaptic Strength

Affiliations

Mouse Ataxin-2 Expansion Downregulates CamKII and Other Calcium Signaling Factors, Impairing Granule-Purkinje Neuron Synaptic Strength

Aleksandar Arsović et al. Int J Mol Sci. .

Abstract

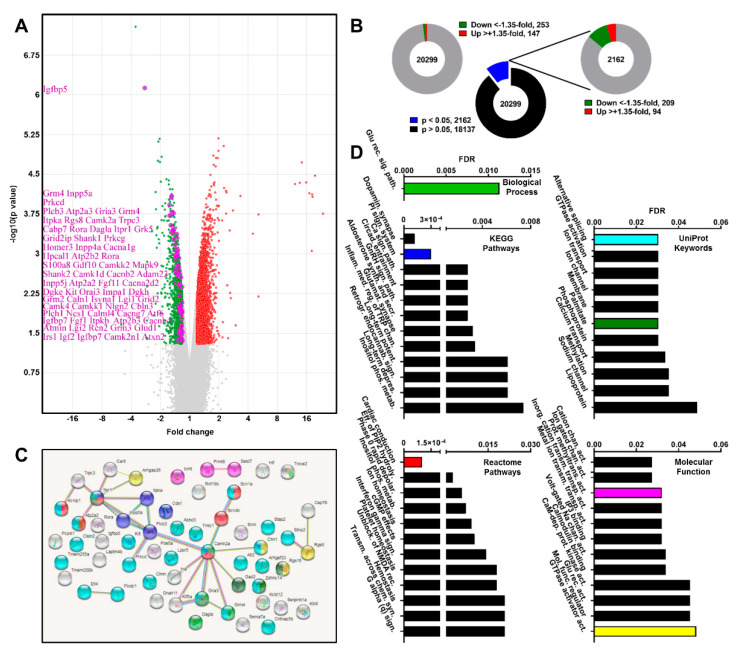
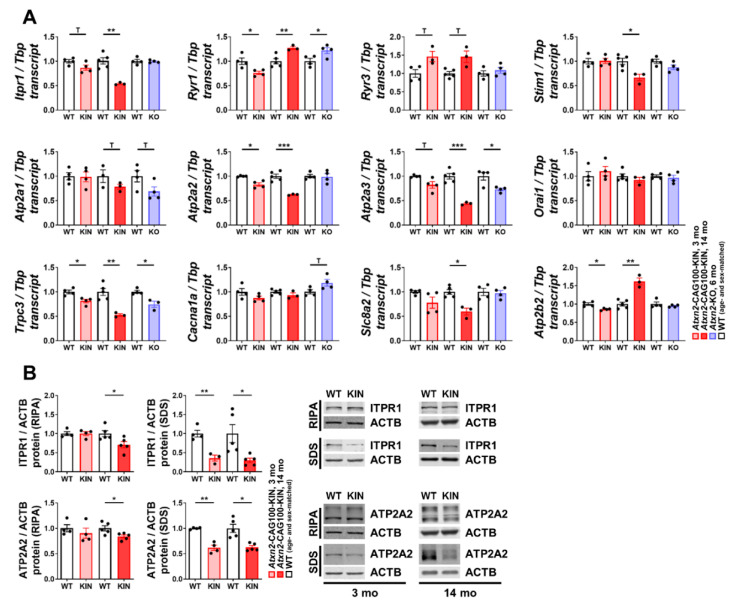
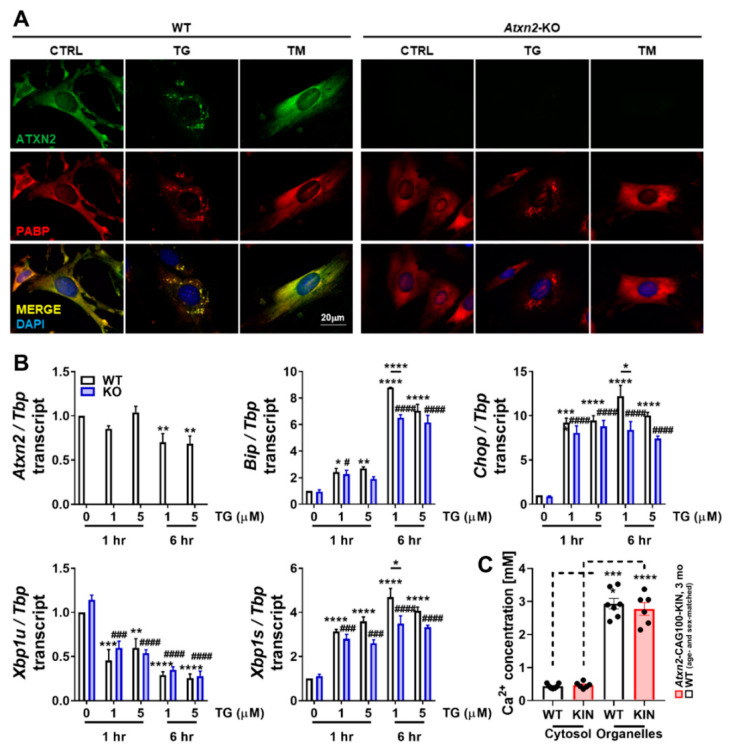
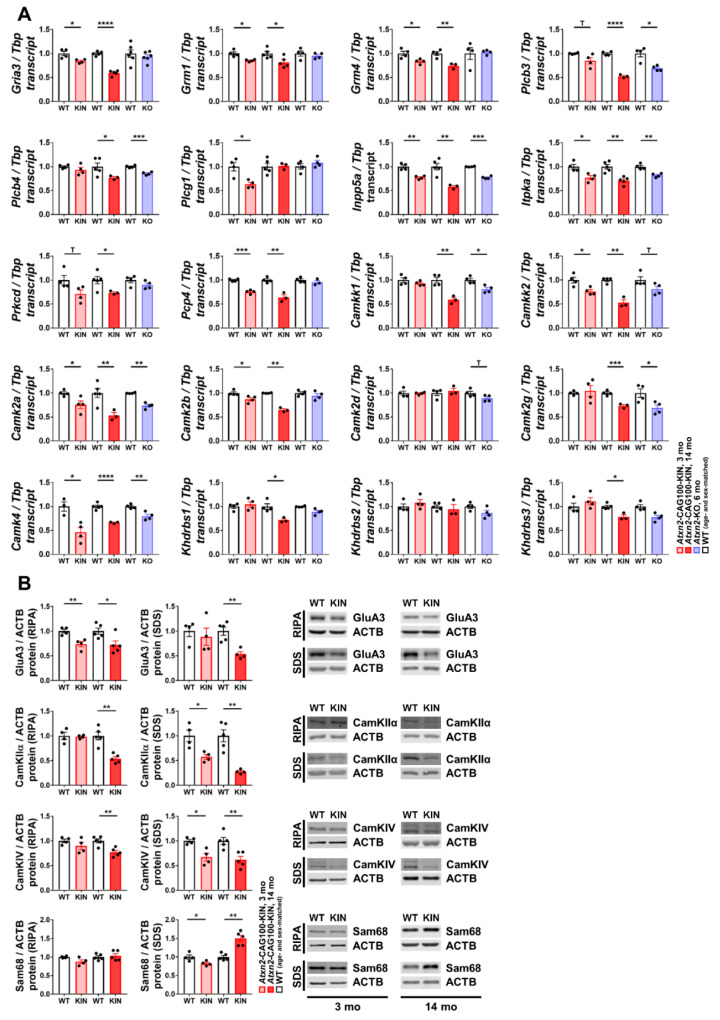
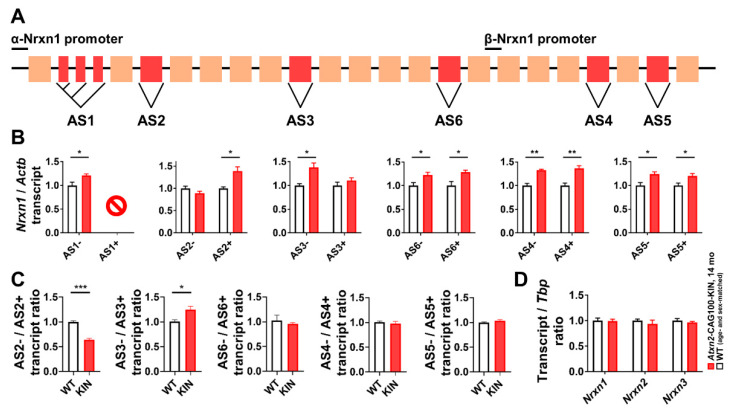
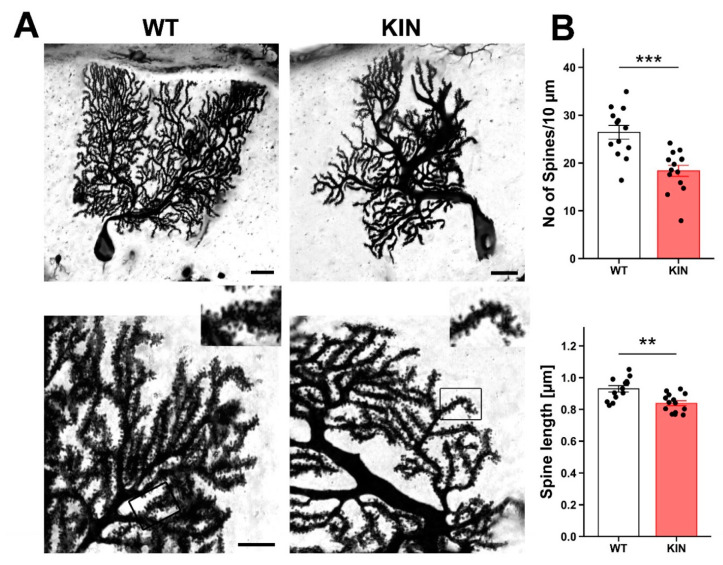
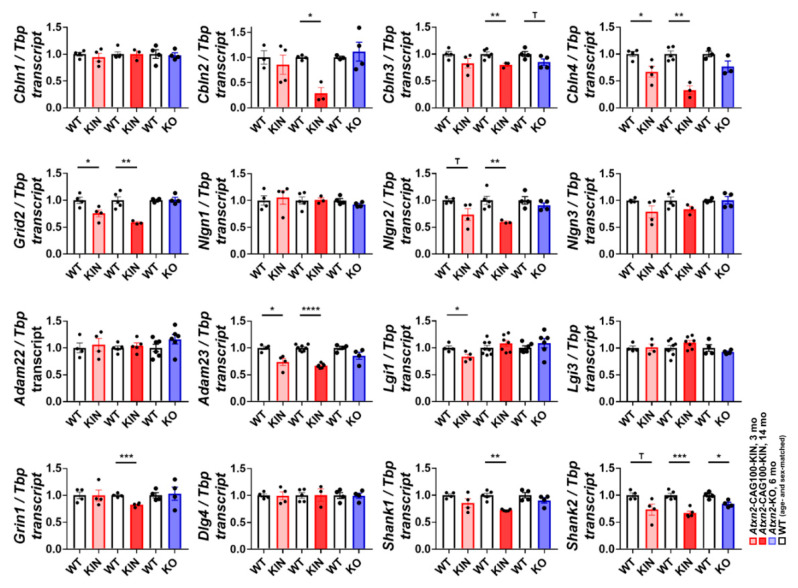
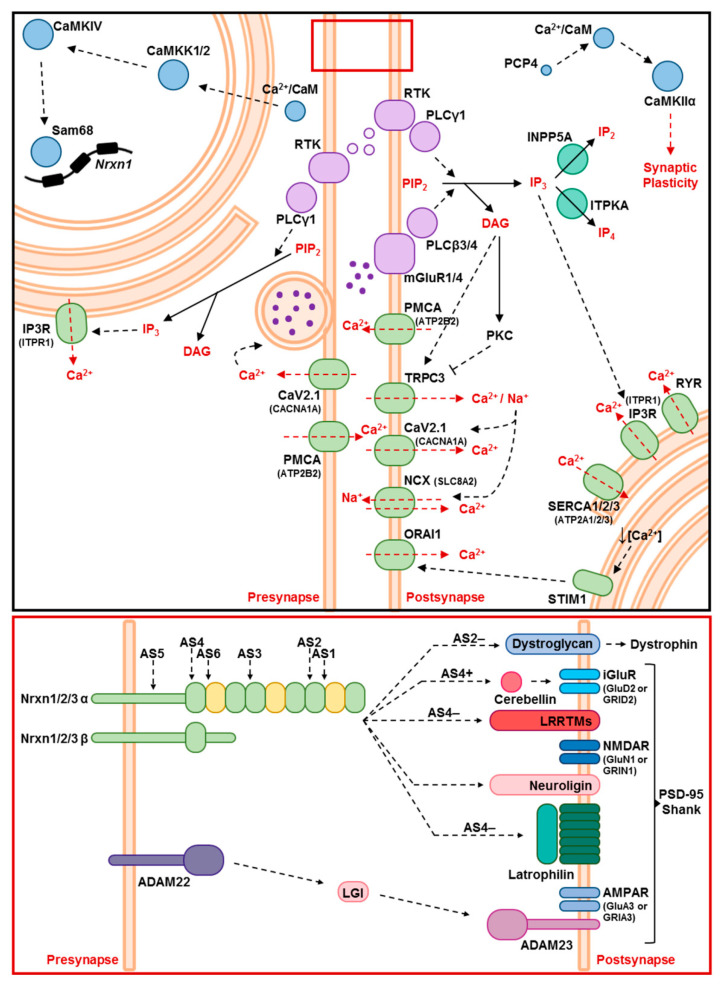
Spinocerebellar ataxia type 2 (SCA2) is caused by polyglutamine expansion in Ataxin-2 (ATXN2). This factor binds RNA/proteins to modify metabolism after stress, and to control calcium (Ca2+) homeostasis after stimuli. Cerebellar ataxias and corticospinal motor neuron degeneration are determined by gain/loss in ATXN2 function, so we aimed to identify key molecules in this atrophic process, as potential disease progression markers. Our Atxn2-CAG100-Knock-In mouse faithfully models features observed in patients at pre-onset, early and terminal stages. Here, its cerebellar global RNA profiling revealed downregulation of signaling cascades to precede motor deficits. Validation work at mRNA/protein level defined alterations that were independent of constant physiological ATXN2 functions, but specific for RNA/aggregation toxicity, and progressive across the short lifespan. The earliest changes were detected at three months among Ca2+ channels/transporters (Itpr1, Ryr3, Atp2a2, Atp2a3, Trpc3), IP3 metabolism (Plcg1, Inpp5a, Itpka), and Ca2+-Calmodulin dependent kinases (Camk2a, Camk4). CaMKIV-Sam68 control over alternative splicing of Nrxn1, an adhesion component of glutamatergic synapses between granule and Purkinje neurons, was found to be affected. Systematic screening of pre/post-synapse components, with dendrite morphology assessment, suggested early impairment of CamKIIα abundance together with the weakening of parallel fiber connectivity. These data reveal molecular changes due to ATXN2 pathology, primarily impacting excitability and communication.

Keywords: K-homology RNA-binding domain; amyotrophic lateral sclerosis (ALS); fragile-X-associated tremor-ataxia syndrome; fronto-temporal-lobar-dementia; inositol signaling; long-term potentiation; neurexin; spatial learning; synaptic plasticity; tauopathies.


Conflict of interest statement

The authors declare no conflict of interest.

Figures

Figure 1
Figure 1
Global transcriptome profile of Atxn2-CAG100-KIN mouse cerebellum at pre-onset stage. (A) Volcano plot analysis of all the quantified mRNAs showing significant up- or downregulations beyond 20% fold-change in red and green, respectively. Highly significant and cerebellar pathology-relevant transcripts among downregulations are colored in magenta. Transcriptome analysis was performed with Affymetrix Clariom D oligonucleotide microarray technology, comparing 3 Atxn2-CAG100-KIN cerebellum samples with 3 age- and sex-matched WT controls. Statistical assessment of the expression data was done using the Affymetrix Transcriptome Analysis Console; (B) Representative diagrams depicting the numbers of all mRNA transcripts measured (20,299), versus those that are dysregulated more than 35%, regardless of statistical significance (253 down, 147 up), with the number of significant alterations among all (2162), and the numbers of nominally significant (p < 0.05) dysregulations in either direction more than 35% (209 down, 94 up); (C) Protein interaction network of the significantly downregulated transcripts (<−1.35 fold) generated with STRING database (https://string-db.org/) revealed a core network with two central nodes of Itpr1 and Camk2a. Many factors in the network contributed to significantly altered pathways and cellular processes identified by Functional Enrichment Analysis function of STRING, and are highlighted in different colors corresponding to the colored bars in the subsequent panel D; (D) Functional Enrichment Analysis results of STRING utilizing GO terms Biological Process, KEGG Pathways, Reactome Pathways, UniProt Keywords and GO terms Molecular Function. Top ten dysregulated pathways and cellular processes are depicted per database for clarity, and complete lists are available in Supplementary Table S2. Colored bars represent pathways corresponding to similarly colored proteins in panel C.
Figure 2
Figure 2
Expression analyses of Ca2+ channels, transporters and associated factors in Atxn2-CAG100-KIN cerebellum throughout the disease course. (A) Transcript levels of various plasma membrane and ER resident Ca2+-associated factors in Atxn2-KO (blue bars) and Atxn2-CAG100-KIN versus WT mouse cerebellum at pre-onset stage of 3 mo (pink bars) and terminal stage of 14 mo (red bars) were measured by RT-qPCR; (B) Protein levels of ER resident Ca2+ channel ITPR1 and transporter ATP2A2 in soluble/cytosolic (RIPA) and insoluble/membrane-associated (SDS) protein fractions of Atxn2-CAG100-KIN mouse cerebellum at pre-onset and final disease stages were determined by quantitative immunoblots. Student’s t-test with Welch’s correction; 0.05 < p < 0.1 T, p < 0.05 *, p < 0.01 **, p < 0.001 ***. Further information regarding individual fold changes and p-values can be found in Supplementary Table S3.
Figure 3
Figure 3
The effect of subcellular Ca2+ imbalance on ATXN2 localization and expression in mouse embryonal fibroblasts. (A) Immunocytochemical assessment of ATXN2 and SG marker PABP in WT and Atxn2-KO MEFs under thapsigargin-(TG, 5 μM, 6 h) or tunicamycin-induced (TM, 10 μg/mL, 6 h) ER stress. ATXN2 relocalization into PABP-positive SGs was observed, solely upon cytosolic Ca2+ imbalance driven by TG, but not upon blockage of N-glycosylation by TM. Atxn2-KO MEFs did not show a difference in SG formation upon TG treatment. (B) Transcriptional regulation of Atxn2 and ER stress markers under TG treatment, in a time- and dosage-dependent setup. Three different clones of WT and Atxn2-KO MEF pairs were treated simultaneously with 1 μM or 5 μM TG for 1 h or 6 h. Stress response was already visible at 1 h for both TG dosages, and further increased at 6 h. While Atxn2 showed a significant downregulation under TG treatment, ER stress markers Bip, Chop and Xbp1s showed a suppressed induction in the absence of ATXN2 in KO cells (blue bars). Expression data obtained by RT-qPCR; (C) Colorimetric Ca2+ concentration measurement in cytosolic and organelle-enriched fractions of WT and Atxn2-CAG100-KIN cerebellum at three mo of age. Higher Ca2+ concentrations were observed in the membrane-encapsulated organelle fraction with no difference between WT and KIN animals. Statistical assessment of the cell culture data was done using 2-way ANOVA with multiple testing corrections. Statistical assessment of the cerebellar Ca2+ measurement was done using Student’s t-test with Welch’s correction; p < 0.05 *, p < 0.01 **, p < 0.001 ***, p < 0.0001 ****. Hashtag (#) indicates comparison of KO cells with untreated KO cells, with p < 0.05 #, p < 0.001 ###, p < 0.0001 ####. Further information regarding individual fold changes and p-values can be found in Supplementary Table S3.
Figure 4
Figure 4
Expression analyses of Ca2+ associated subcellular signaling pathways in Atxn2-CAG100-KIN cerebellum throughout disease course. (A) Transcript levels of cytoplasmic IP3 metabolism components (Gria3, Grm1, Grm4, Plcb3, Plcb4, Plcg1, Inpp5a, Itpka, Prkcd), Ca2+-CaM signaling components (Pcp4, Camkk1, Camkk2, Camk2a, Camk2b, Camk2d, Camk2g, Camk4) and downstream CaMKIV targets (Khdrbs1-3) were quantified by RT-qPCR in Atxn2-KO (blue bars) and Atxn2-CAG100-KIN mouse cerebellum at pre-onset (pink bars) and terminal (red bars) disease stages; (B) Protein levels of GluA3, CaMKIIα, CaMKIV and Sam68 in soluble (RIPA) and insoluble (SDS) fractions of Atxn2-CAG100-KIN mouse cerebellum at pre-onset and final disease stages were determined by quantitative immunoblots. Student’s t-test with Welch’s correction; 0.05 < p < 0.1 T, p < 0.05 *, p < 0.01 **, p < 0.001 ***, p < 0.0001 ****. Further information regarding individual fold changes and p-values can be found in Supplementary Table S3.
Figure 5
Figure 5
Expression analyses of Nrxn1-3 transcripts and alternative splicing isoforms of Nrxn1 in Atxn2-CAG100-KIN cerebellum at 14 mo. (A) Schematic representation of Nrxn1 structure showing six alternative splice (AS) sites. Constitutive exons are depicted in beige and alternatively spliced exons are in red. The transcript structure and spatial distribution of the AS sites were adapted from Treutlein et al. 2014 [70]; (B) Transcript levels of spliced (−) or unspliced (+) variants of Nrxn1 at AS1-6 show altered splicing in Atxn2-CAG100-KIN cerebellum at 14 mo. Site-specific primers were designed to selectively amplify exon inclusion or excision at a given AS site by RT-qPCR. At AS1 site, only AS1(−) isoform lacking all intermediate exons could be quantified with this method, due to the structural complexity of the region and impossibility of proper primer design for all splice variants; (C) Splicing activity ratio at AS2-6 sites of Nrxn1 reveal the missplicing of AS2 and AS3 sites in Atxn2-CAG100-KIN cerebellum at 14 mo. The ratio between spliced (−) to unspliced (+) variants shown in panel B was calculated for each AS site to assess splicing activity at each site. Significantly decreased activity at AS2, and significantly increased splicing at AS3 was observed; (D) Total levels of Nrxn1-3 transcripts measured by RT-qPCR amplifying constitutive exons showed no dysregulation in Atxn2-CAG100-KIN cerebellum at the terminal disease stage. Student’s t-test with Welch’s correction; p < 0.05 *, p < 0.01 **, p < 0.001 ***. Further information regarding individual fold changes and p-values can be found in Supplementary Table S3.
Figure 6
Figure 6
Golgi impregnation of Purkinje cells in WT and Atxn2-CAG100-KIN cerebella at pre-terminal age of 9 mo. (A) Representative images of Purkinje neurons of both genotypes in low and high magnifications. Scale bars indicate 20 µm (upper row) and 10 µm (lower row); in order to be able to appreciate differences in spine length and spine density, an inlet was added showing a dendritic segment at higher magnification. This image is a digital zoom-in at a factor of 2. It can be clearly seen that the density is much less in KIN mice, while the spine length is a little smaller. (B) Significant reductions of spine number and length were observed in Atxn2-CAG100-KIN Purkinje dendrites compared to WT (n = 13 WT vs. 14 KIN Purkinje cells, from 4 WT vs. 3 KIN animals). Levene’s test was used for evaluating equal data distribution, and ANOVA equals t-test was used to compare WT vs. KIN cells; p < 0.01 **, p < 0.001 ***. Further information regarding individual fold changes and p-values can be found in Supplementary Table S3.
Figure 7
Figure 7
Expression analyses of synaptic structure, transmission and dendrite morphology factors. In Atxn2-CAG100-KIN cerebellum throughout disease course at 3 mo and 14 mo of age and in Atxn2-KO cerebellum, transcript levels of Cerebellin isoforms (Cbln1-4), ionotrophic glutamate receptor δ2 (Grid2) and Neuroligin isoforms (Nlgn1-3) were examined as extracellular and postsynaptic interactors of Neurexins in maintaining synaptic integrity. The structural bridge of glutamatergic synapses consisting of Adam22, Adam23, Lgi1 and Lgi3, together with ionotrophic glutamate receptor NMDA type 1 (Grin1) involved in synaptic transmission, post-synaptic density markers PSD95 (Dlg4) and Shank isoforms (Shank1-2) were also quantified throughout disease course by RT-qPCR. Student’s t-test with Welch’s correction; 0.05 < p < 0.1 T, p < 0.05 *, p < 0.01 **, p < 0.001 ***, p < 0.0001 ****. Further information regarding individual fold changes and p-values can be found in Supplementary Table S3.
Figure 8
Figure 8
Schematic representation of the Ca2+ associated signaling cascades and synaptic integrity components investigated in the framework of this project. Bottom panel corresponds to red inset in the top panel. Neurexin structure and preferential interactions were adapted from Südhof T.C. 2017 [68].

Similar articles

Cited by

References

    1. Pulst S.M., Nechiporuk A., Nechiporuk T., Gispert S., Chen X.N., Lopes-Cendes I., Pearlman S., Starkman S., Orozco-Diaz G., Lunkes A., et al. Moderate expansion of a normally biallelic trinucleotide repeat in spinocerebellar ataxia type 2. Nat. Genet. 1996;14:269–276. doi: 10.1038/ng1196-269. - DOI - PubMed
    1. Sanpei K., Takano H., Igarashi S., Sato T., Oyake M., Sasaki H., Wakisaka A., Tashiro K., Ishida Y., Ikeuchi T., et al. Identification of the spinocerebellar ataxia type 2 gene using a direct identification of repeat expansion and cloning technique, DIRECT. Nat. Genet. 1996;14:277–284. doi: 10.1038/ng1196-277. - DOI - PubMed
    1. Imbert G., Saudou F., Yvert G., Devys D., Trottier Y., Garnier J.M., Weber C., Mandel J.L., Cancel G., Abbas N., et al. Cloning of the gene for spinocerebellar ataxia 2 reveals a locus with high sensitivity to expanded CAG/glutamine repeats. Nat. Genet. 1996;14:285–291. doi: 10.1038/ng1196-285. - DOI - PubMed
    1. Velázquez-Pérez L., Seifried C., Santos-Falcón N., Abele M., Ziemann U., Almaguer L.E., Martínez-Góngora E., Sánchez-Cruz G., Canales N., Pérez-González R., et al. Saccade velocity is controlled by polyglutamine size in spinocerebellar ataxia 2. Ann. Neurol. 2004;56:444–447. doi: 10.1002/ana.20220. - DOI - PubMed
    1. Velázquez-Pérez L., Rodríguez-Labrada R., Canales-Ochoa N., Montero J.M., Sánchez-Cruz G., Aguilera-Rodríguez R., Almaguer-Mederos L.E., Laffita-Mesa J.M. Progression of early features of spinocerebellar ataxia type 2 in individuals at risk: A longitudinal study. Lancet Neurol. 2014;13:482–489. doi: 10.1016/S1474-4422(14)70027-4. - DOI - PubMed

LinkOut - more resources