

Urinary Sodium Excretion and Blood Pressure Relationship across Methods of Evaluating the Completeness of 24-h Urine Collections
- PMID: 32932868
- PMCID: PMC7551660
- DOI: 10.3390/nu12092772
Urinary Sodium Excretion and Blood Pressure Relationship across Methods of Evaluating the Completeness of 24-h Urine Collections
Abstract
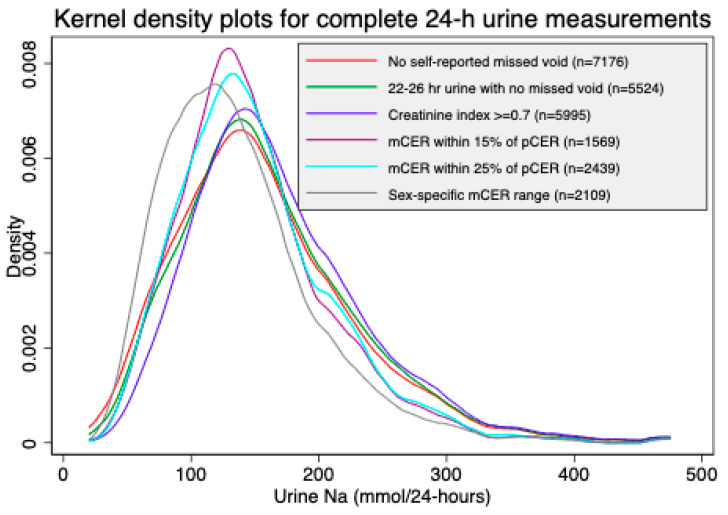
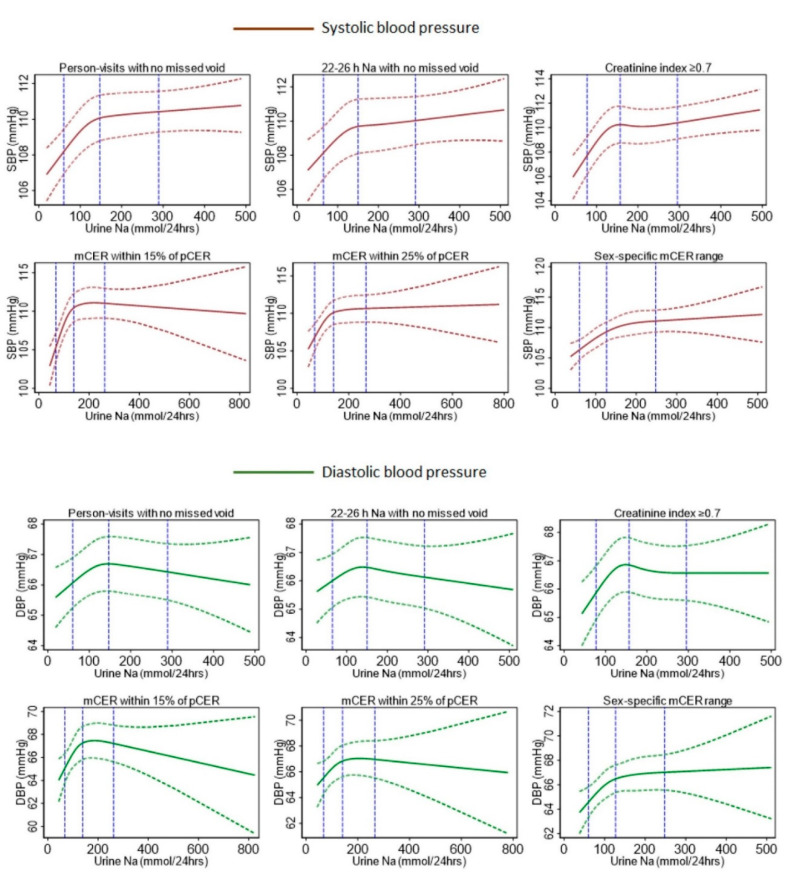
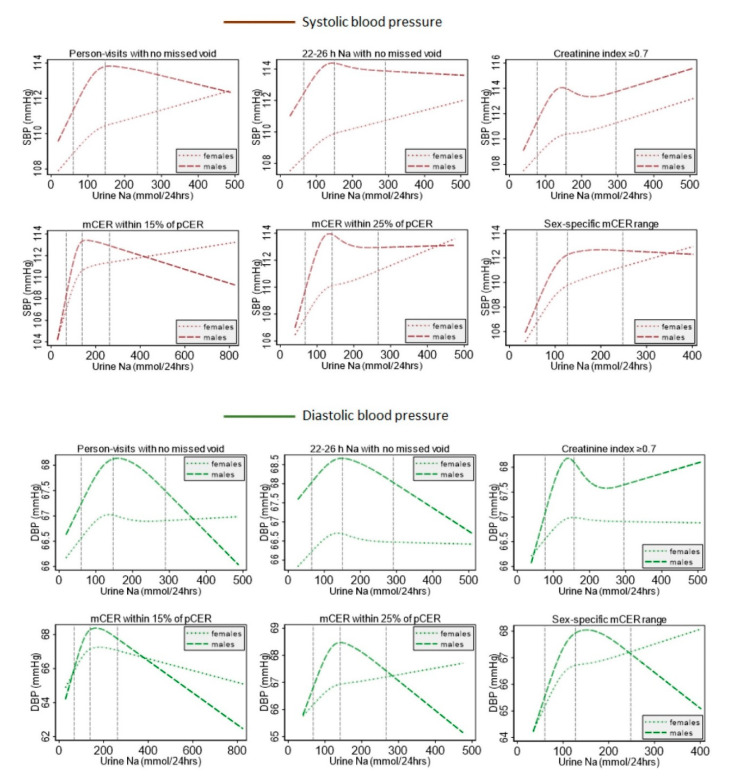
We compared the sodium intake and systolic blood pressure (SBP) relationship from complete 24-h urine samples determined by several methods: self-reported no-missed urine, creatinine index ≥0.7, measured 24-h urine creatinine (mCER) within 25% and 15% of Kawasaki predicted urine creatinine, and sex-specific mCER ranges (mCER 15-25 mg/kg/24-h for men; 10-20 mg/kg/24-h for women). We pooled 10,031 BP and 24-h urine sodium data from 2143 participants. We implemented multilevel linear models to illustrate the shape of the sodium-BP relationship using the restricted cubic spline (RCS) plots, and to assess the difference in mean SBP for a 100 mmol increase in 24-h urine sodium. The RCS plot illustrated an initial steep positive sodium-SBP relationship for all methods, followed by a less steep positive relationship for self-reported no-missed urine, creatinine index ≥0.7, and sex-specific mCER ranges; and a plateaued relationship for the two Kawasaki methods. Each 100 mmol/24-h increase in urinary sodium was associated with 0.64 (95% CI: 0.34, 0.94) mmHg higher SBP for self-reported no-missed urine, 0.68 (95% CI: 0.27, 1.08) mmHg higher SBP for creatinine index ≥0.7, 0.87 (95% CI: 0.07, 1.67) mmHg higher SBP for mCER within 25% Kawasaki predicted urine creatinine, 0.98 (95% CI: -0.07, 2.02) mmHg change in SBP for mCER within 15% Kawasaki predicted urine creatinine, and 1.96 (95% CI: 0.93, 2.99) mmHg higher SBP for sex-specific mCER ranges. Studies examining 24-h urine sodium in relation to health outcomes will have different results based on how urine collections are deemed as complete.
Keywords: blood pressure; complete 24-h urine; salt intake; sodium; urinary sodium.
Conflict of interest statement
The authors declare no conflict of interest.
Figures
Similar articles
-
Comparison of Urinary Sodium and Blood Pressure Relationship From the Spot Versus 24-Hour Urine Samples.J Am Heart Assoc. 2019 Nov 5;8(21):e013287. doi: 10.1161/JAHA.119.013287. Epub 2019 Oct 16. J Am Heart Assoc. 2019. PMID: 31615314 Free PMC article.
-
New salt-sensitivity metrics: variability-adjusted blood pressure change and the urinary sodium-to-creatinine ratio.Ethn Dis. 2002 Winter;12(1):10-9. Ethn Dis. 2002. PMID: 11913598 Clinical Trial.
-
External validation and comparison of formulae estimating 24-h sodium intake from a fasting morning urine sample.J Hypertens. 2018 Apr;36(4):785-792. doi: 10.1097/HJH.0000000000001609. J Hypertens. 2018. PMID: 29120960
-
Nutritional factors in blood pressure.J Hum Hypertens. 1994 Aug;8(8):595-601. J Hum Hypertens. 1994. PMID: 7990088 Review.
-
Comparison of 24-hour urine and 24-hour diet recall for estimating dietary sodium intake in populations: A systematic review and meta-analysis.J Clin Hypertens (Greenwich). 2019 Dec;21(12):1753-1762. doi: 10.1111/jch.13729. Epub 2019 Nov 25. J Clin Hypertens (Greenwich). 2019. PMID: 31769168 Free PMC article.
Cited by
-
Prevalence and risk factors of sarcopenia without obesity and sarcopenic obesity among Chinese community older people in suburban area of Shanghai: A cross-sectional study.Front Aging Neurosci. 2022 Dec 20;14:1034542. doi: 10.3389/fnagi.2022.1034542. eCollection 2022. Front Aging Neurosci. 2022. PMID: 36605360 Free PMC article.
-
Urinary Sodium Excretion and Obesity Markers among Bangladeshi Adult Population: Pooled Data from Three Cohort Studies.Nutrients. 2022 Jul 21;14(14):3000. doi: 10.3390/nu14143000. Nutrients. 2022. PMID: 35889957 Free PMC article.
-
Spot Urine Formulas to Estimate 24-Hour Urinary Sodium Excretion Alter the Dietary Sodium and Blood Pressure Relationship.Hypertension. 2021 Jun;77(6):2127-2137. doi: 10.1161/HYPERTENSIONAHA.120.16651. Epub 2021 Apr 5. Hypertension. 2021. PMID: 33813848 Free PMC article.
-
The direct and urinary electrolyte-mediated effects of ambient temperature on population blood pressure: A causal mediation analysis.Environ Int. 2025 Jan;195:109208. doi: 10.1016/j.envint.2024.109208. Epub 2024 Dec 13. Environ Int. 2025. PMID: 39705978 Free PMC article. Clinical Trial.
-
Sex-Specific Association of Ambient Temperature With Urine Biomarkers in Southwest Coastal Bangladesh.Kidney Int Rep. 2024 Mar 11;9(6):1860-1875. doi: 10.1016/j.ekir.2024.03.002. eCollection 2024 Jun. Kidney Int Rep. 2024. PMID: 38899224 Free PMC article.
References
-
- Forouzanfar M.H., Afshin A., Alexander L.T., Anderson H.R., Bhutta Z.A., Biryukov S., Brauer M., Burnett R., Cercy K., Charlson F.J., et al. Global, regional, and national comparative risk assessment of 79 behavioural, environmental and occupational, and metabolic risks or clusters of risks, 1990–2015: A systematic analysis for the Global Burden of Disease Study 2015. Lancet. 2016;388:1659–1724. doi: 10.1016/S0140-6736(16)31679-8. - DOI - PMC - PubMed
MeSH terms
Substances
Grants and funding
LinkOut - more resources
Full Text Sources
Medical
