. 2020 Sep 11;12(9):2784.
doi: 10.3390/nu12092784.

Dietary Iron Overload Differentially Modulates Chemically-Induced Liver Injury in Rats

Affiliations

Dietary Iron Overload Differentially Modulates Chemically-Induced Liver Injury in Rats

Mutsuki Mori et al. Nutrients. .

Abstract

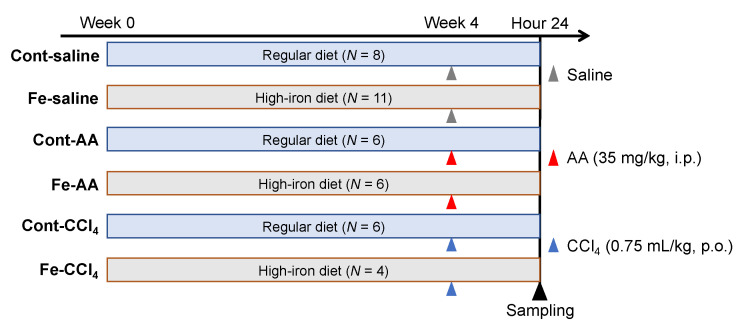
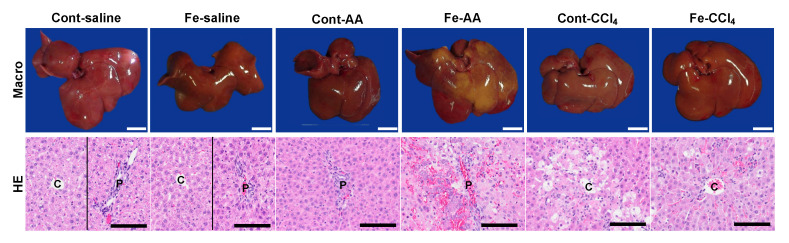
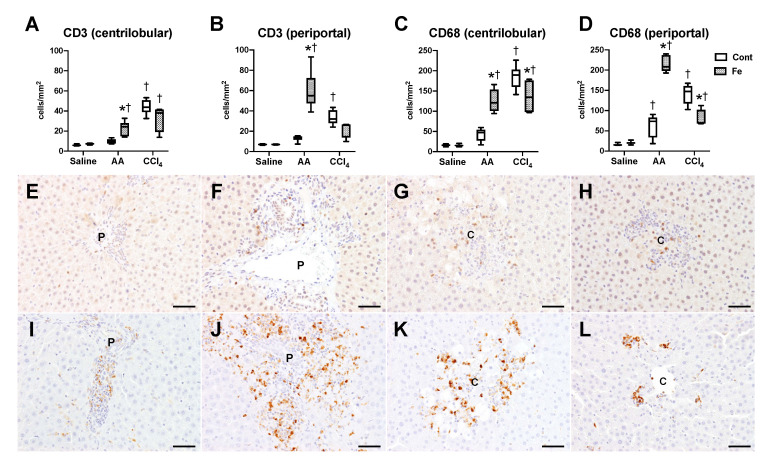
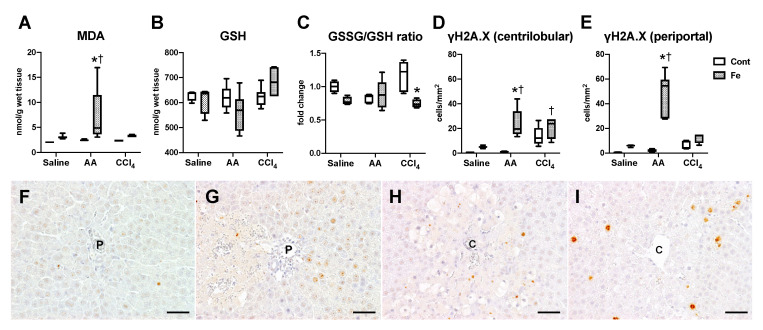
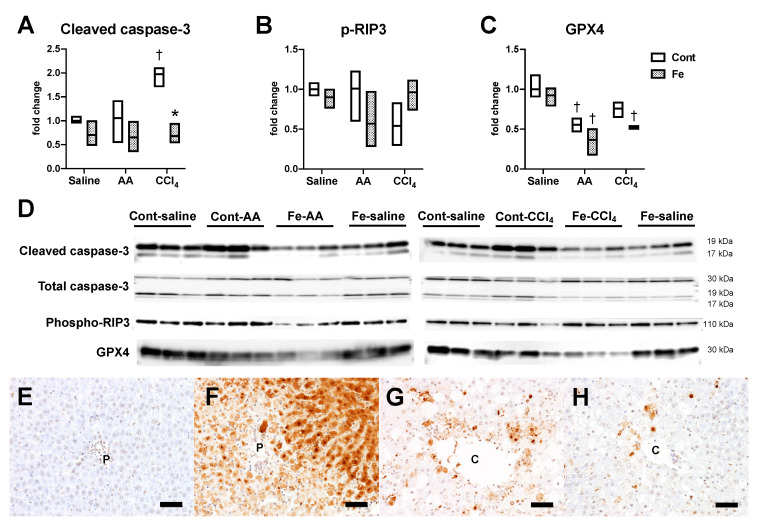
Hepatic iron overload is well known as an important risk factor for progression of liver diseases; however, it is unknown whether it can alter the susceptibility to drug-induced hepatotoxicity. Here we investigate the pathological roles of iron overload in two single-dose models of chemically-induced liver injury. Rats were fed a high-iron (Fe) or standard diet (Cont) for four weeks and were then administered with allyl alcohol (AA) or carbon tetrachloride (CCl4). Twenty-four hours after administration mild mononuclear cell infiltration was seen in the periportal/portal area (Zone 1) in Cont-AA group, whereas extensive hepatocellular necrosis was seen in Fe-AA group. Centrilobular (Zone 3) hepatocellular necrosis was prominent in Cont-CCl4 group, which was attenuated in Fe-CCl4 group. Hepatic lipid peroxidation and hepatocellular DNA damage increased in Fe-AA group compared with Cont-AA group. Hepatic caspase-3 cleavage increased in Cont-CCl4 group, which was suppressed in Fe-CCl4 group. Our results showed that dietary iron overload exacerbates AA-induced Zone-1 liver injury via enhanced oxidative stress while it attenuates CCl4-induced Zone-3 liver injury, partly via the suppression of apoptosis pathway. This study suggested that susceptibility to drugs or chemical compounds can be differentially altered in iron-overloaded livers.

Keywords: acute liver injury; apoptosis; ferroptosis; hepatic iron overload.


Conflict of interest statement

The authors declare no conflict of interest.

Figures

Figure 1
Figure 1
Experimental design of this study. AA; allyl alcohol, CCl4; carbon tetrachloride.
Figure 2
Figure 2
Biochemical parameters for iron metabolism (AC) and for liver enzymes (D,E). * p < 0.05 vs. control diet group with same chemical administration (diet factor), † p < 0.05 vs. saline group with same diet feeding (chemical factor), by Sidak’s multiple comparison. Representative image of iron histochemistry in the liver of Fe-saline group (F). Iron deposition, stained brown with 3,3′-diaminobenzidine (DAB), is more intense in the periportal (Zone 1) hepatocytes than in the centrilobular (Zone 3) hepatocytes. C, central vein; P, portal vein. Bar = 500 μm.
Figure 3
Figure 3
Macroscopic (upper) and hematoxylin and eosin (HE; lower) images of the liver at 24 h after administration of saline, AA, or CCl4. Macroscopically, extensive discoloration, corresponding extensive necrosis in HE, is seen in multiple lobules of Fe-AA group. Diffuse discoloration, consistent with centrilobular necrosis, was seen in Cont-CCl4 group; the microscopic lesion is less prominent in Fe-CCl4 group. C, centrilobular area; P, portal area. Bar = 1 cm (upper) and 100 µm (lower).
Figure 4
Figure 4
The number of CD3-positive T cells (A,B) and CD68-positive macrophages/Kupffer cells (C,D) in the centrilobular (A,C) and periportal/portal (B,D) regions. * p < 0.05 vs. control diet group with same chemical administration (diet factor), † p < 0.05 vs. saline group with same diet feeding (chemical factor), by Sidak’s multiple comparison. Representative images of immunohistochemistry for CD3 (EH) and CD68 (IL) in the liver of Cont-AA (E,I), Fe-AA (F,J), Cont-CCl4 (G,K), and Fe-CCl4 (H,L) groups. P, portal area; C, centrilobular area. Bar = 50 μm.
Figure 5
Figure 5
Hepatic expression of TNFα (A), IFNγ (B), IL1β (C), IL6 (D), CCL2 (E), CXCL1 (F), IL10 (G), IL4 (H), TGFβ1 (I). Data were normalized by the expression of 18S rRNA and are expressed as fold change to Cont-saline group. * p < 0.05 vs. control diet group with same chemical administration (diet factor), † p < 0.05 vs. saline group with same diet feeding (chemical factor), by Sidak’s multiple comparison.
Figure 6
Figure 6
Hepatic content of malondialdehyde (MDA); (A), glutathione (GSH); (B) and the ratio of glutathione disulfide (GSSG) to GSH (C). The number of γH2A.X-positive hepatocytes in the centrilobular (D) and periportal region (E) of the liver. * p < 0.05 vs. control diet group with same chemical administration (diet factor), † p < 0.05 vs. saline group with same diet feeding (chemical factor), by Sidak’s multiple comparison. Representative images of immunohistochemistry for γH2A.X in the liver of Cont-AA (F), Fe-AA (G), Cont-CCl4 (H), and Fe-CCl4 (I) groups. The number of γH2A.X-positive periportal (Zone 1) hepatocytes is higher in the Fe-AA than in Cont-AA group, while the number of γH2A.X-positive centrilobular (Zone 3) hepatocytes does not differ significantly between Cont-CCl4 and Fe-CCl4 groups. P, portal vein; C, central vein. Bar = 50 μm.
Figure 7
Figure 7
Western blot data for cleaved/total caspase-3 (A), phospho-RIP3 (B), and GPX4 (C). * p < 0.05 vs. control diet group with same chemical administration (diet factor), † p < 0.05 vs. saline group with same diet feeding (chemical factor), by Sidak’s multiple comparison. (D) shows the images of the bands analyzed. Representative images of TUNEL assay in the liver of Cont-AA (E), Fe-AA (F), Cont-CCl4 (G) and Fe-CCl4 (H) groups. P, portal vein; C, central vein. Bar = 50 μm.

References

    1. Alempijevic T., Zec S., Milosavljevic T. Drug-induced liver injury: Do we know everything? World J. Hepatol. 2017;9:491–502. doi: 10.4254/wjh.v9.i10.491. - DOI - PMC - PubMed
    1. European Association for the Study of the Liver EASL clinical practice guidelines: Drug-induced liver injury. J. Hepatol. 2019;70:1222–1261. doi: 10.1016/j.jhep.2019.02.014. - DOI - PubMed
    1. Stine J.G., Lewis J.H. Current and future directions in the treatment and prevention of drug-induced liver injury: A systematic review. Expert Rev. Gastroenterol. Hepatol. 2016;10:517–536. doi: 10.1586/17474124.2016.1127756. - DOI - PMC - PubMed
    1. Embade N., Millet O. Molecular Determinants of Chronic Liver Disease as Studied by NMR-Metabolomics. Curr. Top. Med. Chem. 2017;17:2752–2766. doi: 10.2174/1568026617666170707124539. - DOI - PubMed
    1. Forner A., Reig M., Bruix J. Hepatocellular carcinoma. Lancet. 2018;391:1301–1314. doi: 10.1016/S0140-6736(18)30010-2. - DOI - PubMed

MeSH terms