. 2020 Sep 11;21(18):6662.
doi: 10.3390/ijms21186662.

Altered Secretome and ROS Production in Olfactory Mucosa Stem Cells Derived from Friedreich's Ataxia Patients

Affiliations

Altered Secretome and ROS Production in Olfactory Mucosa Stem Cells Derived from Friedreich's Ataxia Patients

Sara Pérez-Luz et al. Int J Mol Sci. .

Abstract

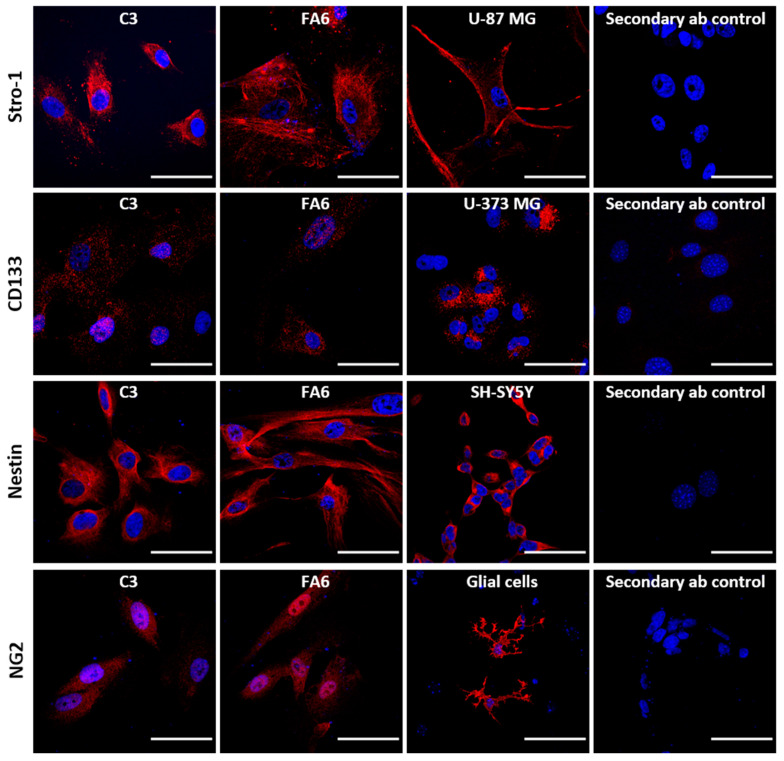
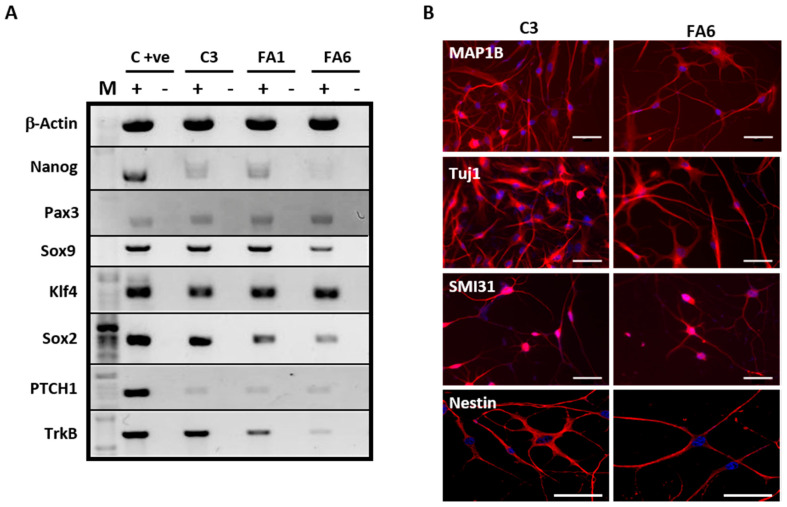
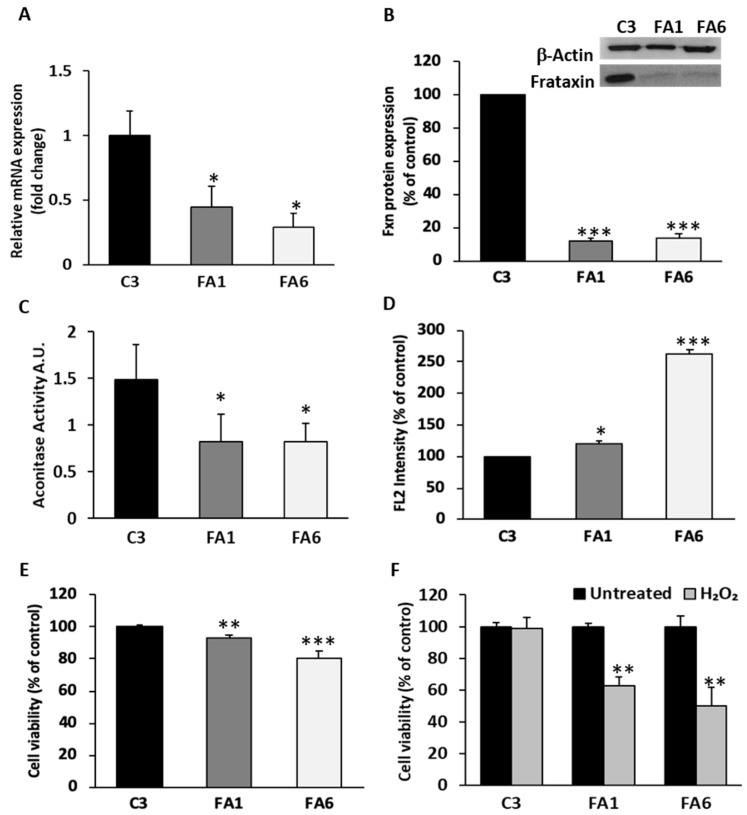
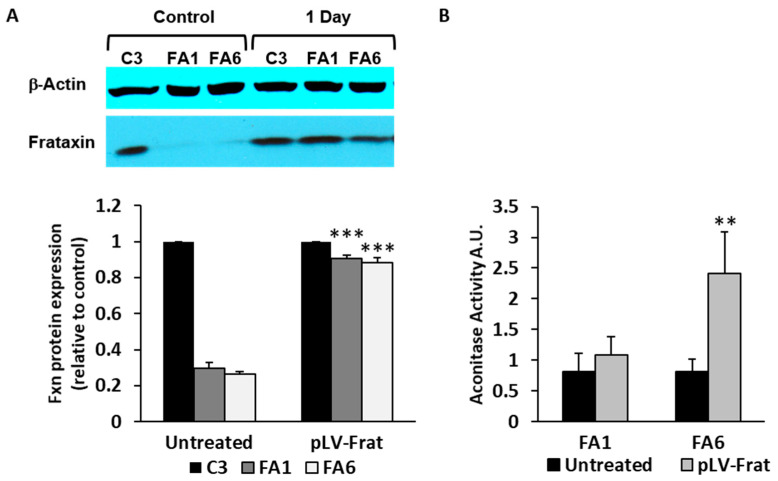
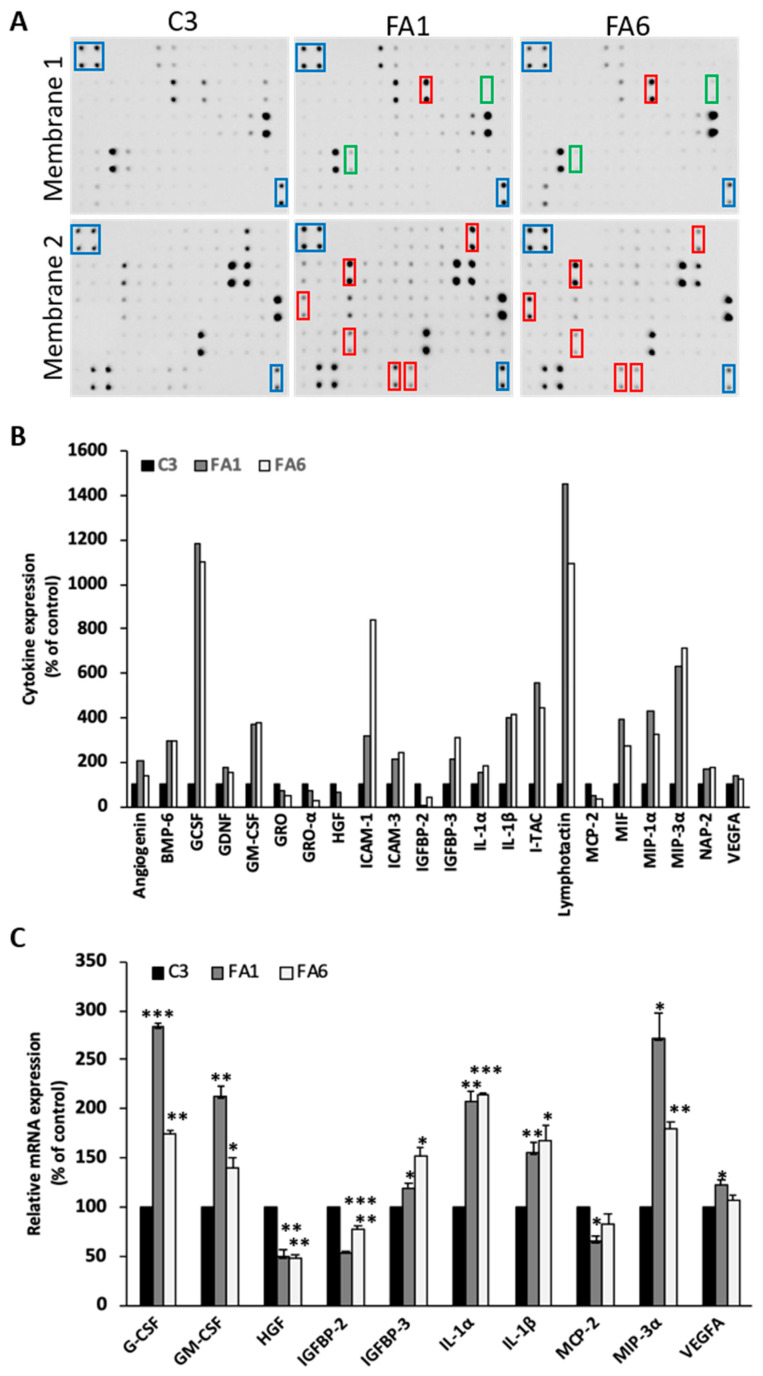
Friedreich's ataxia is the most common hereditary ataxia for which there is no cure or approved treatment at present. However, therapeutic developments based on the understanding of pathological mechanisms underlying the disease have advanced considerably, with the implementation of cellular models that mimic the disease playing a crucial role. Human olfactory ecto-mesenchymal stem cells represent a novel model that could prove useful due to their accessibility and neurogenic capacity. Here, we isolated and cultured these stem cells from Friedreich´s ataxia patients and healthy donors, characterizing their phenotype and describing disease-specific features such as reduced cell viability, impaired aconitase activity, increased ROS production and the release of cytokines involved in neuroinflammation. Importantly, we observed a positive effect on patient-derived cells, when frataxin levels were restored, confirming the utility of this in vitro model to study the disease. This model will improve our understanding of Friedreich´s ataxia pathogenesis and will help in developing rationally designed therapeutic strategies.

Keywords: Frataxin; Friedreich´s ataxia; gene therapy; stem cells human olfactory mucosa.


Conflict of interest statement

The authors declare no conflict of interest.

Figures

Figure 1
Figure 1
OE-MSC immunocytochemical characterization. Representative immunofluorescence confocal photomicrographs of mucosa-derived mesenchymal stem cells (C3 and FA6) labelled in red with Stro-1, CD133, Nestin and NG2. Nuclei were stained with DAPI (blue). Scale bars = 50 μm.
Figure 2
Figure 2
OE-MSC expression of different pluripotent and stem cell markers. (A) RT-PCR showing the expression of different markers for stemness and pluripotency in OE-MSCs. Expression of the housekeeping gene for β-Actin was used as a reference control. M: 1Kb ladder, C+ve: PCR reaction control using hESC H9 cell line (Nanog, Klf4, and Sox2) and neuronally differentiated SH-SY5Y cells (Sox9, Pax3, PTCH1 and TrkB), (+): cDNA used as template for PCR amplified with RT enzyme, (−): no RT enzyme. (B) Immunophenotyping of C3 and FA6 samples showed these cells are positive (red) when stained with antibodies specific for MAP1B, Tuj1, SMI31 and Nestin. DAPI staining is shown in blue. Scale bars = 50 μm.
Figure 3
Figure 3
Number of GAA repeats in FRDA-derived OE-MSCs. (A) Schematic representation of the location of the primers used for the PCR. (B) Gel showing the number of GAA trinucleotide repeat in the different cell lines. PCR was carried out at two different passages (P) to check for in vitro GAA variations. C3 samples were analyzed at passage 15 and 20 (P15 and P20, respectively), FA1 at passage 21 and 24 (P21 and P24, respectively), and FA6 at passage 11 and 19 (P11 and P19, respectively). M: 1 kb ladder (Biotools), C3: cells derived from a healthy donor, FA1 and FA6: cells derived from FRDA patients.
Figure 4
Figure 4
FRDA-patient-derived OE-MSCs phenotype. (A) Quantification of frataxin mRNA expression in the three cell lines. FA1 and F6 frataxin levels are expressed relative to control levels (C3). Values were normalized to β-actin and the histogram represents the mean fold change ± SEM from three independent experiments. (B) Representative Western blot showing frataxin expression in OE-MSCs. The bar graph shows the corresponding quantification of values normalized to β-actin. Values are expressed as mean ± SEM relative to C3 cells. * p < 0.05; *** p < 0.005 compared to control. (C) Bar graph showing aconitase activity assessed in the three samples of mucosa-derived OE-MSCs. The activity of aconitase enzyme in FRDA patients (FA1 and FA6) is almost reduced to half its normal activity compared with control cells (C3). (D) Quantification of ROS levels by flow cytometry using the fluorophore MitoSOX also revealed an abnormal production of ROS in patient-derived cells, which is quite elevated in FA6 cells. (E) Viability measurements in OE-MSCs show a reduced number of patient-derived cells (light and dark grey bars) relative to control cells (black bar). (F) Percentage of cell survival in C3, FA1 and FA6 cells after 24 h of H2O2 treatment (dark grey). In (AE), data represent the mean ± SEM from three independent experiments. * p < 0.05; ** p < 0.01; *** p < 0.001 vs. C3. In (F), ** p < 0.001 vs. Untreated FA1 and FA6, respectively.
Figure 5
Figure 5
Frataxin rescue in OE-MSCs revert the abnormal phenotype. (A) Representative Western blot of OE-MSCs transduced for 24 h with pLV-Frat, a lentivector encoding a cDNA for frataxin. The bottom left graph shows the quantification after normalization to β-actin and densitometry. Values are expressed as mean ± SEM and cells are compared with their respective non-transduced (untreated) control. *** p < 0.005. (B) Aconitase levels (arbitrary units) in FA1 and FA6 cells, after 24 h of frataxin overexpression. Data represent the mean ± SEM of three independent experiments. ** p < 0.005 compared with non-transduced FA6.
Figure 6
Figure 6
Cytokine profile of FRDA patient-derived OE-MSCs. (A) Representative antibody-based membrane arrays incubated with serum-free medium from C3, FA1 and FA6 OE-MSCs. Rectangles indicate positive controls (blue), some upregulated cytokines (red) and some downregulated cytokines (green). (B) Bar graph showing the quantification of selected up-regulated and downregulated cytokines released by the three cell lines and normalized to C3 levels. (C) Q-PCR amplification of selected cytokines. mRNAs from the different OE-MSCs were quantified using the Ct method. Values are expressed as mean ± SEM in relative percentage of control cells from three independent samples. * p < 0.05; ** p < 0.005; *** p < 0.001 compared with C3.

Similar articles

Cited by

References

    1. Koeppen A.H., Mazurkiewicz J.E. Friedreich ataxia: Neuropathology revised. J. Neuropathol. Exp. Neurol. 2013;72:78–90. doi: 10.1097/NEN.0b013e31827e5762. - DOI - PMC - PubMed
    1. Weidemann F., Stork S., Liu D., Hu K., Herrmann S., Ertl G., Niemann M. Cardiomyopathy of Friedreich ataxia. J. Neurochem. 2013;126:88–93. doi: 10.1111/jnc.12217. - DOI - PubMed
    1. Cnop M., Mulder H., Igoillo-Esteve M. Diabetes in Friedreich ataxia. J. Neurochem. 2013;126:94–102. doi: 10.1111/jnc.12216. - DOI - PubMed
    1. Evans-Galea M.V., Lockhart P.J., Galea C.A., Hannan A.J., Delatycki M.B. Beyond loss of frataxin: The complex molecular pathology of Friedreich ataxia. Discov. Med. 2014;17:25–35. - PubMed
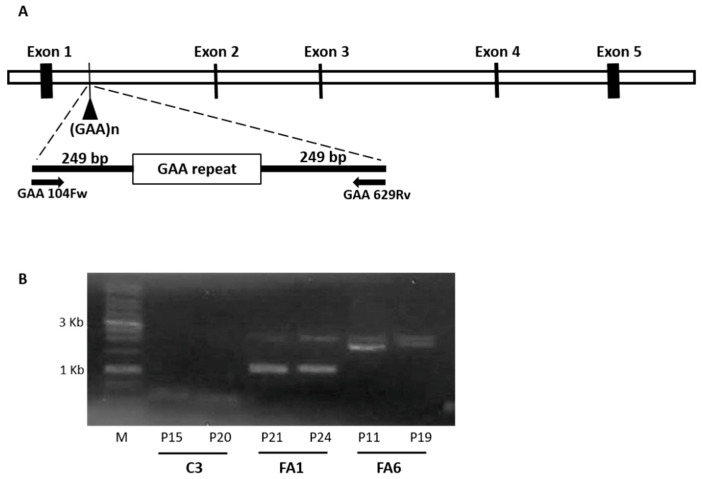
    1. Campuzano V., Montermini L., Moltò M.D., Pianese L., Cossée M., Cavalcanti F., Monros E., Rodius F., Duclos F., Monticelli A., et al. Friedreich’s ataxia: Autosomal recessive disease caused by an intronic GAA triplet repeat expansion. Science. 1996;271:1423–1427. doi: 10.1126/science.271.5254.1423. - DOI - PubMed