. 2020 Sep 11;10(9):634.
doi: 10.3390/brainsci10090634.

Levetiracetam Reduced the Basal Excitability of the Dentate Gyrus without Restoring Impaired Synaptic Plasticity in Rats with Temporal Lobe Epilepsy

Affiliations

Levetiracetam Reduced the Basal Excitability of the Dentate Gyrus without Restoring Impaired Synaptic Plasticity in Rats with Temporal Lobe Epilepsy

Guillermo González-H et al. Brain Sci. .

Abstract

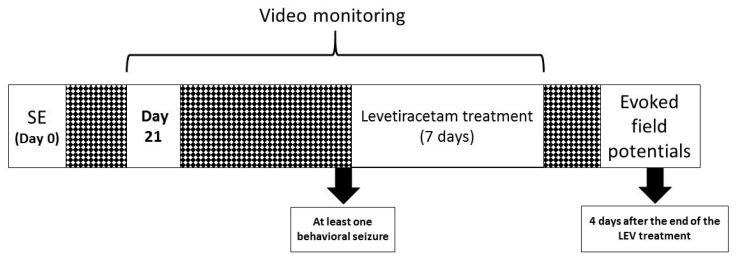
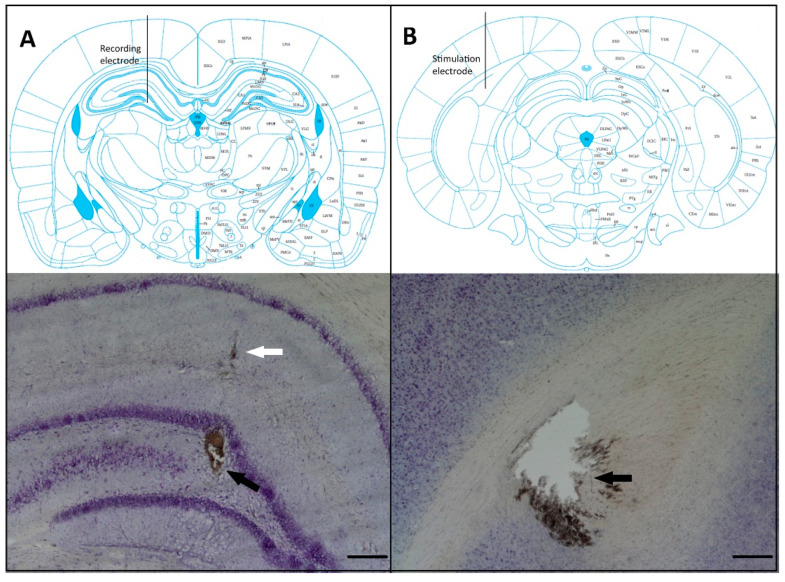
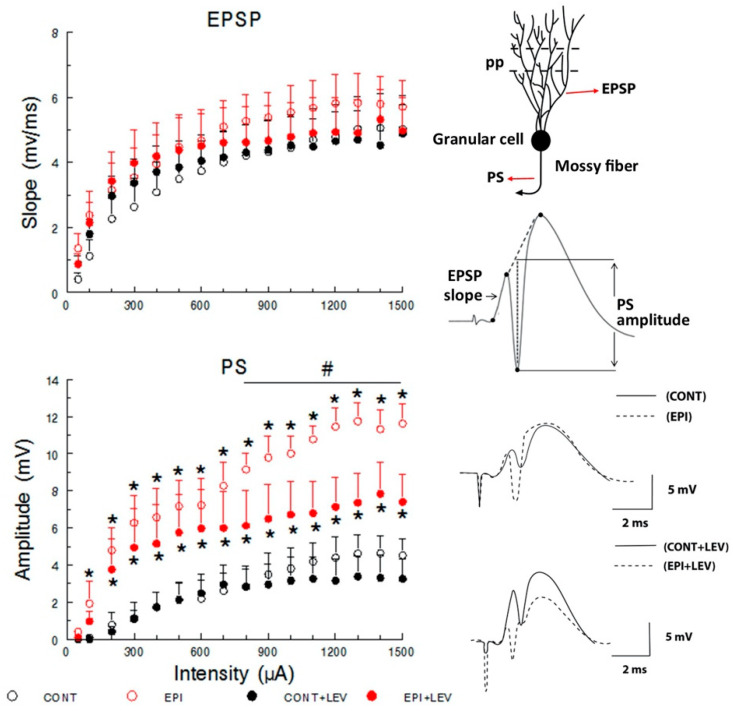
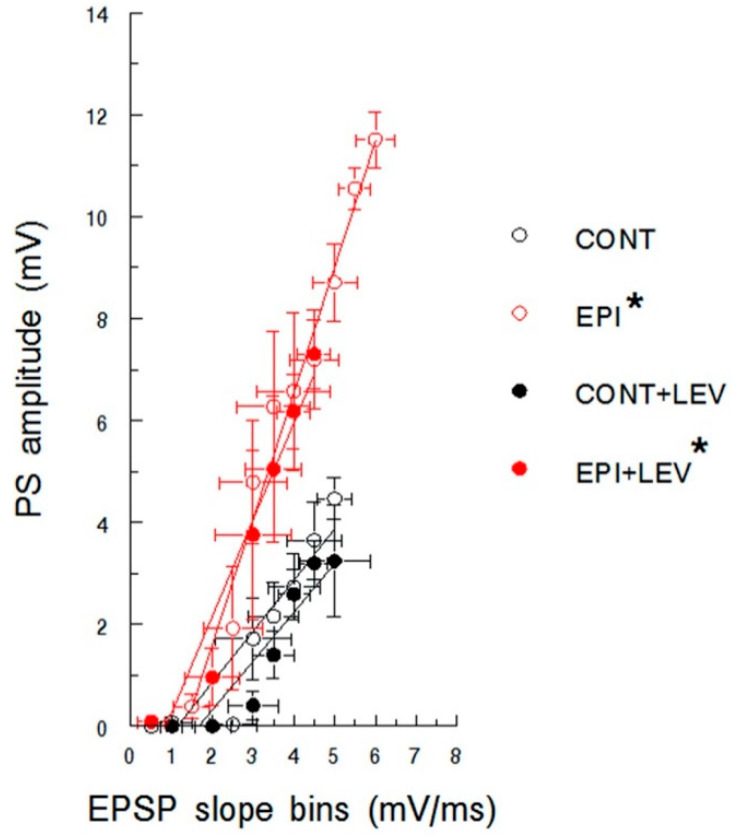
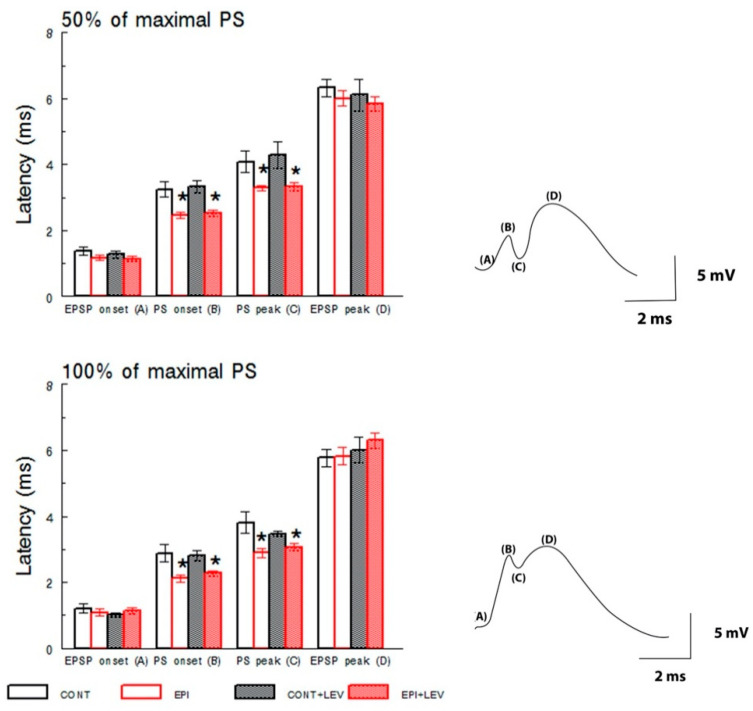
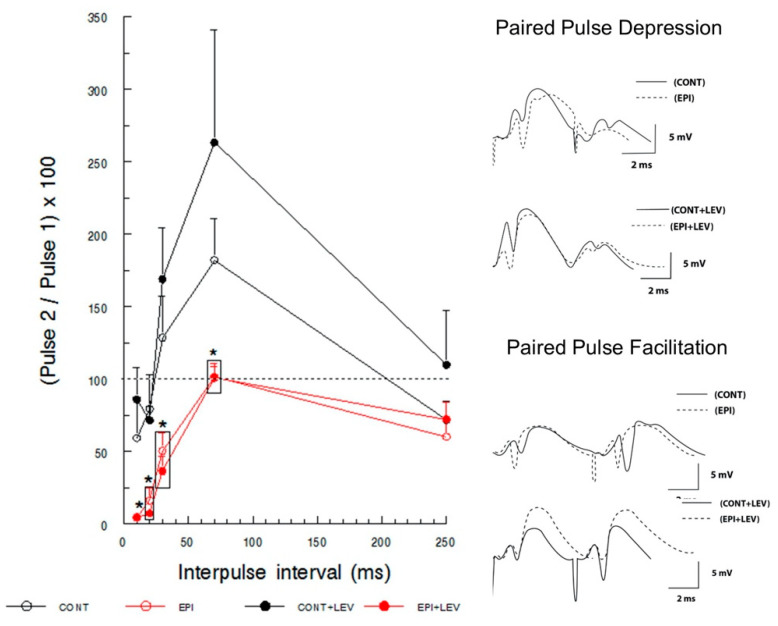
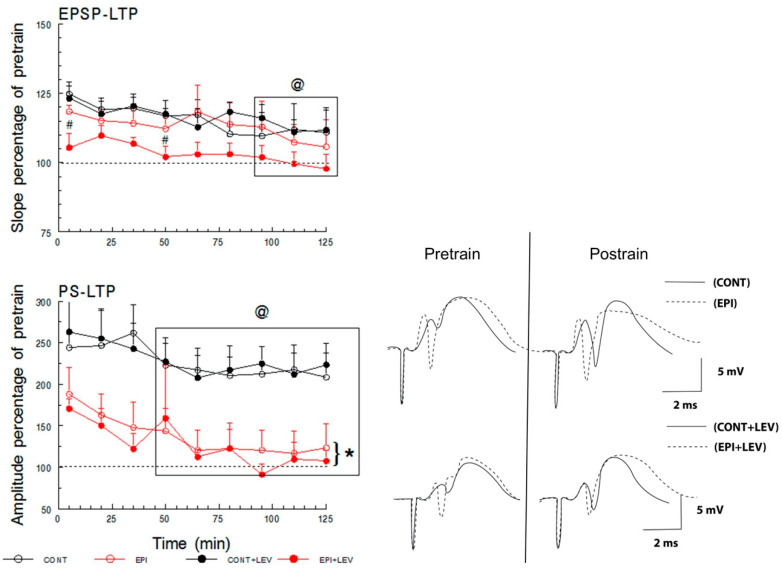
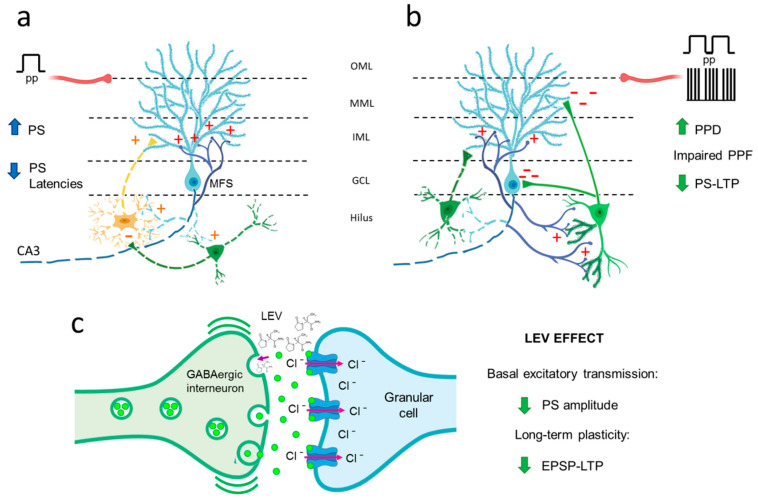
Temporal lobe epilepsy (TLE), the most common type of focal epilepsy, affects learning and memory; these effects are thought to emerge from changes in synaptic plasticity. Levetiracetam (LEV) is a widely used antiepileptic drug that is also associated with the reversal of cognitive dysfunction. The long-lasting effect of LEV treatment and its participation in synaptic plasticity have not been explored in early chronic epilepsy. Therefore, through the measurement of evoked field potentials, this study aimed to comprehensively identify the alterations in the excitability and the short-term (depression/facilitation) and long-term synaptic plasticity (long-term potentiation, LTP) of the dentate gyrus of the hippocampus in a lithium-pilocarpine rat model of TLE, as well as their possible restoration by LEV (1 week; 300 mg/kg/day). TLE increased the population spike (PS) amplitude (input/output curve); interestingly, LEV treatment partially reduced this hyperexcitability. Furthermore, TLE augmented synaptic depression, suppressed paired-pulse facilitation, and reduced PS-LTP; however, LEV did not alleviate such alterations. Conversely, the excitatory postsynaptic potential (EPSP)-LTP of TLE rats was comparable to that of control rats and was decreased by LEV. LEV caused a long-lasting attenuation of basal hyperexcitability but did not restore impaired synaptic plasticity in the early chronic phase of TLE.

Keywords: evoked field potentials; inhibitory transmission; levetiracetam; synaptic plasticity; temporal lobe epilepsy.


Conflict of interest statement

The authors declare no conflicts of interest, financial or otherwise.

Figures

Figure 1
Figure 1
Experimental design. At time 0, status epilepticus (SE) was induced in male Wistar rats via lithium–pilocarpine administration. Three weeks after SE induction, rats were video monitored until the first spontaneous behavioral seizure was detected and then treated with levetiracetam (300 mg/kg/day) for one week. Four days after the end of the treatment, electrophysiological experiments were conducted; finally, animals were intracardially perfused, and brain dissection was performed.
Figure 2
Figure 2
Recording and stimulation electrode placement. (A) The top panel shows a schematic drawing of coronal sections illustrating the recording electrode placement in the hilus of the dentate gyrus (from Paxinos and Watson [40]). The bottom panel shows a photomicrograph of a Nissl-stained section showing the recording site of the extracellular field potentials (black arrow); the white arrow indicates the trajectory of the electrode. (B) The top panel shows a schematic drawing of the coronal section illustrating the stimulation electrode placement in the perforant pathway. The bottom panel shows a photomicrograph of a Nissl-stained section depicting the stimulation site (black arrow). Scale bars 250 μm.
Figure 3
Figure 3
Input–output curve of the excitatory postsynaptic potential (EPSP) slope (top) and the population spike (PS) amplitude (bottom) in control (CONT) and epileptic (EPI) rats and control (CONT + LEV) and epileptic (EPI + LEV) rats after one week of levetiracetam (LEV) treatment (300 mg/kg/day). Field extracellular potentials were evoked in anesthetized rats by stimulation of the perforant path (pp) and were recorded in the dentate gyrus (top right). Data are presented as the means + standard error of the mean (S.E.M.), * p < 0.05 vs. CONT and CONT + LEV groups; # p < 0.05 vs. EPI + LEV group; three-way repeated-measures (RM) ANOVA followed by the Student–Newman–Keuls post-hoc test; n = 6 to 7 animals per group. At the (top right), a typical response to a high-intensity pulse, the slope of the rising positive phase (EPSP) and the negative superimposed PS are depicted. At the (bottom right), representative examples of traces showing the morphology of evoked field potentials are presented.
Figure 4
Figure 4
Excitability curve plotting population spike (PS) amplitude as a function of excitatory postsynaptic potential (EPSP) slope in control (CONT) and epileptic (EPI) rats and control (CONT + LEV) and epileptic (EPI + LEV) rats after one week of levetiracetam (LEV) treatment (300 mg/kg/day). Field extracellular potentials were evoked in anesthetized rats by stimulation of the perforant path and were recorded in the dentate gyrus. EPSP slopes were sorted into 0.5 mV/ms bins. Data are presented as the means ± S.E.M. * p < 0.05 vs. CONT and CONT + LEV groups, Student’s t-test for comparing slopes.
Figure 5
Figure 5
Latencies of excitatory postsynaptic potentials (EPSPs) and population spike (PS) at intensities that produced 50% (top) or 100% (bottom) of the maximal PS according to the input–output curve in control (CONT) and epileptic (EPI) rats and control (CONT + LEV) and epileptic (EPI + LEV) rats after one week of levetiracetam (LEV) treatment (300 mg/kg/day). Field extracellular potentials were evoked in anesthetized rats by stimulation of the perforant path and were recorded in the dentate gyrus. Data are represented as the means ± S.E.M., * p < 0.05 vs. CONT and CONT + LEV groups; two-way ANOVA followed by the Student–Newman–Keuls post-hoc test; n = 6 to 9 animals per group. On the right, representative examples of traces showing the latencies of evoked field potentials are presented. EPSP onset (A), PS onset (B), PS peak (C) and EPSP peak (D).
Figure 6
Figure 6
Paired-pulse depression and facilitation of population spike (PS) in control (CONT) and epileptic (EPI) rats and control (CONT + LEV) and epileptic (EPI + LEV) rats after one week of levetiracetam (LEV) treatment (300 mg/kg/day). Field extracellular postsynaptic potentials were evoked by perforant path stimulation and recorded in the dentate gyrus at intensities that produced 100% of the maximal PS from the input–output curve with interpulse intervals (IPIs) of 10, 20, 30, 70 and 250 ms. Data are represented as the means + S.E.M. of paired-pulse percentages ((pulse 2 amplitude/pulse 1 amplitude) × 100); a percentage < 100% reflects depression and a percentage > 100% reflects facilitation. * p < 0.05 vs. CONT and CONT + LEV groups. Three-way RM ANOVA followed by the Student–Newman–Keuls post-hoc test; n = 7 to 9 animals per group. On the right, representative examples of traces showing the depression and facilitation of evoked field potentials are presented.
Figure 7
Figure 7
Long-term potentiation (LTP) of the excitatory postsynaptic potential (EPSP) and population spike (PS) recorded in the dentate gyrus. LTP of the EPSP slope (top) and PS amplitude (bottom) in control (CONT) and epileptic (EPI) rats and control (CONT + LEV) and epileptic (EPI + LEV) rats after one week of levetiracetam (LEV) treatment (300 mg/kg/day) are presented as percentages of baseline (pretrain) values. LTP was induced with trains of 1500 µA, and pre- and post-train field extracellular potentials were evoked at intensities that produced 50% of the maximal PS from the input–output curve. Data are represented as the means + S.E.M., # p < 0.05 vs. EPI group; @ p < 0.05 vs. time = 5 min; * p < 0.05 vs. CONT and CONT+LEV groups. Three-way RM ANOVA followed by the Student–Newman–Keuls post-hoc test; n = 6 to 7 animals per group. Representative examples of traces showing pre- and post-train field extracellular potentials are presented in the bottom right.
Figure 8
Figure 8
Hypothetical schematic representation of the dentate gyrus (DG) environment in TLE rats and the levetiracetam (LEV) mechanism of action. (a) As a consequence of the death of mossy cells (yellow dotted), GABAergic cells (green dotted), and pyramidal CA3 cells (not shown), the granule cells (blue cell) remains without postsynaptic targets; their axons then “sprout” and innervate the dendrites of other granule cells (not shown) and themselves, generating the mossy fiber sprouting (MFS) and inducing granule cell hyperexcitability [1,43]. The clear augment of the population spike (PS) amplitude and the significant reduction in the onset- and peak-PS latencies in the basal excitatory transmission of TLE rats supports this phenomenon. (b) The hyperexcitability of granule cells in TLE could over-activate the surviving GABAergic interneurons (right green), increasing local inhibition. In addition, the loss of interneurons (left green dotted) provokes aberrant connections between the axons of granule cells and remaining GABAergic interneurons, which, in turn, may develop new dendritic spines and, thus, new synaptic contacts [48,51,52]. All this together would promote a hyperinhibitory environment; this could explain the changes in the short and long-term synaptic plasticity in TLE rats, such as strong depression (PPD) and the absence of facilitation (PPF) by paired pulses, and the decrease in PS long-term potentiation (PS-LTP). (c) The partial recovery of PS amplitude in basal excitatory transmission and the decrease in excitatory postsynaptic potential (EPSP)-LTP slope by LEV, could be associated with the potentiation of the GABAergic signaling through the increase in the release of γ-aminobutyric acid (GABA), suggesting that LEV may act as an effective antiseizure agent that suppresses the firing of glutamatergic neurons in the DG. OML: outer molecular layer; MML: middle molecular layer; IML: inner molecular layer; GCL: granule cell layer; pp: perforant pathway (red axon).

References

    1. Ngugi A.K., Bottomley C., Kleinschmidt I., Sander J.W., Newton C.R. Estimation of the burden of active and life-time epilepsy: A meta-analytic approach. Epilepsia. 2010;51:883–890. doi: 10.1111/j.1528-1167.2009.02481.x. - DOI - PMC - PubMed
    1. Stafstrom C.E. Pathophysiological mechanisms of seizures and epilepsy: A primer. In: Rho J.M., Sankar R., Stafstrom C.E., editors. Epilepsy: Mechanisms, Models, and Translational Perspectives. CRC Press; Boca Raton, FL, USA: 2010. pp. 3–17.
    1. Engel J., Jr. Mesial temporal lobe epilepsy: What have we learned? Neurosci. Rev. J. Bringing Neurobiol. Neurol. Psychiatry. 2001;7:340–352. doi: 10.1177/107385840100700410. - DOI - PubMed
    1. Semah F., Picot M.C., Adam C., Broglin D., Arzimanoglou A., Bazin B., Cavalcanti D., Baulac M. Is the underlying cause of epilepsy a major prognostic factor for recurrence? Neurology. 1998;51:1256–1262. doi: 10.1212/WNL.51.5.1256. - DOI - PubMed
    1. Tellez-Zenteno J.F., Hernandez-Ronquillo L. A review of the epidemiology of temporal lobe epilepsy. Epilepsy Res. Treat. 2012;2012:630853. doi: 10.1155/2012/630853. - DOI - PMC - PubMed

LinkOut - more resources