

Intra-Tumoral Angiogenesis Is Associated with Inflammation, Immune Reaction and Metastatic Recurrence in Breast Cancer
- PMID: 32933189
- PMCID: PMC7555442
- DOI: 10.3390/ijms21186708
Intra-Tumoral Angiogenesis Is Associated with Inflammation, Immune Reaction and Metastatic Recurrence in Breast Cancer
Abstract
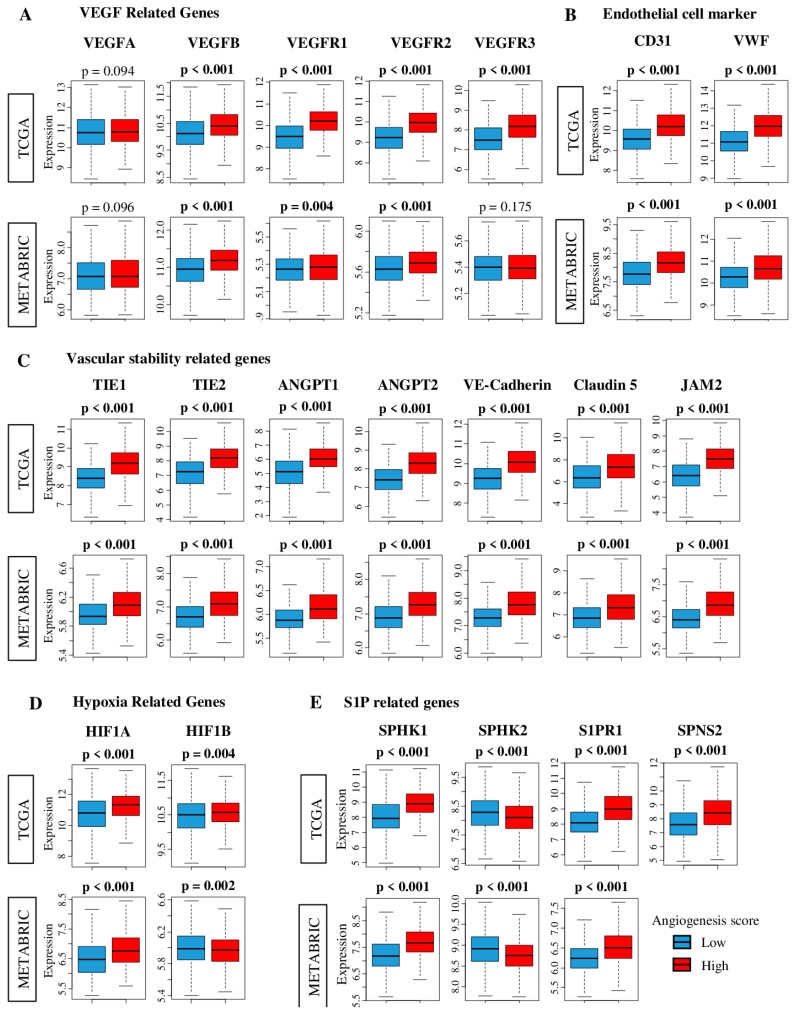
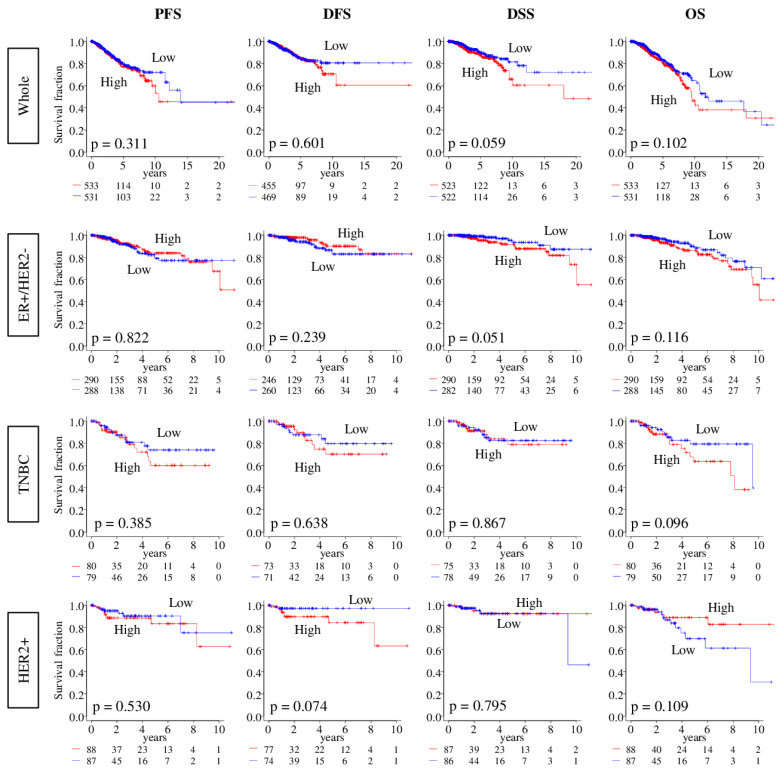
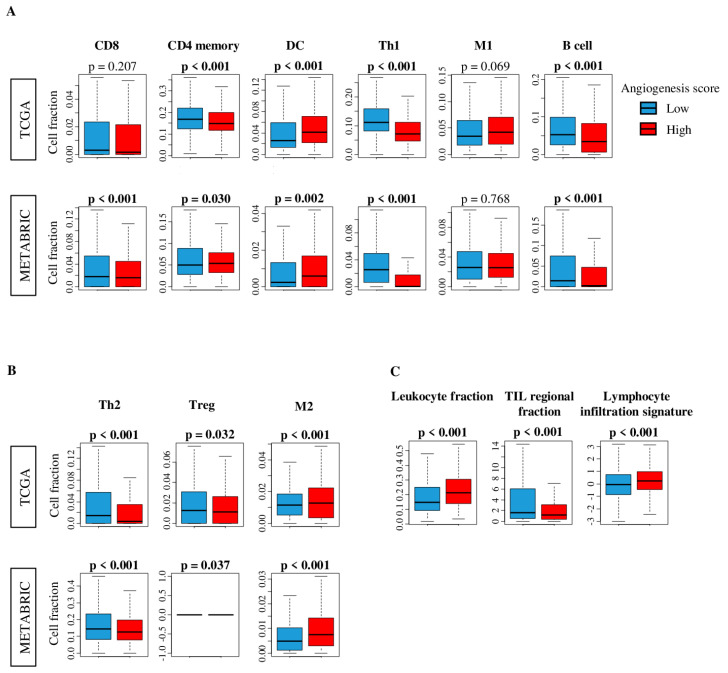
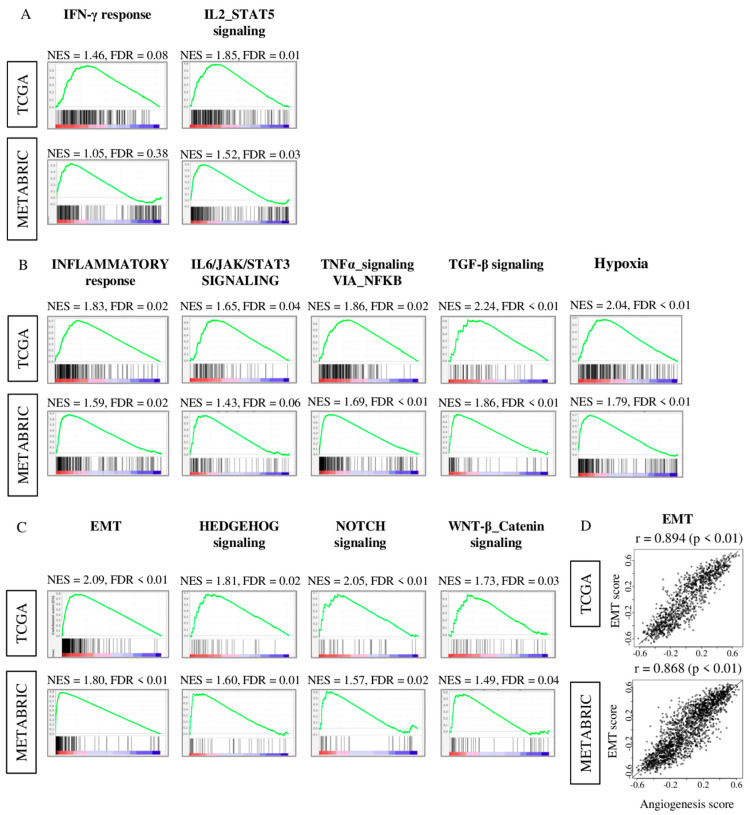
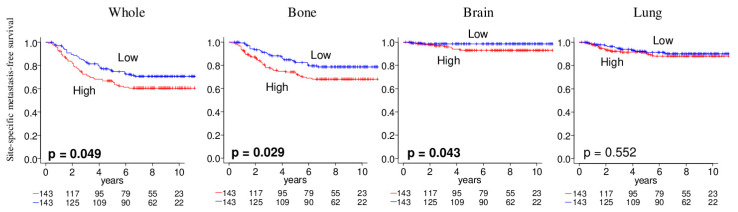
Angiogenesis is one of the hallmarks of cancer. We hypothesized that intra-tumoral angiogenesis correlates with inflammation and metastasis in breast cancer patients. To test this hypothesis, we generated an angiogenesis pathway score using gene set variation analysis and analyzed the tumor transcriptome of 3999 breast cancer patients from The Cancer Genome Atlas Breast Cancer (TCGA-BRCA), Molecular Taxonomy of Breast Cancer International Consortium (METABRIC), GSE20194, GSE25066, GSE32646, and GSE2034 cohorts. We found that the score correlated with expression of various angiogenesis-, vascular stability-, and sphingosine-1-phosphate (S1P)-related genes. Surprisingly, the angiogenesis score was not associated with breast cancer subtype, Nottingham pathological grade, clinical stage, response to neoadjuvant chemotherapy, or patient survival. However, a high score was associated with a low fraction of both favorable and unfavorable immune cell infiltrations except for dendritic cell and M2 macrophage, and with Leukocyte Fraction, Tumor Infiltrating Lymphocyte Regional Fraction and Lymphocyte Infiltration Signature scores. High-score tumors had significant enrichment for unfavorable inflammation-related gene sets (interleukin (IL)6, and tumor necrosis factor (TNF)α- and TGFβ-signaling), as well as metastasis-related gene sets (epithelial mesenchymal transition, and Hedgehog-, Notch-, and WNT-signaling). High score was significantly associated with metastatic recurrence particularly to brain and bone. In conclusion, using the angiogenesis pathway score, we found that intra-tumoral angiogenesis is associated with immune reaction, inflammation and metastasis-related pathways, and metastatic recurrence in breast cancer.
Keywords: angiogenesis; breast cancer; epithelial-mesenchymal transition; gene set; metastatic recurrence; sphingosine-1-phosphate.
Conflict of interest statement
The authors declare no conflict of interest.
Figures

Similar articles
-
Inflammation Is Associated with Worse Outcome in the Whole Cohort but with Better Outcome in Triple-Negative Subtype of Breast Cancer Patients.J Immunol Res. 2020 Dec 8;2020:5618786. doi: 10.1155/2020/5618786. eCollection 2020. J Immunol Res. 2020. PMID: 33457427 Free PMC article.
-
Targeting the SphK1/S1P/S1PR1 Axis That Links Obesity, Chronic Inflammation, and Breast Cancer Metastasis.Cancer Res. 2018 Apr 1;78(7):1713-1725. doi: 10.1158/0008-5472.CAN-17-1423. Epub 2018 Jan 19. Cancer Res. 2018. PMID: 29351902 Free PMC article.
-
Interleukin-22 Mediates the Chemotactic Migration of Breast Cancer Cells and Macrophage Infiltration of the Bone Microenvironment by Potentiating S1P/SIPR Signaling.Cells. 2020 Jan 6;9(1):131. doi: 10.3390/cells9010131. Cells. 2020. PMID: 31935914 Free PMC article.
-
S1P Signaling in the Tumor Microenvironment.Adv Exp Med Biol. 2020;1223:129-153. doi: 10.1007/978-3-030-35582-1_7. Adv Exp Med Biol. 2020. PMID: 32030688 Review.
-
Autocrine and paracrine roles of sphingosine-1-phosphate.Trends Endocrinol Metab. 2007 Oct;18(8):300-7. doi: 10.1016/j.tem.2007.07.005. Epub 2007 Sep 29. Trends Endocrinol Metab. 2007. PMID: 17904858 Review.
Cited by
-
A Bloody Conspiracy- Blood Vessels and Immune Cells in the Tumor Microenvironment.Cancers (Basel). 2022 Sep 21;14(19):4581. doi: 10.3390/cancers14194581. Cancers (Basel). 2022. PMID: 36230504 Free PMC article. Review.
-
The clinical relevance of unfolded protein response signaling in breast cancer.Am J Cancer Res. 2022 Jun 15;12(6):2627-2640. eCollection 2022. Am J Cancer Res. 2022. PMID: 35812054 Free PMC article.
-
Clinical relevance of stem cell surface markers CD133, CD24, and CD44 in colorectal cancer.Am J Cancer Res. 2021 Oct 15;11(10):5141-5154. eCollection 2021. Am J Cancer Res. 2021. PMID: 34765317 Free PMC article.
-
Enhanced DNA Repair Pathway is Associated with Cell Proliferation and Worse Survival in Hepatocellular Carcinoma (HCC).Cancers (Basel). 2021 Jan 17;13(2):323. doi: 10.3390/cancers13020323. Cancers (Basel). 2021. PMID: 33477315 Free PMC article.
-
A Novel Four-Gene Score to Predict Pathologically Complete (R0) Resection and Survival in Pancreatic Cancer.Cancers (Basel). 2020 Dec 4;12(12):3635. doi: 10.3390/cancers12123635. Cancers (Basel). 2020. PMID: 33291601 Free PMC article.
References
-
- Kottke T., Hall G., Pulido J., Diaz R.M., Thompson J., Chong H., Selby P., Coffey M., Pandha H., Chester J., et al. Antiangiogenic cancer therapy combined with oncolytic virotherapy leads to regression of established tumors in mice. J. Clin. Investig. 2010;120:1551–1560. doi: 10.1172/JCI41431. - DOI - PMC - PubMed
MeSH terms
Substances
Grants and funding
LinkOut - more resources
Full Text Sources
Medical
