. 2021 Jun;41(6):1277-1290.
doi: 10.1177/0271678X20952264. Epub 2020 Sep 15.

Remote ischemic conditioning enhances oxygen supply to ischemic brain tissue in a mouse model of stroke: Role of elevated 2,3-biphosphoglycerate in erythrocytes

Affiliations

Remote ischemic conditioning enhances oxygen supply to ischemic brain tissue in a mouse model of stroke: Role of elevated 2,3-biphosphoglycerate in erythrocytes

Lin Wang et al. J Cereb Blood Flow Metab. 2021 Jun.

Abstract

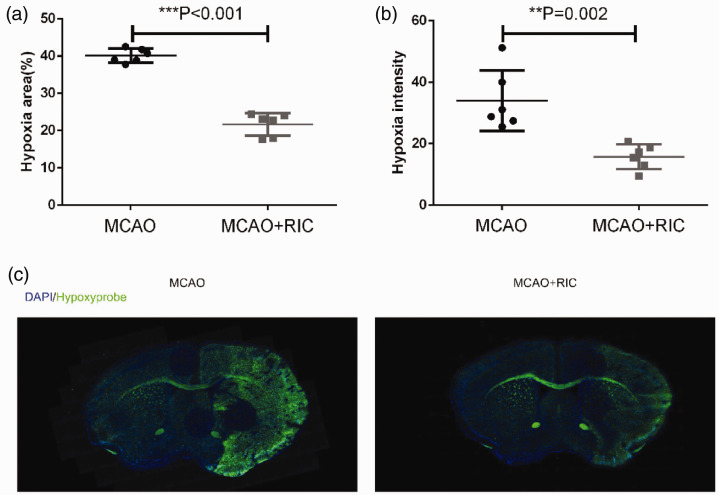
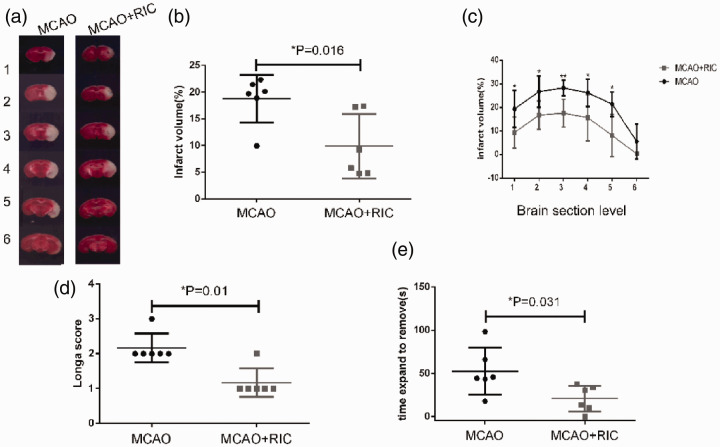
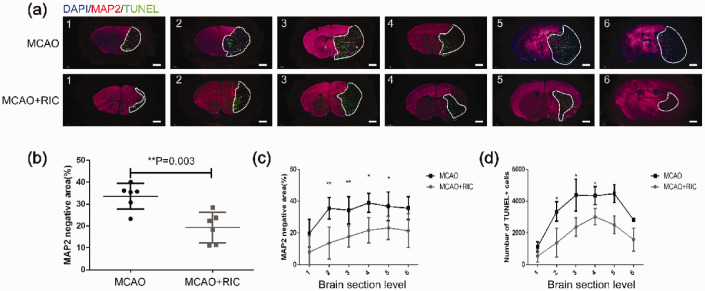
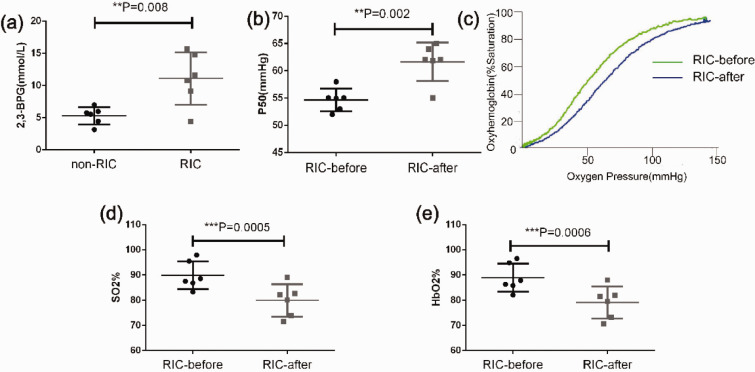
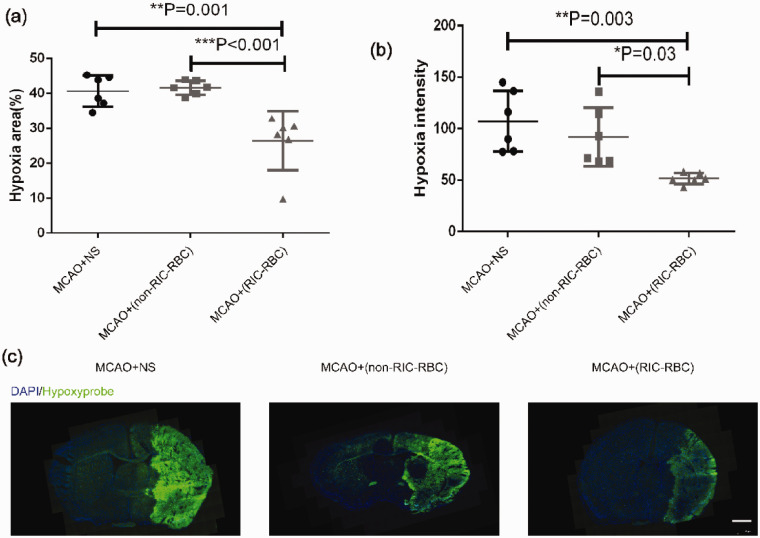
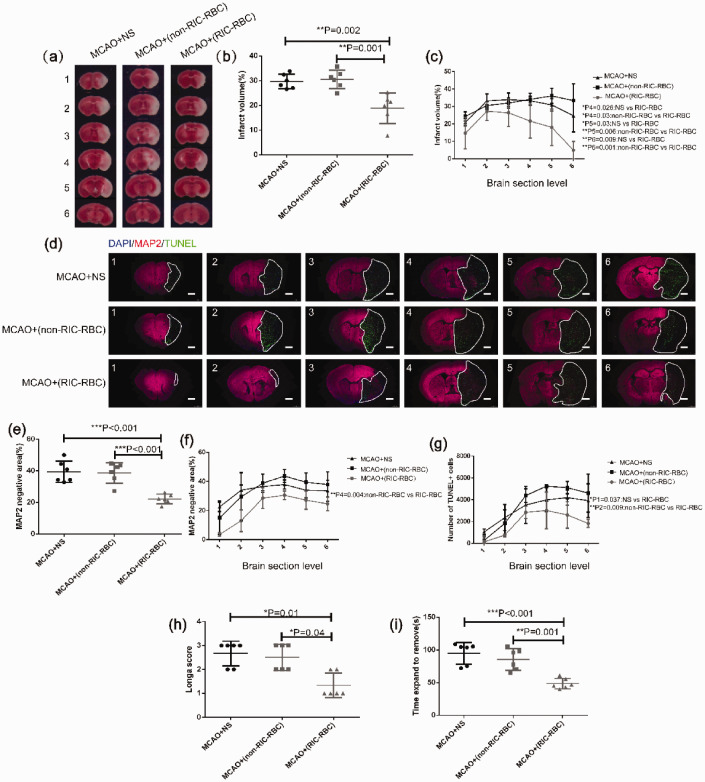
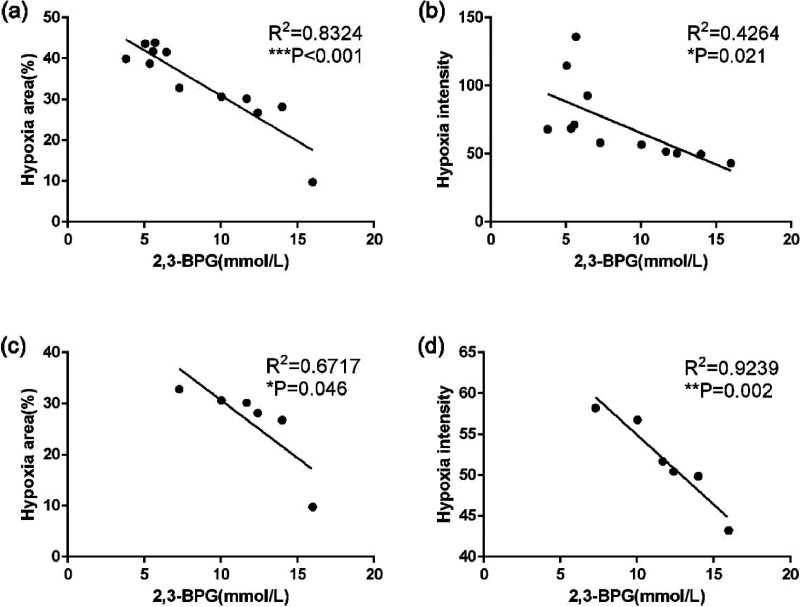
Oxygen supply for ischemic brain tissue during stroke is critical to neuroprotection. Remote ischemic conditioning (RIC) treatment is effective for stroke. However, it is not known whether RIC can improve brain tissue oxygen supply. In current study, we employed a mouse model of stroke created by middle cerebral artery occlusion (MCAO) to investigate the effect of RIC on oxygen supply to the ischemic brain tissue using a hypoxyprobe system. Erythrocyte oxygen-carrying capacity and tissue oxygen exchange were assessed by measuring oxygenated hemoglobin and oxygen dissociation curve. We found that RIC significantly mitigated hypoxic signals and decreased neural cell death, thereby preserving neurological functions. The tissue oxygen exchange was markedly enhanced, along with the elevated hemoglobin P50 and right-shifted oxygen dissociation curve. Intriguingly, RIC markedly elevated 2,3-biphosphoglycerate (2,3-BPG) levels in erythrocyte, and the erythrocyte 2,3-BPG levels were highly negatively correlated with the hypoxia in the ischemic brain tissue. Further, adoptive transfusion of 2,3-BPG-rich erythrocytes prepared from RIC-treated mice significantly enhanced the oxygen supply to the ischemic tissue in MCAO mouse model. Collectively, RIC protects against ischemic stroke through improving oxygen supply to the ischemic brain tissue where the enhanced tissue oxygen delivery and exchange by RIC-induced 2,3-BPG-rich erythrocytes may play a role.

Keywords: 2,3-biphosphoglycerate/2,3-diphosphoglycerate; Remote ischemic conditioning; hypoxia; oxygen dissociation curve; stroke.


Conflict of interest statement

Declaration of conflicting interests: The author(s) declared no potential conflicts of interest with respect to the research, authorship, and/or publication of this article.

Figures

Figure 1.
Figure 1.
Remote ischemic conditioning increases the oxygen supply to ischemic brain tissue. (a) The average hypoxic areas (%) of all mice between the two groups (6 mice per group) were compared by the Student’s t-test. The hypoxic area was calculated using the following formula: [area of nonischemic hemisphere (hypoxyprobe negative) − area of the hypoxyprobe negative region in the ischemic hemisphere]/2 × area of nonischemic hemisphere × 100%. (b) The average hypoxic intensities of all mice between the two groups were compared by the Student’s t-test. (c) Representative images at the same level (brain optic chiasm level) of brain from each group were depicted. **p < 0.01, ***p < 0.001. The findings were similar when the same experiment was repeated twice independently.
Figure 2.
Figure 2.
Remote ischemic conditioning decreases the infarct volume and improves behavioral function. (a) Representative TTC staining images of different sections of brain tissues from two groups (6 mice per group) were shown. The numbers 1 to 6 represented coronal sections at different planes of each mouse brain. The brain tissue with pale TTC staining was the infarct region. (b) Total infarct volume (%) for six sections of each brain was evaluated by TTC staining in the different groups, and compared between the two groups by the Student’s t-test. (c) Infarct volume (%) by TTC staining in each of the six sections was compared by the Student’s t-test. Infarct volume was calculated using the following formula: [(volume of nonischemic hemisphere) − (volume of nonischemic region of ischemic hemisphere)/2 × volume of nonischemic hemisphere × 100%]. (d) Neurological function was assessed by the Longa scoring system in the different groups, and compared by the non-parametric test (Mann–Whitney test). (e) Delay time in stick strip removal during the adhesive removal test was compared between the groups by the Student’s t-test. *p < 0.05.**p < 0.01. The findings were similar when the same experiment was repeated independently.
Figure 3.
Figure 3.
Remote ischemic conditioning decreases infarction verified by MAP2 staining for live cells and neural cell apoptosis by TUNEL staining. (a) Representative images of brain tissue in the two groups as indicated (6 mice per group) with MAP2 and TUNEL immunofluorescence staining (scale bar, 1 mm) were depicted. The numbers of 1 to 6 represented coronal sections at different planes of each mouse brain. The brain tissue negative for MAP2 staining and positive for TUNEL (dead tissue) as marked by the white line was shown. (b) Average total infarct area (%) of six sections from each brain evaluated by MAP2 staining in the different groups was compared by the Student’s t-test. The infarct areas were calculated using the following formula: [(MAP2 positive area (live cells) of the nonischemic hemisphere) − (area of the MAP2 positive region in the ischemic hemisphere)/2 × area of the nonischemic hemisphere ×100%]. (c) Infarct area (%) evaluated by MAP2 staining in each of six sections was compared between the two groups by the Student’s t-test. (d) Apoptotic cells were evaluated by TUNEL immunofluorescent staining of different sections and counted for positive cells. The data were processed as described in the Materials and methods section and compared by the Student’s t-test. *p < 0.05, **p < 0.01. The similar findings were obtained when the same experiment was repeated independently.
Figure 4.
Figure 4.
Remote ischemic conditioning increases the 2,3-BPG level in red blood cells, leading to an increased P50 value, a shift of the oxygen dissociation curve (ODC) to the right, and more oxygen exchange in tissues. (a) The 2,3-BPG levels in red blood cells of RIC-treated group and non-RIC-treated control group mice were measured using the procedure described in the Materials and methods section and compared by the Student’s t-test (6 mice per group). (b) P50 was measured before and after RIC and compared by the paired t-test (n = 6). (c) A representative ODC before and after RIC showed that RIC led to a shift in the ODC to the right (blue line). (d) Venous blood SO2 levels before and after RIC. The data were compared using the paired t-test (n = 6). (e) Venous blood HbO2 levels before and after RIC. The data were compared using the paired t-test (n = 6). **p < 0.01, ***p < 0.001. The findings were similar when the same experiment was repeated on two occasions independently. 2,3-BPG: 2,3-biphosphoglycerate. HbO2: blood oxyhemoglobin; ODC: oxygen dissociation curve; P50: partial pressure of oxygen at 50% oxyhemoglobin saturation; SO2: oxygen saturation.
Figure 5.
Figure 5.
Transfusion of 2,3-BPG-rich red blood cells prepared from RIC-treated mice increases the oxygen supply to ischemic brain tissue. (a) The average hypoxic areas (%) of all mice between the groups (6 mice per group) were compared by the one-way ANOVA followed by the post hoc test. The hypoxic area was calculated using the following formula: [area of nonischemic hemisphere (hypoxyprobe negative) − area of the hypoxyprobe negative region in the ischemic hemisphere]/2 × area of nonischemic hemisphere × 100%. (b) The average hypoxic intensities of all mice between the groups were compared by one-way ANOVA followed by the post hoc test. (c) Representative images of brain section at the same level (brain optic chiasm level) from each group were depicted (scale bar 1 mm). *p < 0.05, **p < 0.01, ***p < 0.001. The findings were similar when the same experiment was repeated independently. Twelve C57BL/6 mice were used as RBC donors for each experiment.
Figure 6.
Figure 6.
Transfusion of 2,3-BPG-rich RBCs prepared from RIC-treated donor mice alleviates infarct size and apoptosis of brain cells, and improves behavioral function in MCAO mice. (a) Representative TTC staining images of different sections of brain tissue from one mouse in each group as indicated (6 mice per group). The numbers 1 to 6 represented coronal sections at different planes of mouse brain. The brain tissue with pale TTC staining was the infarct region. (b) The average total infarct volume (%) evaluated by TTC staining of six sections in the different groups was compared by one-way ANOVA followed by the post hoc test. (c) Infarct volume (%) by TTC staining of individual sections compared by one-way ANOVA followed by the post hoc test. P1–P6 represent the p values when the six individual sections were compared as indicated in the figure (only showing the sections with a significant difference). (d) Representative images of different sections of brain tissue MAP2 and TUNEL immunofluorescent staining were shown (scale bar 1 mm) in each group as indicated (6 mice per group). The numbers of 1 to 6 represented six coronal sections at different planes of mouse brain with 1 mm apart between two adjacent sections. The white line marked area was infarct with MAP2 staining negative and TUNEL staining positive. (e) The average total infarct area (%) evaluated by MAP2 immunofluorescent staining of six sections of all mice in different groups was compared by one-way ANOVA followed by post hoc test. (f) Infarct area (%) by MAP2 immunofluorescent staining of different individual sections was compared by one-way ANOVA followed by post hoc test. P1–P6 represent the p values when the six individual sections were compared as indicated in the figure (only showing the sections with a significant difference). (g) Apoptotic cells examined by TUNEL immunofluorescent staining and analyzed as described in the Materials and methods. The total TUNEL+ cells at different sections were compared by one-way ANOVA followed by the post hoc test. P1–P6 represented the p values when the six individual sections were compared as indicated in the figure (only showing the sections with significant difference). (h) Neurological function assessed by the Longa scoring system compared between the different groups by non-parametric test (Kruskal–Wallis test). (i) Delay time in stick strip removal during the adhesive removal test compared between the different groups by one-way ANOVA followed by the post hoc test. *p < 0.05, **p < 0.01. The findings were similar when the same experiment was repeated independently.
Figure 7.
Figure 7.
Relationship between erythrocyte 2,3-BPG levels and ischemic brain tissue oxygen supply impacted by erythrocyte transfusion. Pearson correlation analysis was performed to analyze the relationship between erythrocyte 2,3-BPG levels and hypoxic signals for the data shown in Figure 5. (a) The correlation was shown between 2,3-BPG levels of transfused RBCs and hypoxic areas in the ischemic brain tissues, combining data from RIC-RBCs and non-RIC-RBCs groups. (b) The correlation was shown between 2,3-BPG levels of transfused RBCs and hypoxic signal intensities in the ischemic brain tissues, combining data from RIC-RBCs and non-RIC-RBCs groups. (c) The correlation was shown between 2,3-BPG levels of RIC-RBCs and hypoxic areas in the ischemic brain tissues from the data exclusively from RIC-RBCs group. (d) The correlation was shown between 2,3-BPG levels of RIC-RBCs and hypoxic intensities in the ischemic brain tissues from the data exclusively from RIC-RBCs group. *p < 0.05, **p < 0.01, ***p < 0.001.

Similar articles

Cited by

References

    1. Hess DC, Blauenfeldt RA, Andersen G, et al.. Remote ischaemic conditioning-a new paradigm of self-protection in the brain. Nat Rev Neurol 2015; 11: 698–710. - PubMed
    1. Landman TRJ, Schoon Y, Warle MC, et al.. Remote ischemic conditioning as an additional treatment for acute ischemic stroke. Stroke 2019; 50: 1934–1939. - PubMed
    1. Wang Y, Reis C, Applegate R, et al.. Ischemic conditioning-induced endogenous brain protection: applications pre-, per- or post-stroke. Exp Neurol 2015; 272: 26–40. - PMC - PubMed
    1. Hougaard KD, Hjort N, Zeidler D, et al.. Remote ischemic perconditioning as an adjunct therapy to thrombolysis in patients with acute ischemic stroke: a randomized trial. Stroke 2014; 45: 159–167. - PubMed
    1. Heusch G.Molecular basis of cardioprotection: signal transduction in ischemic pre-, post-, and remote conditioning. Circ Res 2015; 116: 674–699. - PubMed

Publication types

Substances