

Spatial access inequities and childhood immunisation uptake in Kenya
- PMID: 32933501
- PMCID: PMC7493983
- DOI: 10.1186/s12889-020-09486-8
Spatial access inequities and childhood immunisation uptake in Kenya
Abstract
Background: Poor access to immunisation services remains a major barrier to achieving equity and expanding vaccination coverage in many sub-Saharan African countries. In Kenya, the extent to which spatial access affects immunisation coverage is not well understood. The aim of this study was to quantify spatial accessibility to immunising health facilities and determine its influence on immunisation uptake in Kenya while controlling for potential confounders.
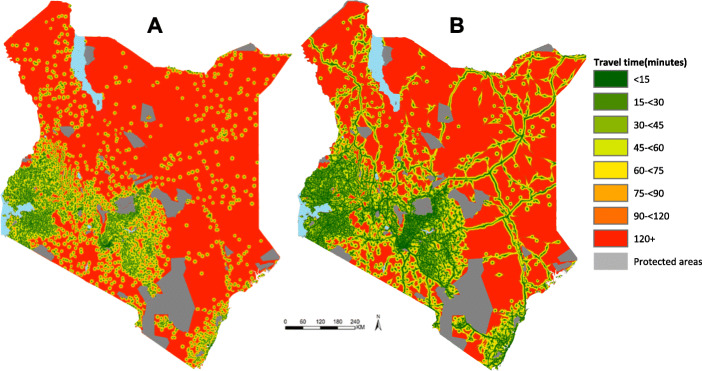
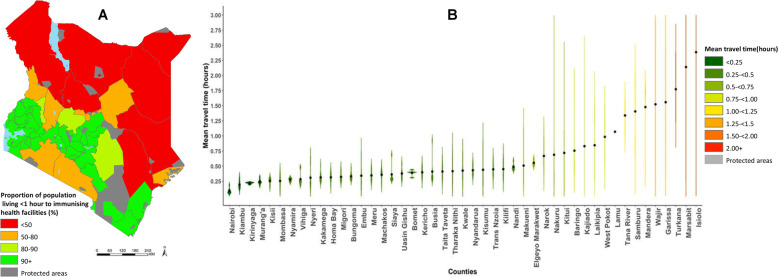
Methods: Spatial databases of immunising facilities, road network, land use and elevation were used within a cost friction algorithim to estimate the travel time to immunising health facilities. Two travel scenarios were evaluated; (1) Walking only and (2) Optimistic scenario combining walking and motorized transport. Mean travel time to health facilities and proportions of the total population living within 1-h to the nearest immunising health facility were computed. Data from a nationally representative cross-sectional survey (KDHS 2014), was used to estimate the effect of mean travel time at survey cluster units for both fully immunised status and third dose of diphtheria-tetanus-pertussis (DPT3) vaccine using multi-level logistic regression models.
Results: Nationally, the mean travel time to immunising health facilities was 63 and 40 min using the walking and the optimistic travel scenarios respectively. Seventy five percent of the total population were within one-hour of walking to an immunising health facility while 93% were within one-hour considering the optimistic scenario. There were substantial variations across the country with 62%(29/47) and 34%(16/47) of the counties with < 90% of the population within one-hour from an immunising health facility using scenarios 1 and 2 respectively. Travel times > 1-h were significantly associated with low immunisation coverage in the univariate analysis for both fully immunised status and DPT3 vaccine. Children living more than 2-h were significantly less likely to be fully immunised [AOR:0.56(0.33-0.94) and receive DPT3 [AOR:0.51(0.21-0.92) after controlling for household wealth, mother's highest education level, parity and urban/rural residence.
Conclusion: Travel time to immunising health facilities is a barrier to uptake of childhood vaccines in regions with suboptimal accessibility (> 2-h). Strategies that address access barriers in the hardest to reach communities are needed to enhance equitable access to immunisation services in Kenya.
Keywords: Equity; Health facilities; Immunisation; Kenya; Spatial accessibility.
Conflict of interest statement
The authors declare that they have no competing interests.
Figures
References
-
- IAEG-SDGs . Report of the Inter-Agency and Expert Group on Sustainable Development Goal Indicators (E/CN.3/2017/2), Annex III. IAEG-SDGs. New York: U. S United Nations Statistics Division Development Data and Outreach Branch; 2017.
-
- GAVI. Gavi Progress report. Geneva; 2017. https://www.gavi.org/programmes-impact/our-impact/progress-reports.
-
- WHO, UNICEF. Monitoring the situation of children and women. Geneva: immunization; 2018. https://data.unicef.org/.
-
- Global Immunization Data: Global Immunization Coverage [https://data.unicef.org/topic/child-health/immunization/].
MeSH terms
Grants and funding
LinkOut - more resources
Full Text Sources
Medical
