. 2020 Dec 1;26(23):6374-6386.
doi: 10.1158/1078-0432.CCR-20-1675. Epub 2020 Sep 15.

Chloroquine Sensitizes GNAQ/11-mutated Melanoma to MEK1/2 Inhibition

Affiliations

Chloroquine Sensitizes GNAQ/11-mutated Melanoma to MEK1/2 Inhibition

Amanda Truong et al. Clin Cancer Res. .

Abstract

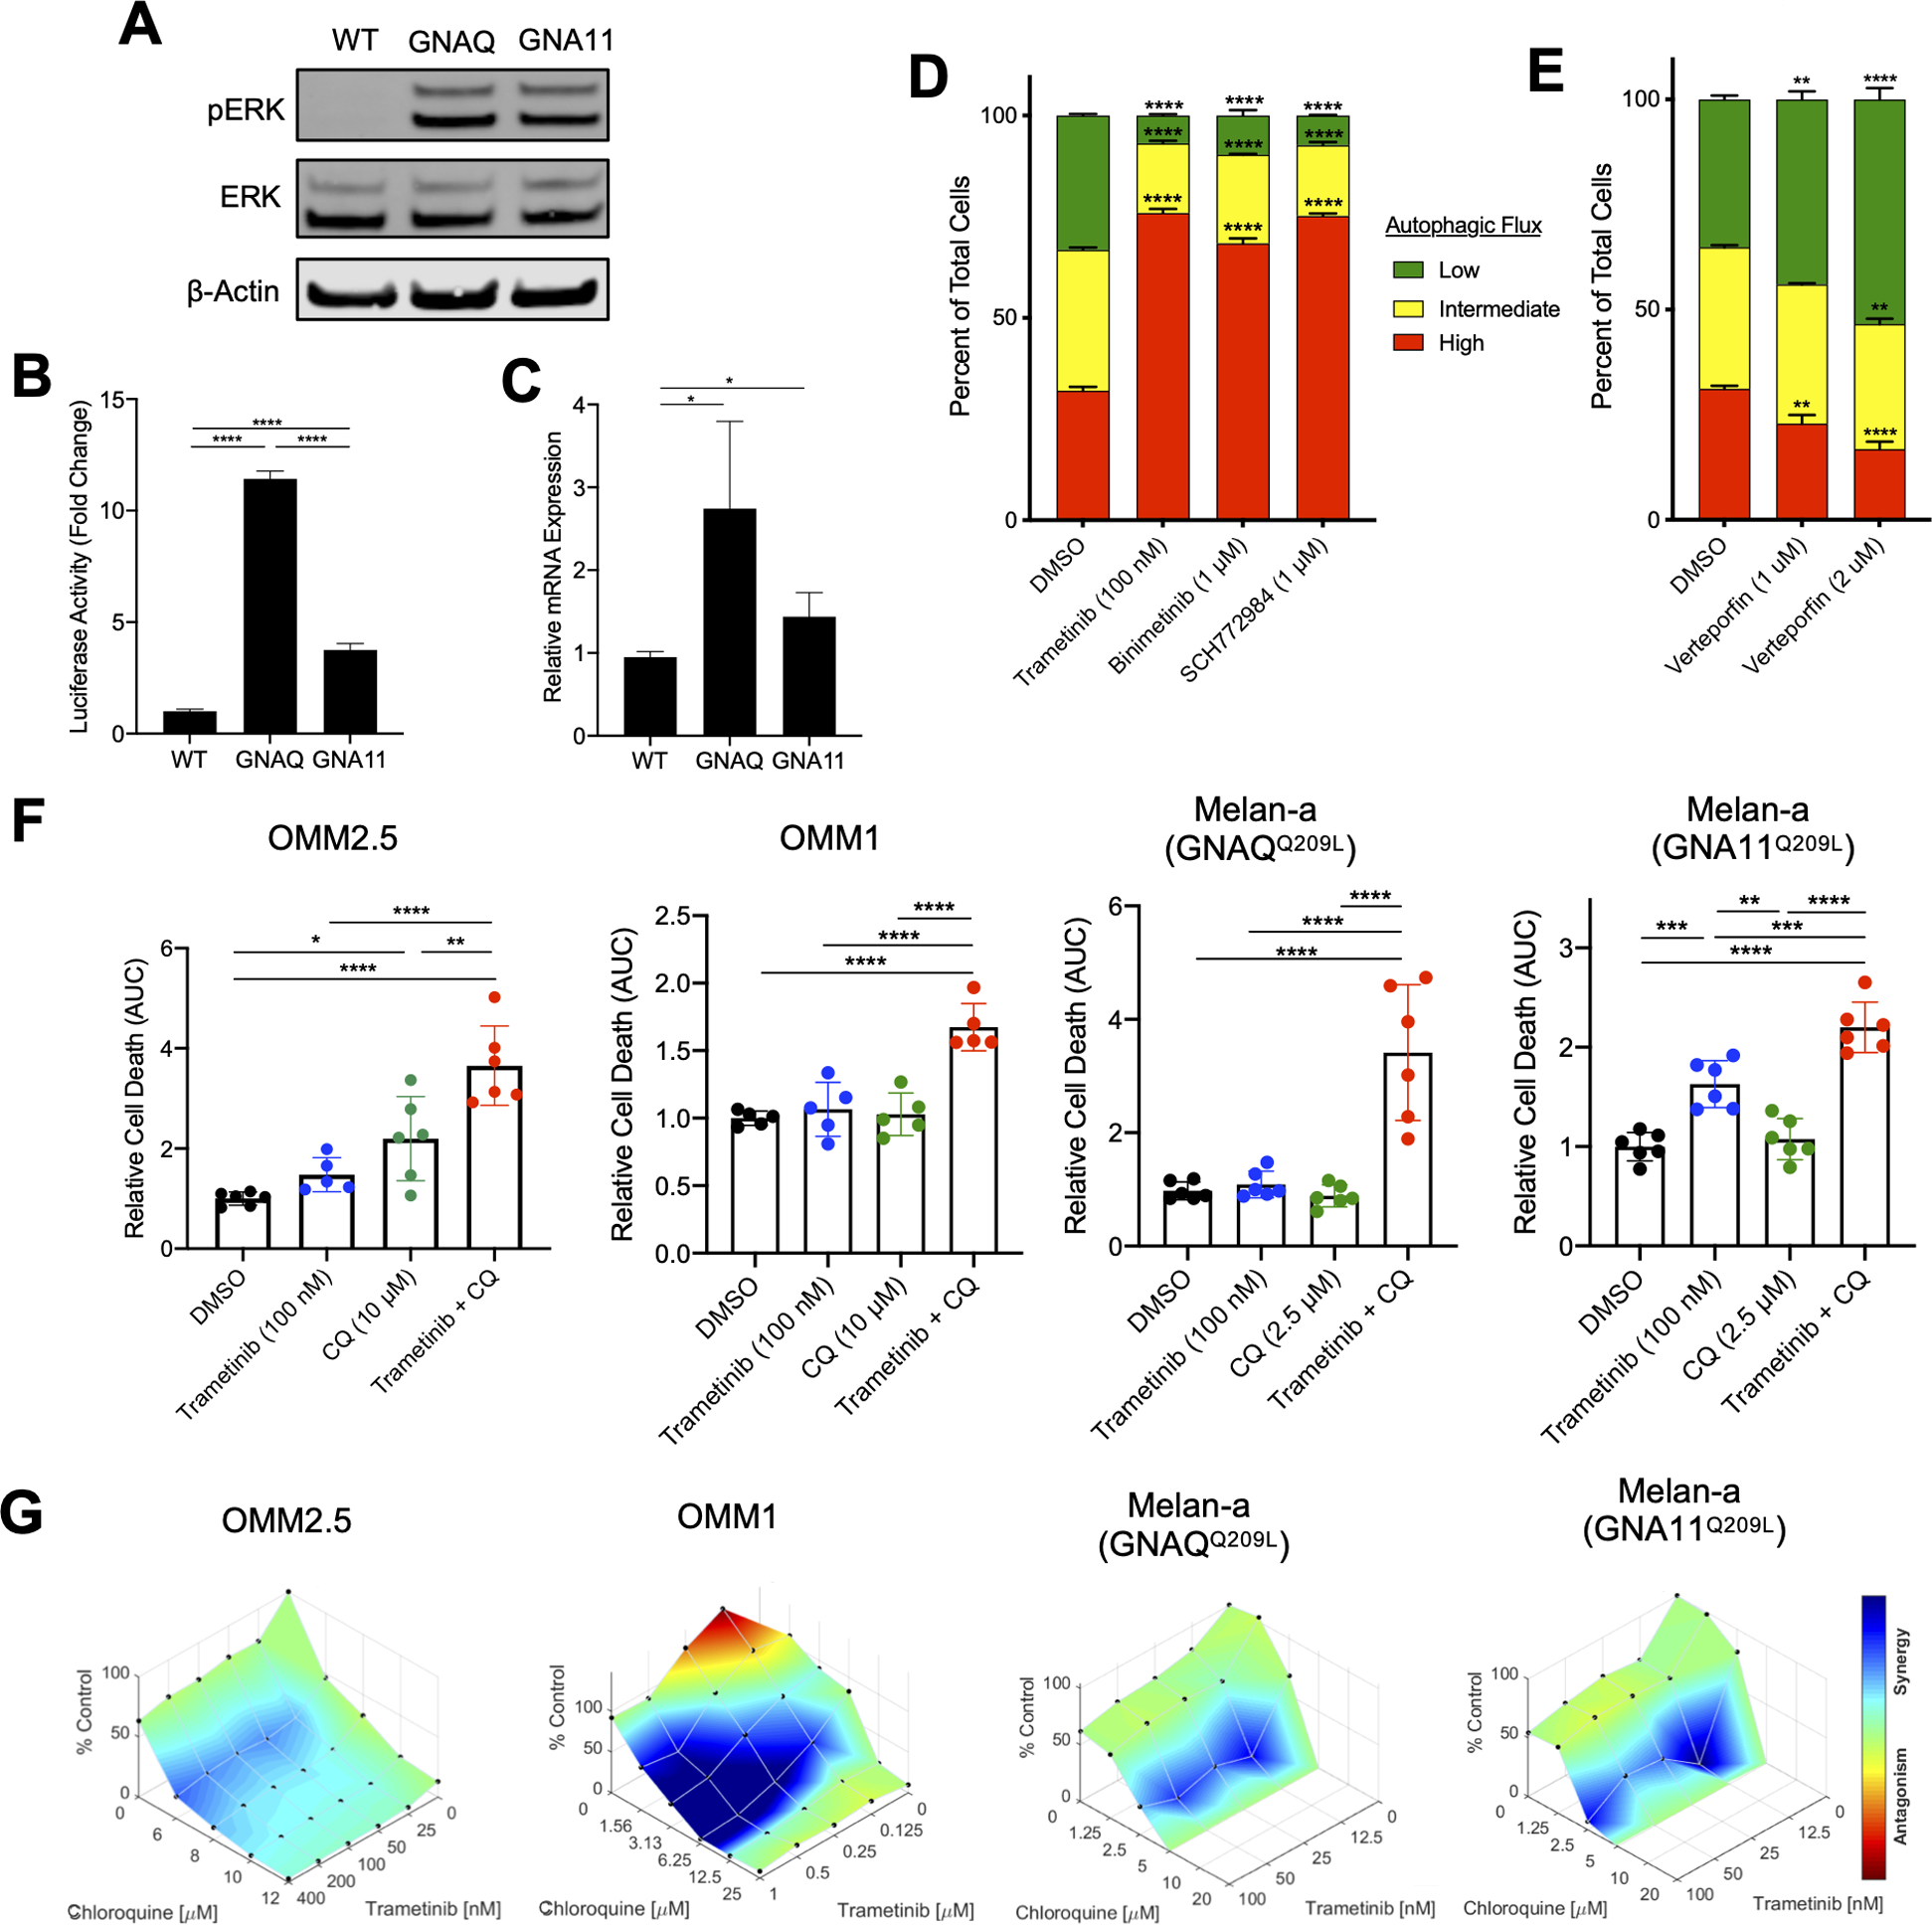
Purpose: Mutational activation of GNAQ or GNA11 (GNAQ/11), detected in >90% of uveal melanomas, leads to constitutive activation of oncogenic pathways, including MAPK and YAP. To date, chemo- or pathway-targeted therapies, either alone or in combination, have proven ineffective in the treatment of patients with metastatic uveal melanoma.

Experimental design: We tested the efficacy of chloroquine or hydroxychloroquine, in combination with MAPK pathway inhibition in GNAQ/11-mutated cells in vitro and in vivo and identified mechanisms of MEK1/2 inhibitor plus chloroquine-induced cytotoxicity.

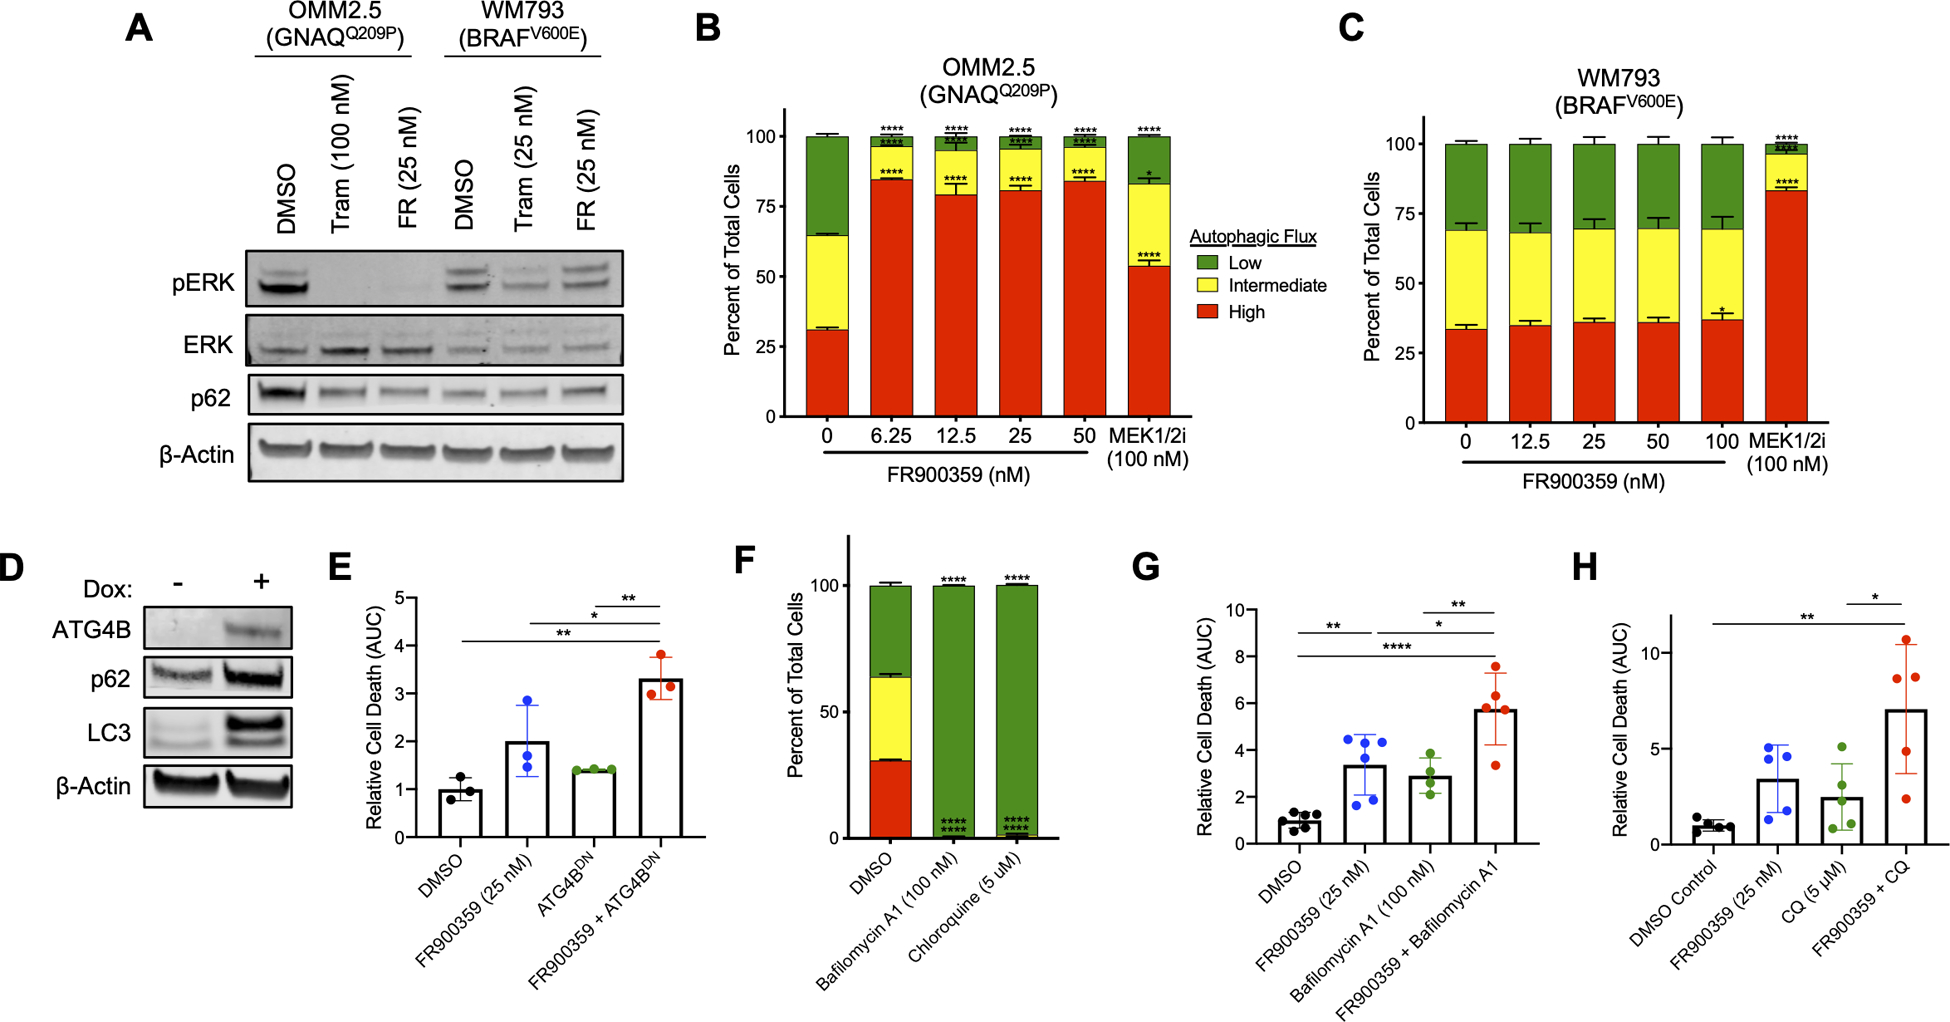
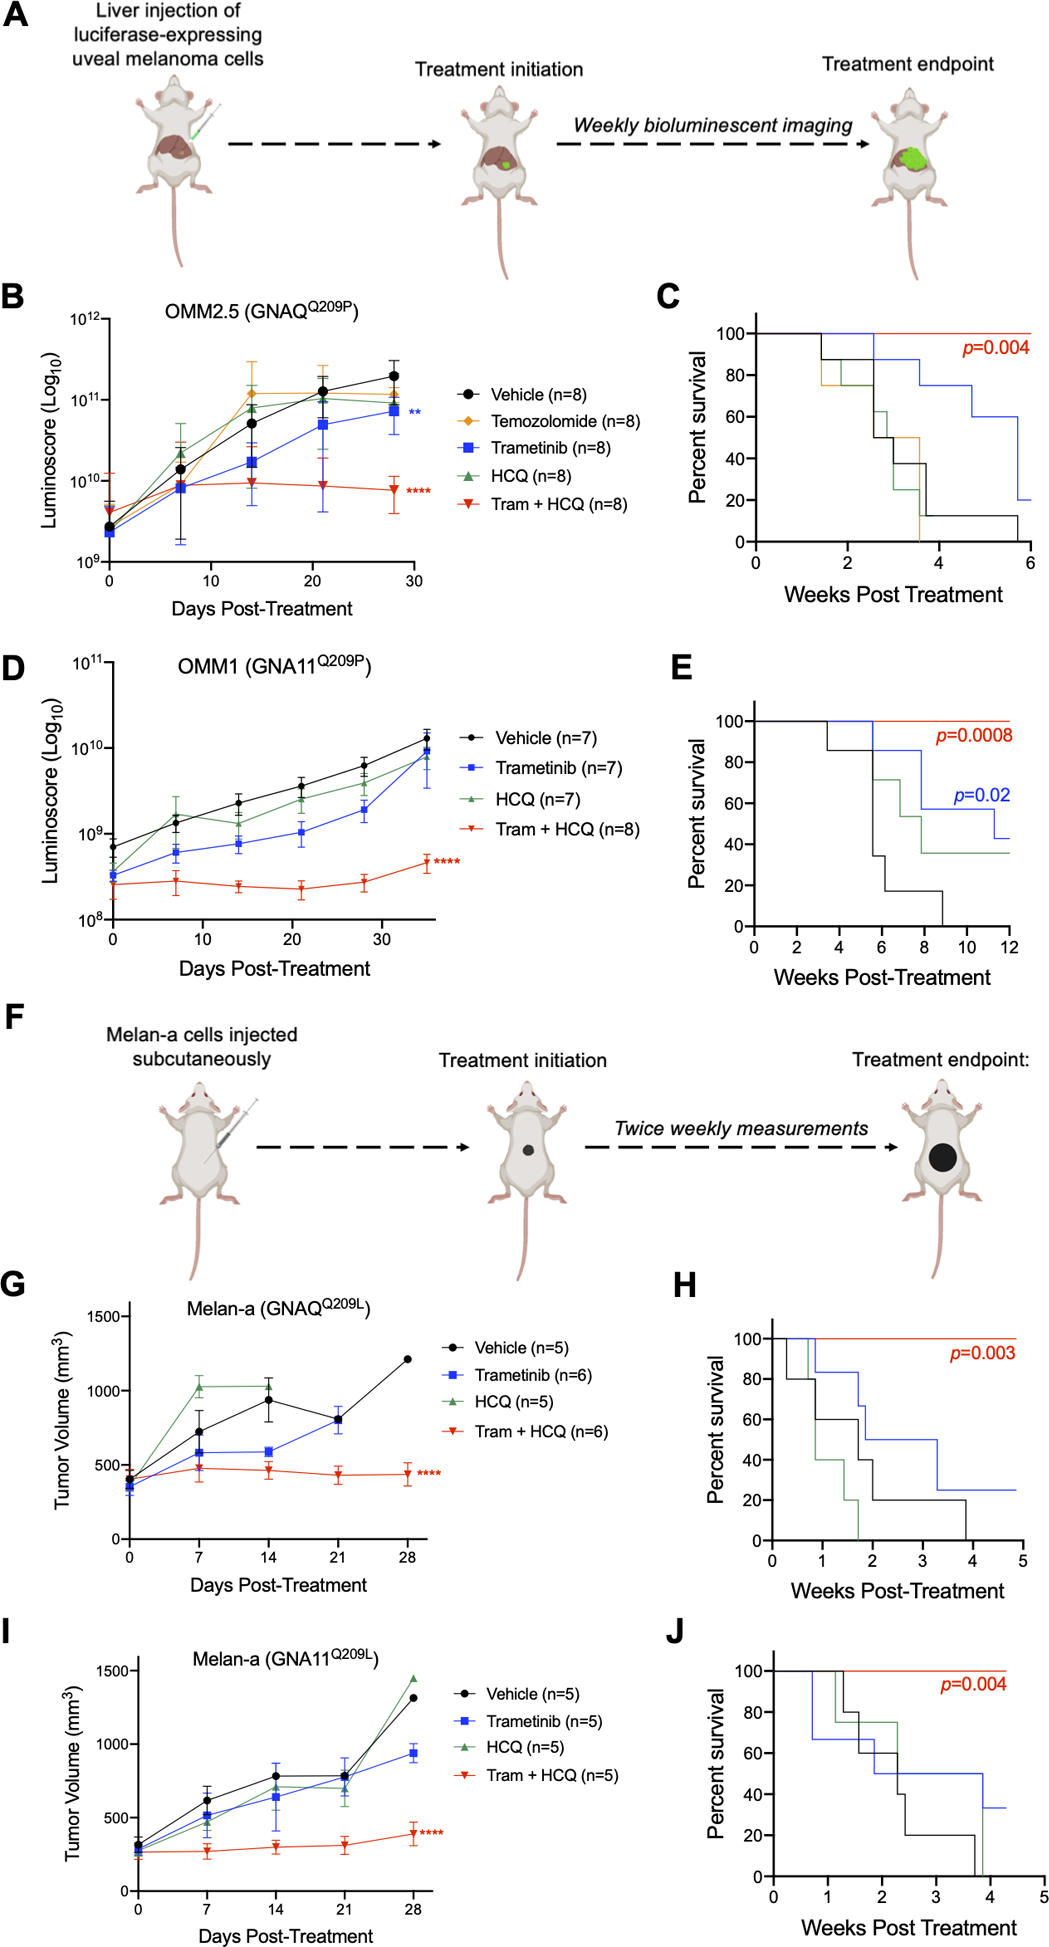
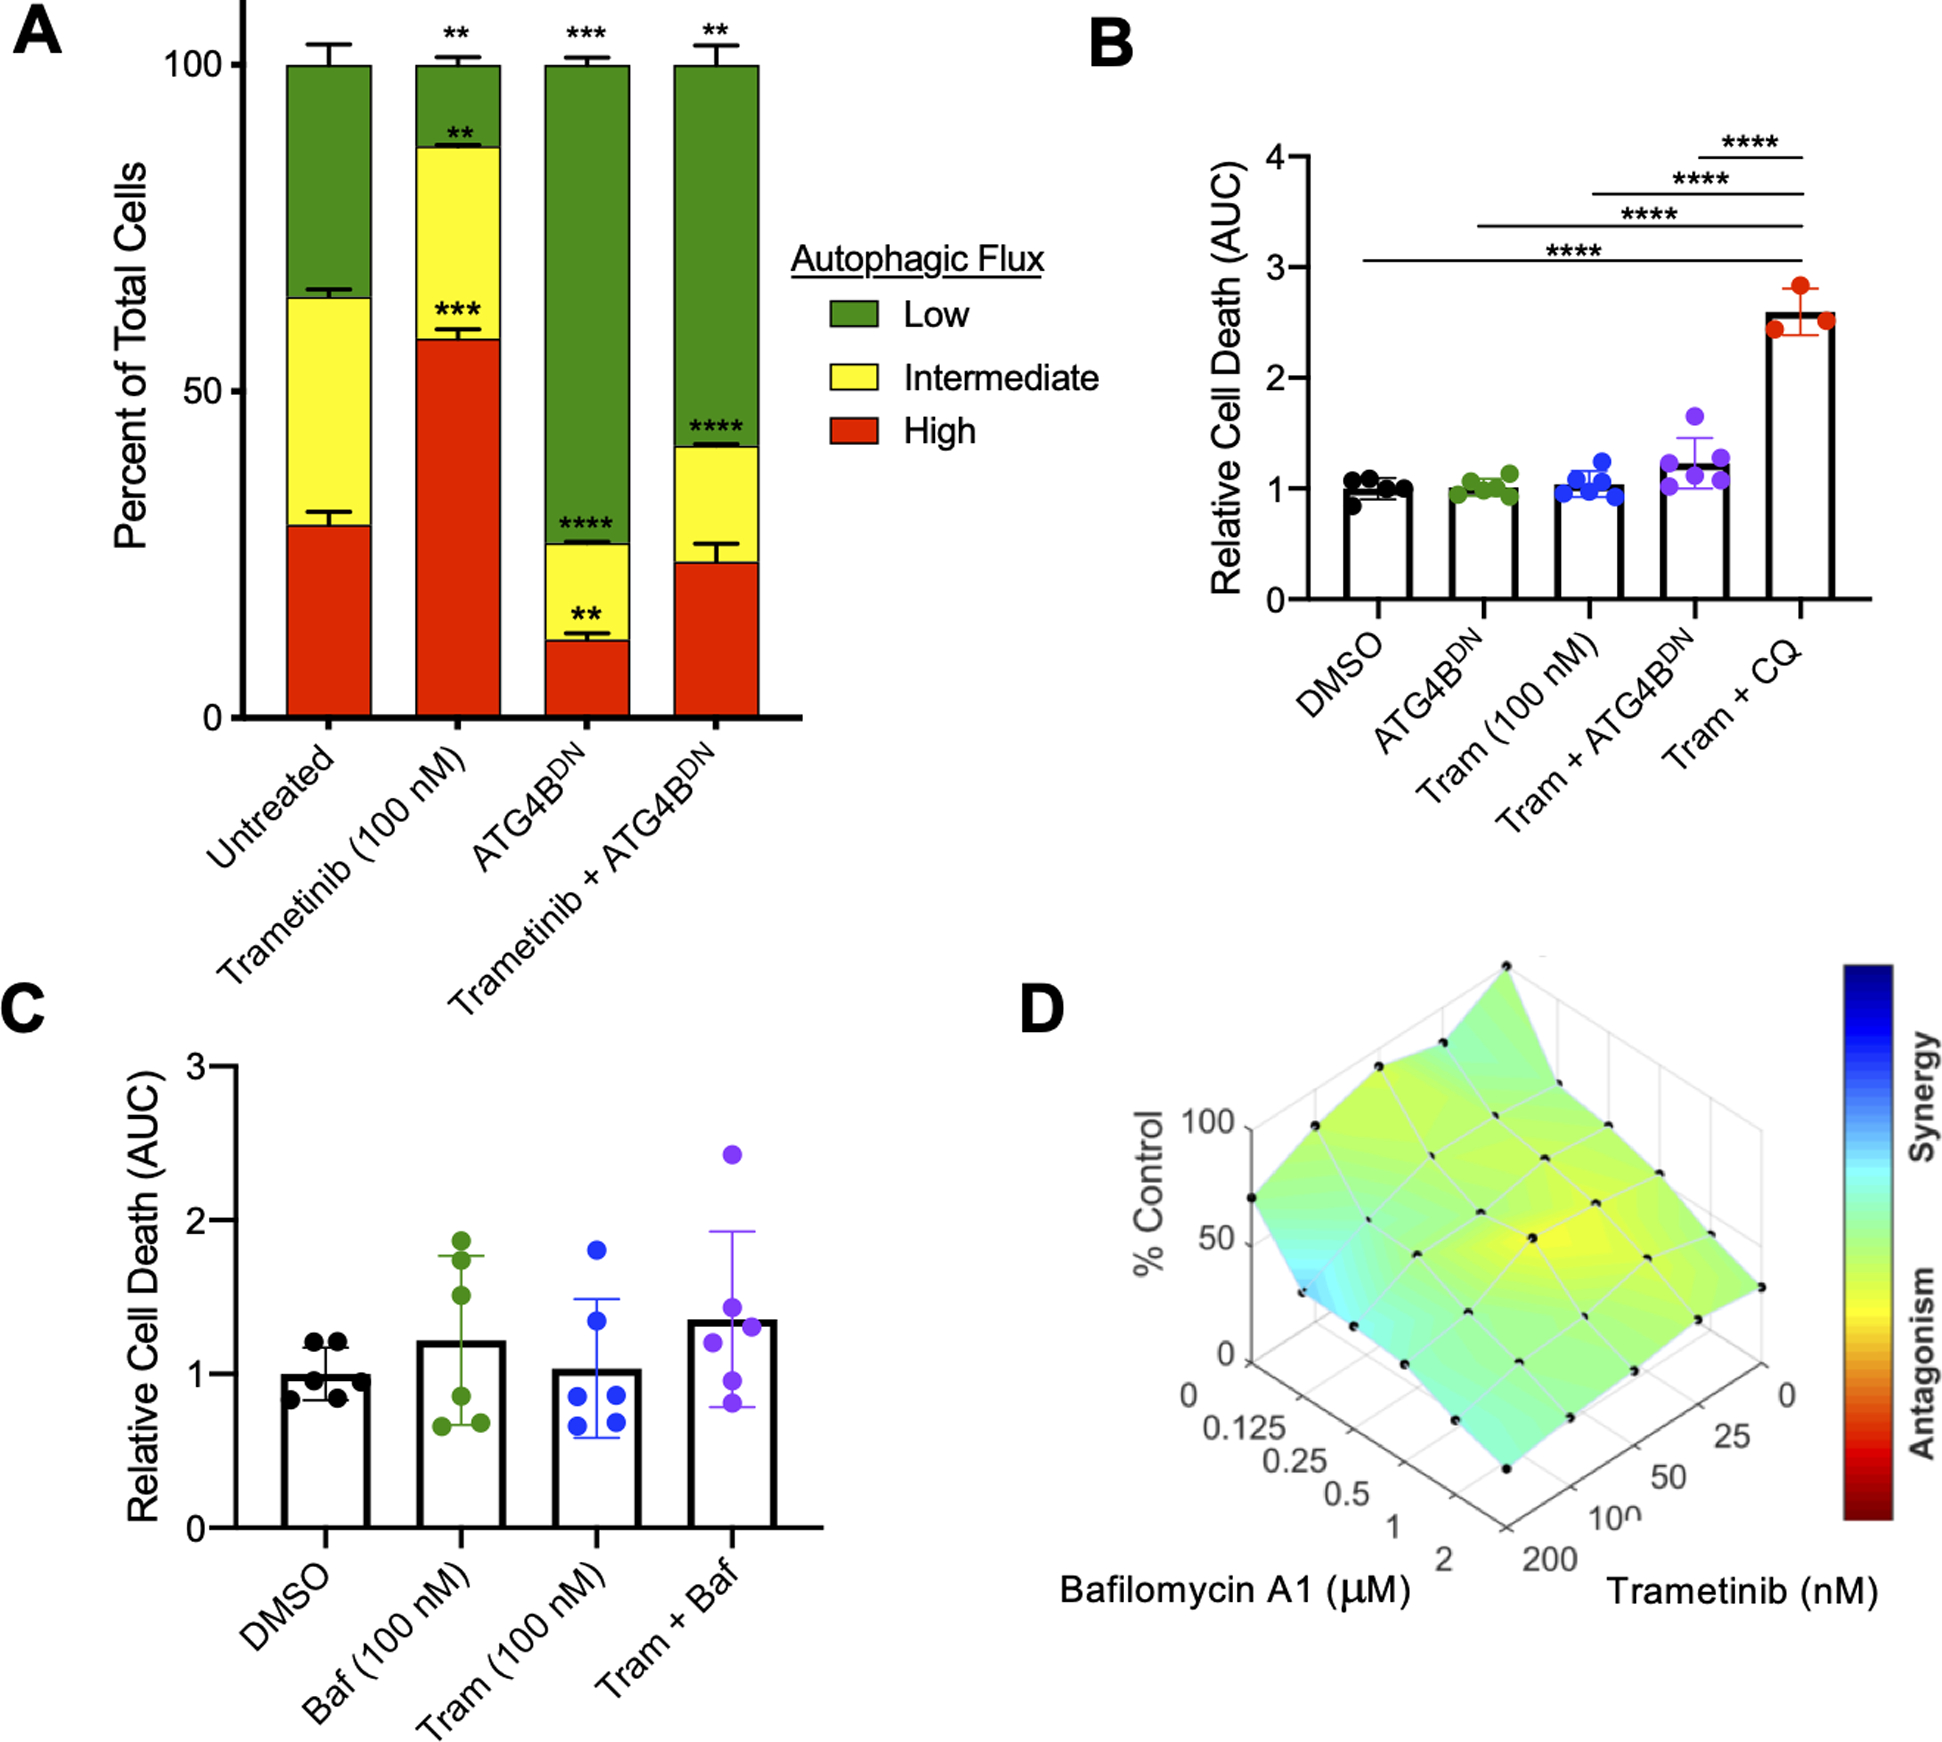
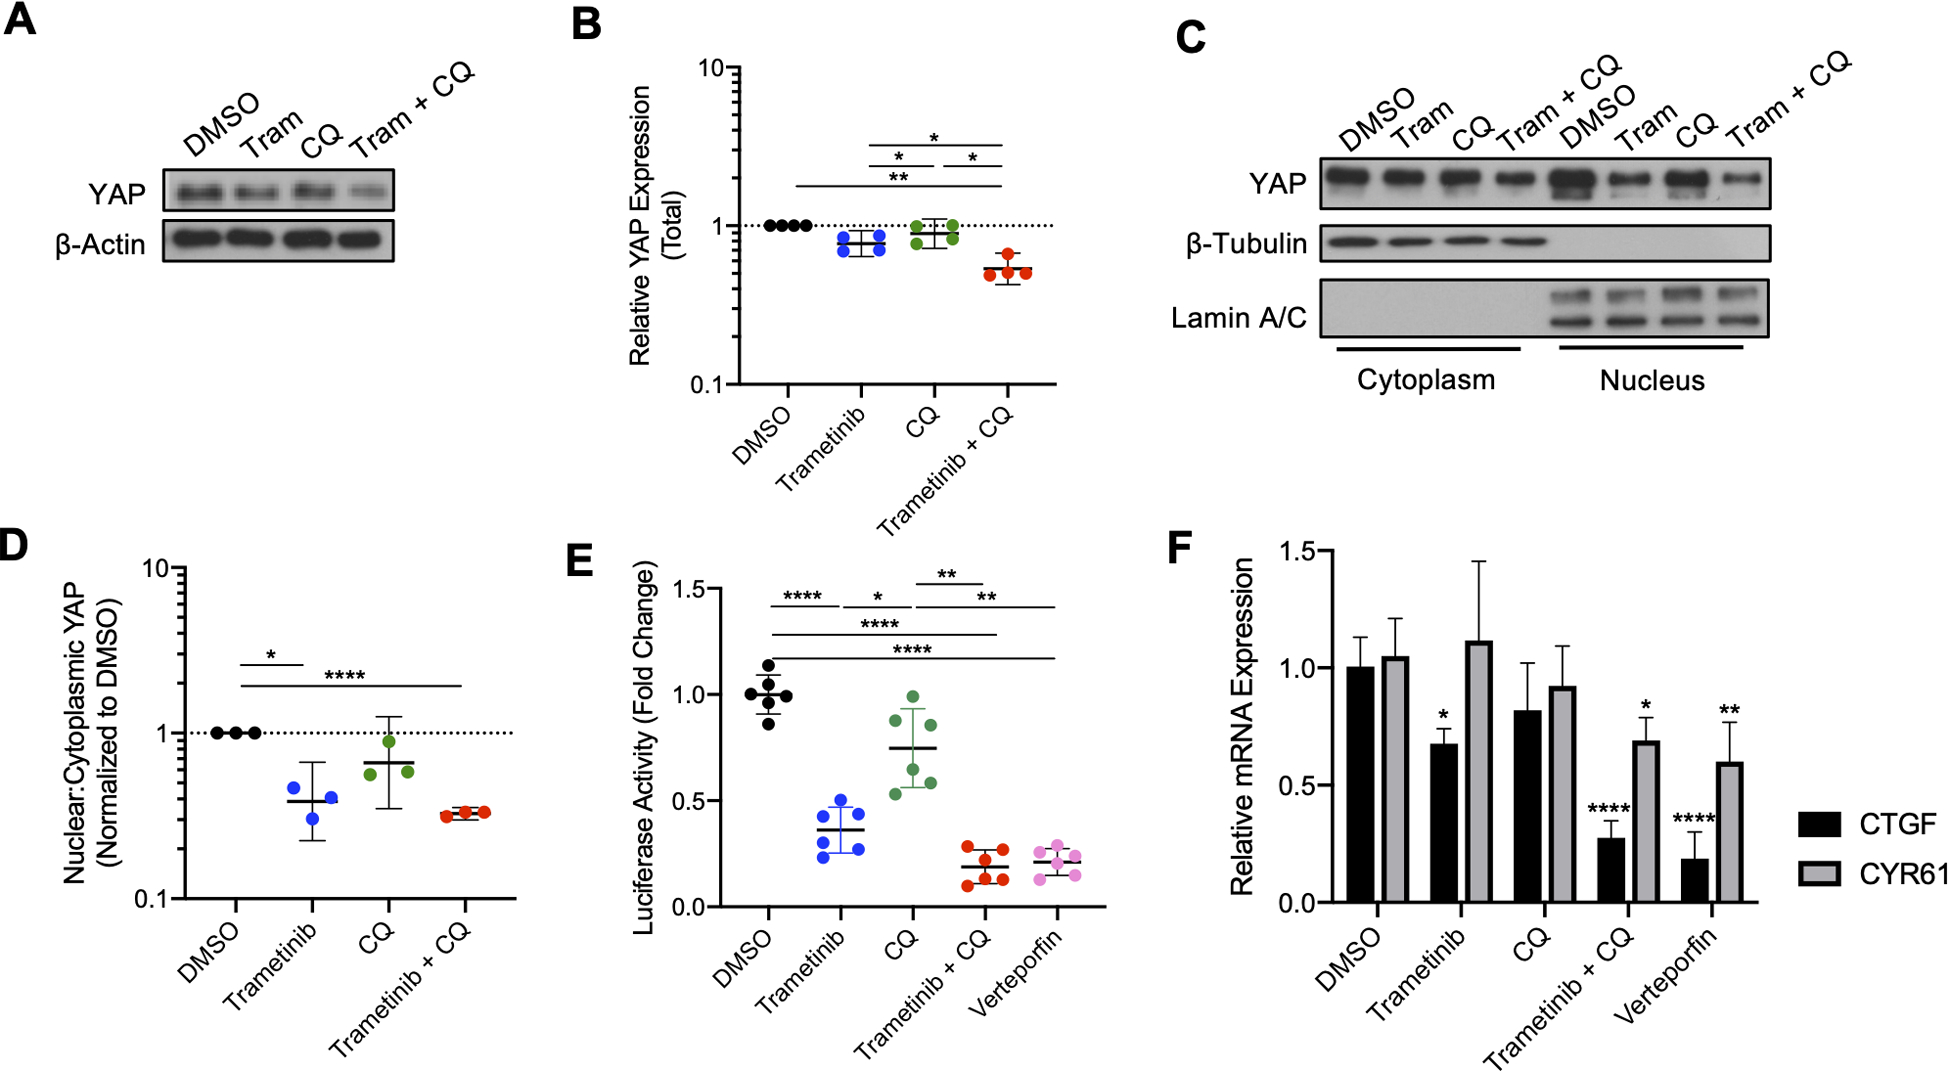
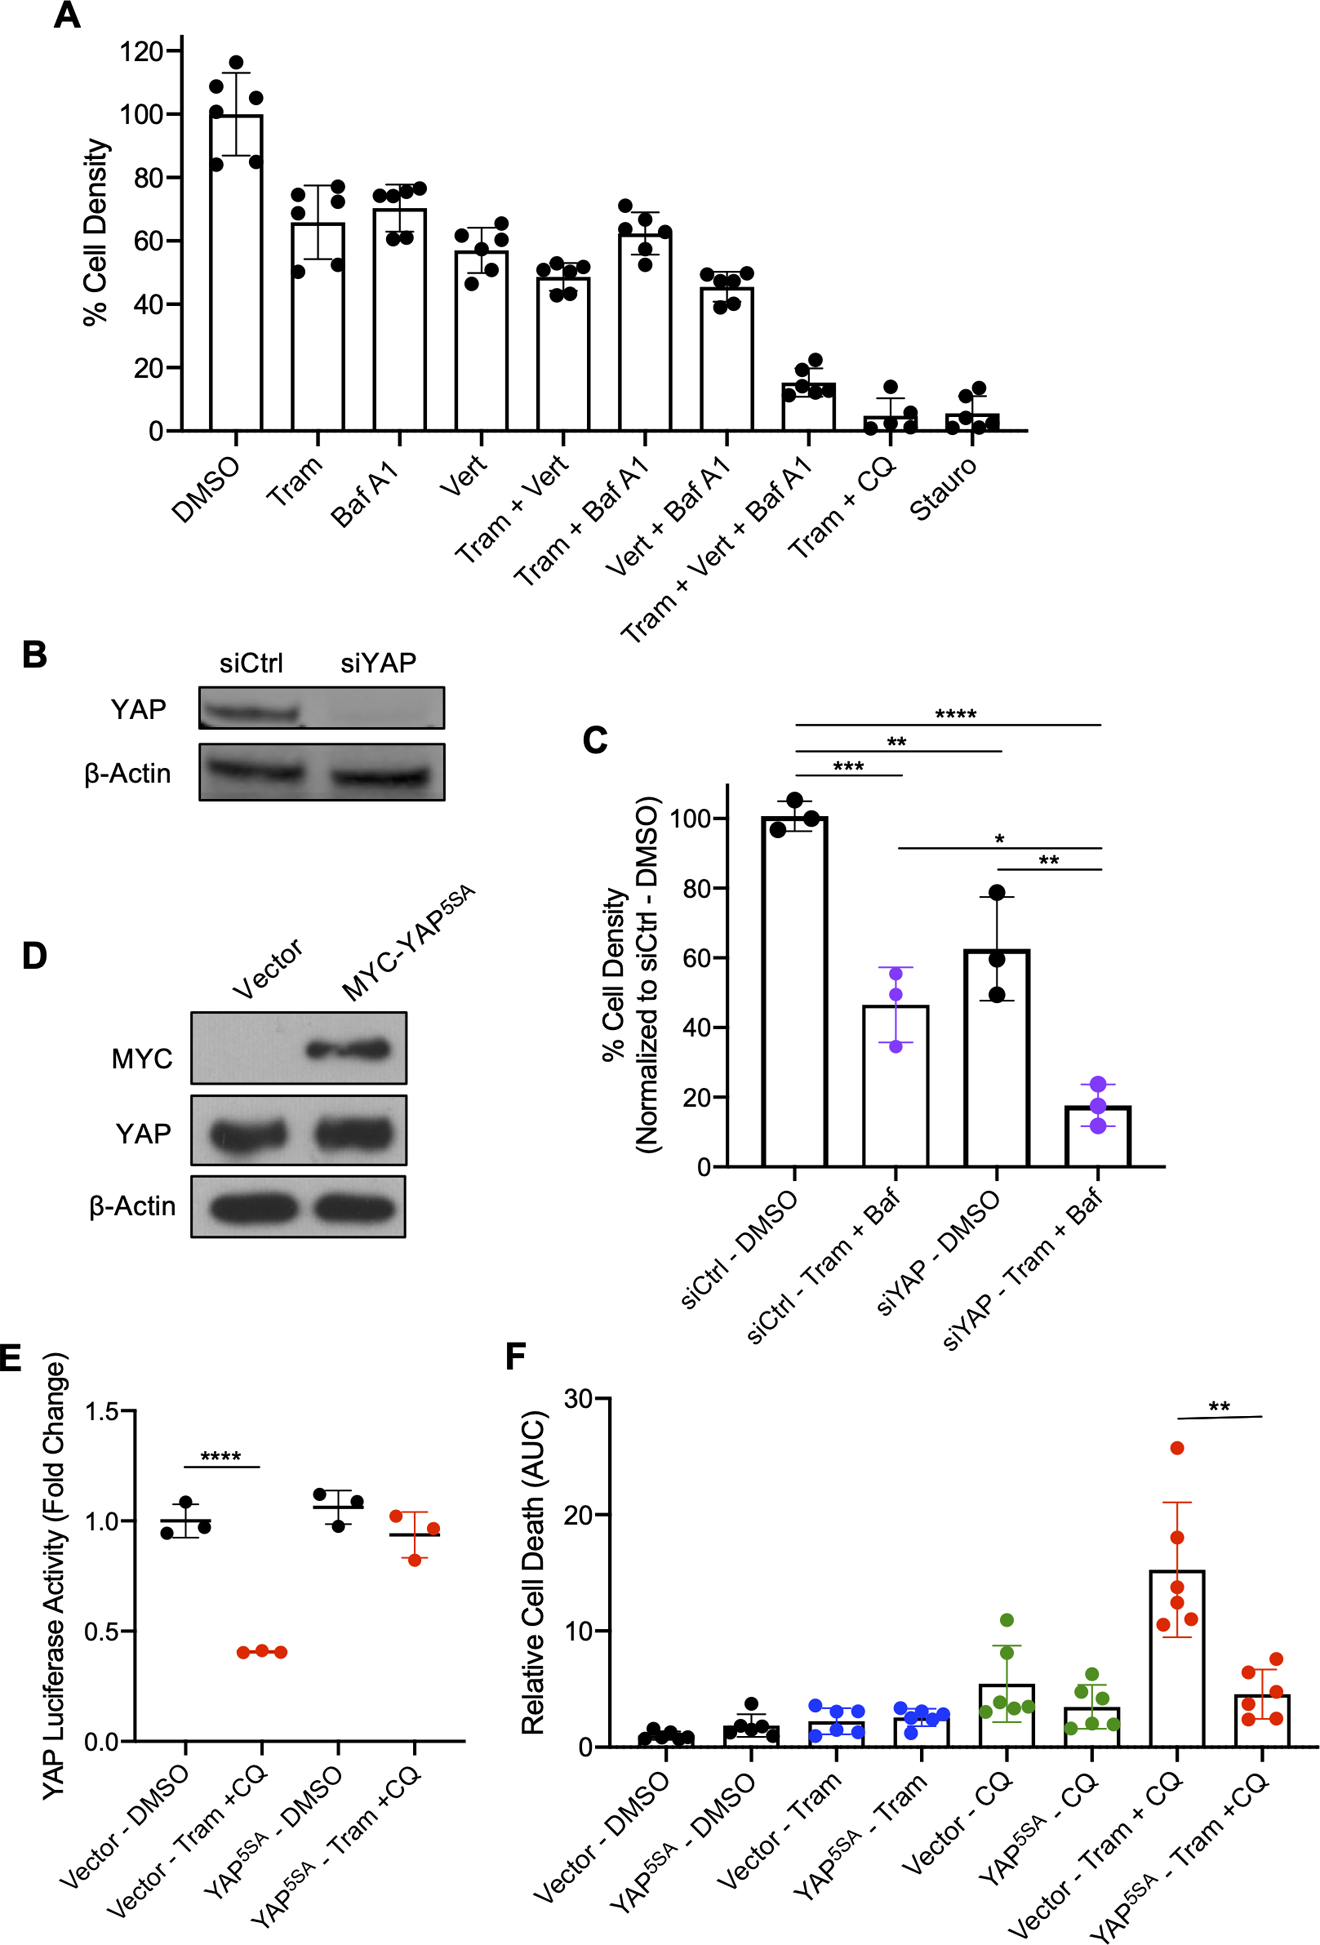
Results: Inhibition of GNAQ/11-mediated activation of MAPK signaling resulted in the induction of autophagy. Combined inhibition of Gα and autophagy or lysosome function resulted in enhanced cell death. Moreover, the combination of MEK1/2 inhibition, using trametinib, with the lysosome inhibitor, chloroquine, also increased cytotoxicity. Treatment of mice bearing GNAQ/11-driven melanomas with trametinib plus hydroxychloroquine resulted in inhibition of tumor growth and significantly prolonged survival. Interestingly, lysosomal- and autophagy-specific inhibition with bafilomycin A1 was not sufficient to promote cytotoxicity in combination with trametinib. However, the addition of YAP inhibition with trametinib plus bafilomycin A1 resulted in cell death at comparable levels to trametinib plus chloroquine (T/CQ) treatment. Furthermore, T/CQ-treated cells displayed decreased YAP nuclear localization and decreased YAP transcriptional activity. Expression of a constitutively active YAP5SA mutant conferred resistance to T/CQ-induced cell death.

Conclusions: These results suggest that YAP, MEK1/2, and lysosome function are necessary and critical targets for the therapy of GNAQ/11-driven melanoma, and identify trametinib plus hydroxychloroquine as a potential treatment strategy for metastatic uveal melanoma.


Conflict of interest statement

Conflicts of Interest: The authors have no relevant conflicts of interest to disclose.

Figures

Figure 1.
Figure 1.. FR900359 induces protective autophagy in a G⍺ mutant-specific manner.
A, Immunoblot of phosphorylated ERK (pERK), ERK, and p62 expression in OMM2.5 and WM793 melanoma cell lines following treatment with DMSO control, trametinib (tram), or FR900359 (FR) for 48 hours. β-actin is used as a loading control. mCherry-eGFP-LC3 autophagy reporter following 48 hours of drug treatment with increasing concentrations of FR or 100 nM MEK1/2 inhibition with trametinib in B, OMM2.5 and C, WM793 cell lines. Statistical significance was determined by comparing corresponding autophagic flux levels (high, intermediate, or low) to DMSO control. D, Immunoblot of ATG4B, p62, and LC3 expression in OMM2.5 cells transduced with a tetracycline-inducible ATG4B-dominant negative mutant (ATG4BDN) and with or without 4 μg/ml doxycycline (Dox). β-Actin is used as a loading control. E, G, H Cell death measured by area under the curve (AUC) over 48 hours of drug treatment. F, mCherry-eGFP-LC3 autophagy reporter following 48 hours treatment with autophagy inhibitors, Bafilomycin A1 and chloroquine (CQ). Autophagy reporter and cell death experiments were performed in technical triplicates. Error bars show standard deviation. *p<0.05; **p<0.01; ***p<0.001; ****p<0.0001.
Figure 2.
Figure 2.. MAPK pathway inhibition induces autophagy and results in synergistic cytotoxicity when combined with chloroquine in GNAQ- and GNA11-mutant melanoma cell lines.
A, immunoblot of phosphorylated ERK (pERK) and ERK expression in melan-a wildtype (WT), Melan-a GNAQQ209L (GNAQ) and melan-a GNA11Q209L (GNA11) cell lines in the absence of serum and TPA for 4 hours. B, synthetic TEAD luciferase reporter assay of YAP-mediated transcriptional activity. C, RT-qPCR analysis of the YAP downstream target, CTGF, mRNA expression levels. D, E, mCherry-eGFP-LC3 autophagy reporter following 48 hours treatment with MEK1/2 inhibitors, trametinib and binimetinib, ERK1/2 inhibitor, SCH72984, or YAP inhibitor, verteporfin in OMM2.5 cells. F, Relative cell death measured over 48 hours and represented by area under the curve (AUC) of GNAQ or GNA11-mutant cell lines. G, Synergy plots (Loewe model) of increasing concentrations of trametinib compared to CQ at 48 hours (OMM2.5 and OMM1) or 72 hours (Melan-a GNAQQ209L and GNA11Q209L) of drug treatment. RT-qPCR experiments were performed in 6 technical replicates (2 samples analyzed in triplicate). Luciferase reporter assay was done in 12 technical replicates (3 samples analyzed in quadruplicate). Autophagy reporter and cell death experiments were performed in technical triplicates. Synergy experiments were performed in technical duplicates. Error bars show standard deviation. *p<0.05; **p<0.01; ***p<0.001; ****p<0.0001.
Figure 3.
Figure 3.. Trametinib in combination with hydroxychloroquine inhibits growth of GNAQ- and GNA11-mutant tumors in vivo.
A, Diagram of hepatic colonization model for luciferase-expressing OMM2.5 tumors or OMM1 tumors. Tumor burden as measured by luminoscore (photons/second) over time for mice bearing B, OMM2.5 and D, OMM1 tumors treated daily by oral gavage of vehicle control, trametinib (1 mg/kg), HCQ (40 mg/kg) or combination. Temozolomide (100 mg/kg) was also treated in mice bearing OMM2.5 tumors C, E, Kaplan-Meier survival curves of tumor endpoint for B and D, respectively. F, Diagram of subcutaneous tumor model for GNAQ/11-mutant melan-a cells injected into syngeneic C57BL/6 mice. Weekly tumor measurements during daily oral gavage of drug treatments for G, melan-a (GNAQQ209L) and I, melan-a (GNA11Q209L). H, J, Kaplan-Meier survival curve of G and I, respectively. Mouse images generated by BioRender. All statistical tests compared to vehicle control, with statistically significant values indicated. Results for each cell line were a combination of two independent experiments. Error bars show standard deviation. Tram: trametinib; HCQ: hydroxychloroquine. *p<0.05; **p<0.01; ***p<0.001; ****p<0.0001.
Figure 4.
Figure 4.. Autophagy- or lysosome-specific inhibition in combination with trametinib does not recapitulate trametinib plus chloroquine-induced cell death.
A, mCherry-eGFP-LC3 autophagy reporter for OMM2.5 cells transduced with tetracycline-inducible ATG4B-dominant negative mutant (OMM2.5 ATG4BDN). B, Relative cell death measured over 48 hours drug treatment and represented by area under the curve (AUC) of OMM2.5 ATG4BDN cells. C, Relative cell death measured over 48 hours of OMM2.5 cells treated with trametinib, bafilomycin A1, or combination. D, Synergy plot (Loewe model) following 48 hours treatment of trametinib and bafilomycin A1. Tram, trametinib; CQ, chloroquine; baf, bafilomycin A1. Autophagy reporter and cell death experiments were performed in technical triplicates. Synergy experiments were performed in technical duplicates. Error bars show standard deviation. ****p<0.0001.
Figure 5.
Figure 5.. Trametinib and chloroquine in combination inhibit YAP signaling.
In OMM2.5 cells, immunoblots showing A, total, C, nuclear localization, and cytoplasmic localization of YAP following 48 hours of drug treatment. β-actin, Lamin A/C, and β-tubulin are loading controls. B, Quantification of total YAP in A normalized to loading controls. D, Ratio of nuclear YAP to cytoplasmic YAP normalized to DMSO. E, YAP-mediated transcription activity levels using luciferase reporter assay following 48 hours of drug treatment. F, mRNA expression of YAP downstream targets, CTGF and CYR61, normalized to GAPDH, following 48 hours of drug treatment. Statistics are comparing drug treatment to DMSO of corresponding mRNA. Tram, 100 nM trametinib; CQ, 5 μM chloroquine; 2 μM verteporfin. Nuclear and cytoplasmic quantifications were performed in technical triplicates. Luciferase reporter experiments were performed in technical triplicate. qPCR experiments were performed in 9 technical replicates (3 samples analyzed in triplicate). Error bars for B, and D show geometric mean with 95% confidence intervals. Error bars for E and F show standard deviation. *p<0.05; **p<0.01; ***p<0.001; ****p<0.0001.
Figure 6.
Figure 6.. YAP inhibition and lysosome inhibition are both required for trametinib plus chloroquine efficacy.
In OMM2.5 cells, A, cell density measured by ATP luminescence following 48 hours of drug treatment. Results were normalized to average DMSO and performed in 5–6 technical replicates. B, Immunoblot of YAP expression in siCtrl- and siYAP-treated OMM2.5 cells 48 hours post-transfection. C, Cell density measured by ATP luminescence following 48 hours of drug treatment in OMM2.5 cells. Cells were drug treated at 24 hours post-transfection with C, siCtrl and D, siYAP. E, Measurement of YAP transcriptional activity of OMM2.5 cells transduced with vector control or YAP5SA plasmid. F, Relative cell death after 48 hours of drug treatment in OMM2.5 cells stably expressing vector control or YAP5SA mutant with statistics comparing vector versus YAP 5SA for corresponding drug treatments. Unless otherwise indicated, experiments were performed in technical triplicates. Tram, 100 nM trametinib; CQ, 5 μM chloroquine; vert, 2 μM verteporfin; Baf, 25 nM bafilomycin A1; Stauro, 100 nM staurosporine; AUC, area under the curve. Error bars show standard deviation. *p<0.05; **p<0.01; ***p<0.001; ****p<0.0001.

Similar articles

Cited by

References

    1. Cancer Genome Atlas N Genomic Classification of Cutaneous Melanoma. Cell. 2015;161(7):1681–96. - PMC - PubMed
    1. Van Raamsdonk CD, Griewank KG, Crosby MB, Garrido MC, Vemula S, Wiesner T, et al. Mutations in GNA11 in uveal melanoma. N Engl J Med. 2010;363(23):2191–9. - PMC - PubMed
    1. Onken MD, Worley LA, Long MD, Duan S, Council ML, Bowcock AM, et al. Oncogenic mutations in GNAQ occur early in uveal melanoma. Invest Ophthalmol Vis Sci. 2008;49(12):5230–4. - PMC - PubMed
    1. Field MG, Durante MA, Anbunathan H, Cai LZ, Decatur CL, Bowcock AM, et al. Punctuated evolution of canonical genomic aberrations in uveal melanoma. Nat Commun. 2018;9(1):116. - PMC - PubMed
    1. Kujala E, Makitie T, Kivela T. Very long-term prognosis of patients with malignant uveal melanoma. Invest Ophthalmol Vis Sci. 2003;44(11):4651–9. - PubMed

Publication types

MeSH terms