

The RNase J-Based RNA Degradosome Is Compartmentalized in the Gastric Pathogen Helicobacter pylori
- PMID: 32934079
- PMCID: PMC7492731
- DOI: 10.1128/mBio.01173-20
The RNase J-Based RNA Degradosome Is Compartmentalized in the Gastric Pathogen Helicobacter pylori
Abstract
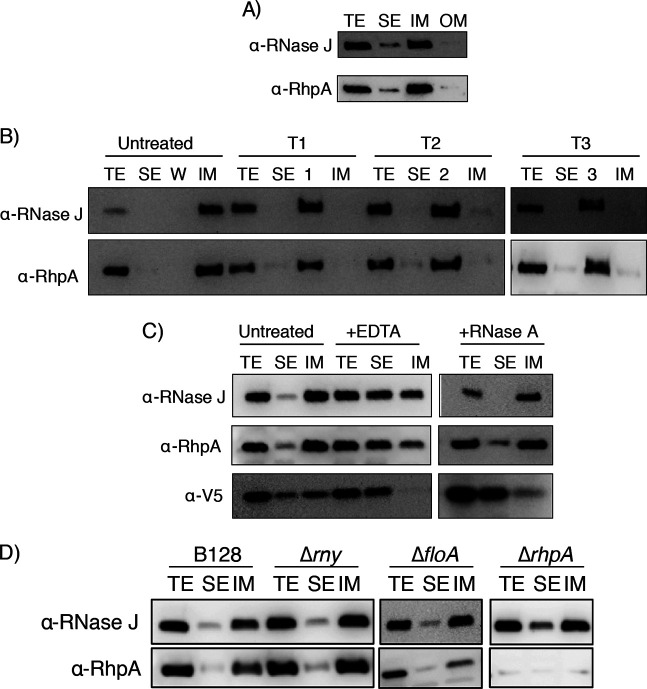
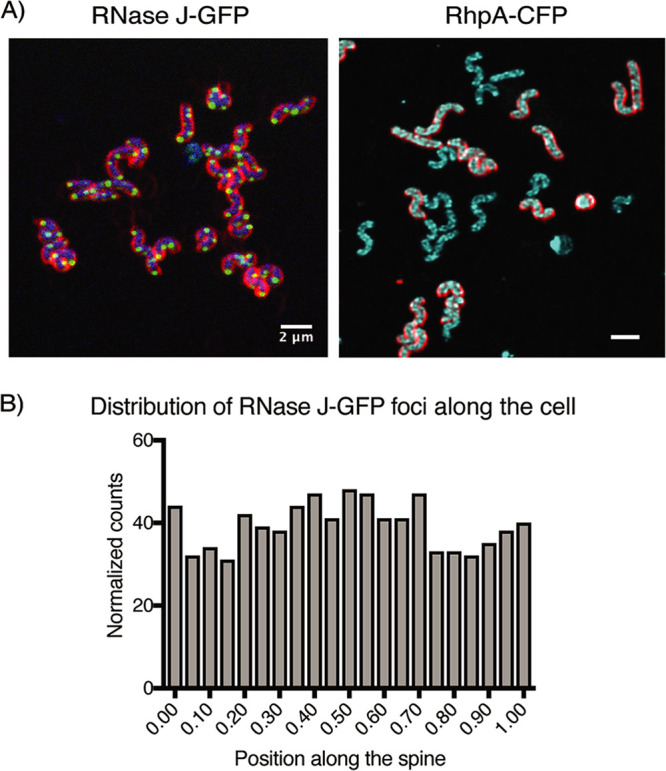
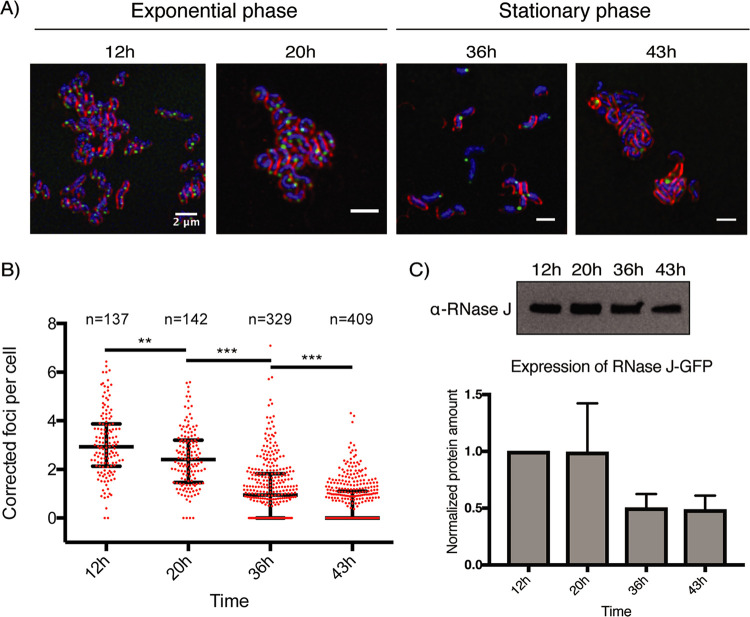
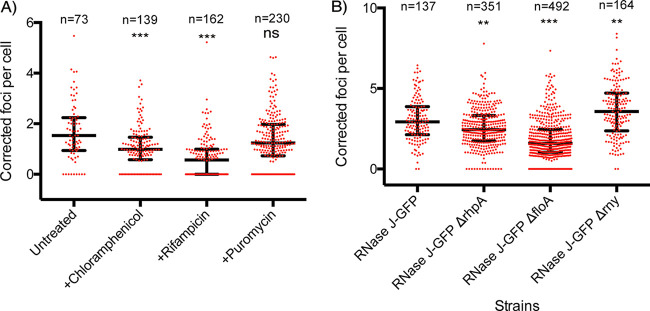
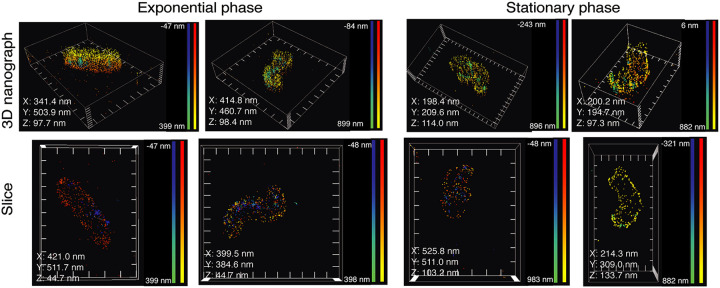
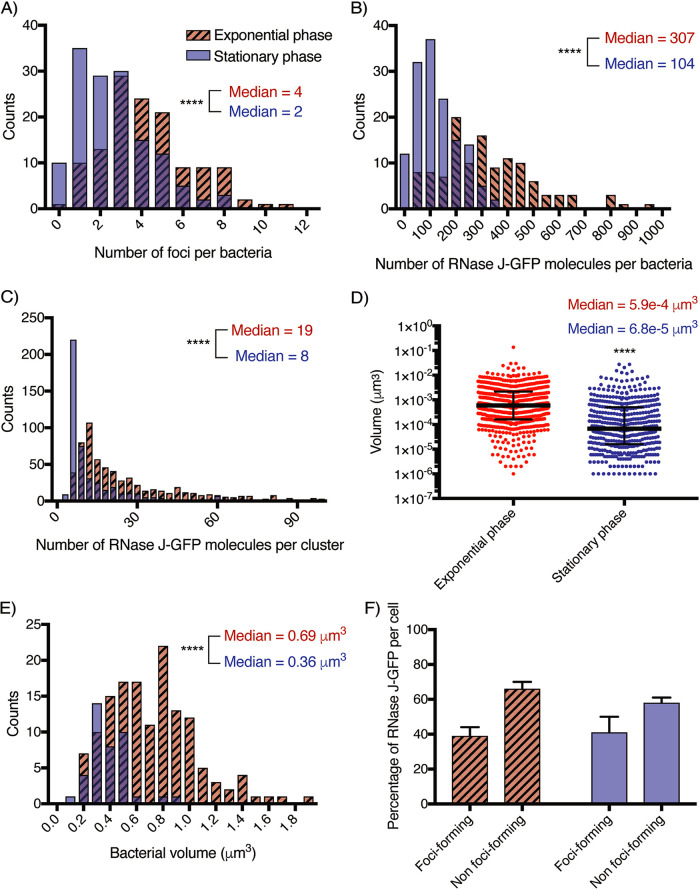
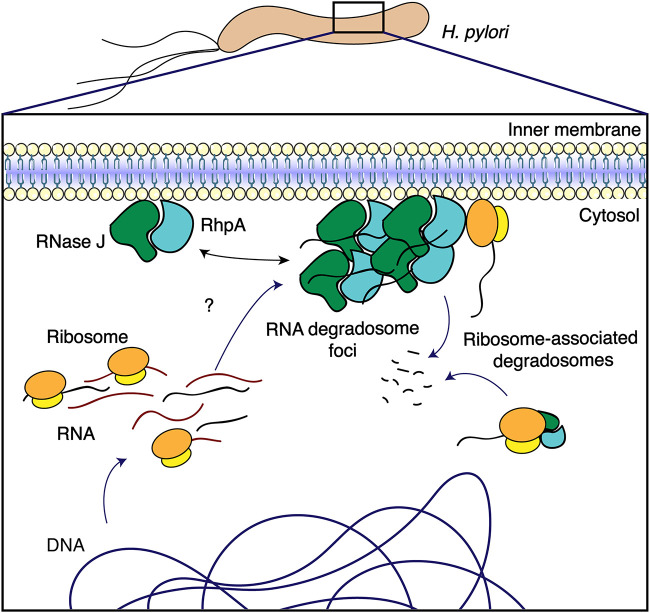
Posttranscriptional regulation is a major level of gene expression control in any cell. In bacteria, multiprotein machines called RNA degradosomes are central for RNA processing and degradation, and some were reported to be compartmentalized inside these organelleless cells. The minimal RNA degradosome of the important gastric pathogen Helicobacter pylori is composed of the essential ribonuclease RNase J and RhpA, its sole DEAD box RNA helicase, and plays a major role in the regulation of mRNA decay and adaptation to gastric colonization. Here, the subcellular localization of the H. pylori RNA degradosome was investigated using cellular fractionation and both confocal and superresolution microscopy. We established that RNase J and RhpA are peripheral inner membrane proteins and that this association was mediated neither by ribosomes nor by RNA nor by the RNase Y membrane protein. In live H. pylori cells, we observed that fluorescent RNase J and RhpA protein fusions assemble into nonpolar foci. We identified factors that regulate the formation of these foci without affecting the degradosome membrane association. Flotillin, a bacterial membrane scaffolding protein, and free RNA promote focus formation in H. pylori Finally, RNase J-GFP (RNase J-green fluorescent protein) molecules and foci in cells were quantified by three-dimensional (3D) single-molecule fluorescence localization microscopy. The number and size of the RNase J foci were found to be scaled with growth phase and cell volume as previously reported for eukaryotic ribonucleoprotein granules. In conclusion, we propose that membrane compartmentalization and the regulated clustering of RNase J-based degradosome hubs represent important levels of control of their activity and specificity.IMPORTANCEHelicobacter pylori is a bacterial pathogen that chronically colonizes the stomach of half of the human population worldwide. Infection by H. pylori can lead to the development of gastric pathologies such as ulcers and adenocarcinoma, which causes up to 800,000 deaths in the world each year. Persistent colonization by H. pylori relies on regulation of the expression of adaptation-related genes. One major level of such control is posttranscriptional regulation, which, in H. pylori, largely relies on a multiprotein molecular machine, an RNA degradosome, that we previously discovered. In this study, we established that the two protein partners of this machine are associated with the membrane of H. pylori Using cutting-edge microscopy, we showed that these complexes assemble into hubs whose formation is regulated by free RNA and scaled with bacterial size and growth phase. Organelleless cellular compartmentalization of molecular machines into hubs emerges as an important regulatory level in bacteria.
Keywords: Helicobacter pylori; RNA degradosome; RNase J; post-transcriptional regulation; subcellular localization; superresolution microscopy.
Copyright © 2020 Tejada-Arranz et al.
Figures
Similar articles
-
A minimal bacterial RNase J-based degradosome is associated with translating ribosomes.Nucleic Acids Res. 2013 Jan 7;41(1):288-301. doi: 10.1093/nar/gks945. Epub 2012 Oct 22. Nucleic Acids Res. 2013. PMID: 23093592 Free PMC article.
-
The Sole DEAD-Box RNA Helicase of the Gastric Pathogen Helicobacter pylori Is Essential for Colonization.mBio. 2018 Mar 27;9(2):e02071-17. doi: 10.1128/mBio.02071-17. mBio. 2018. PMID: 29588407 Free PMC article.
-
Polyribosome-Dependent Clustering of Membrane-Anchored RNA Degradosomes To Form Sites of mRNA Degradation in Escherichia coli.mBio. 2021 Oct 26;12(5):e0193221. doi: 10.1128/mBio.01932-21. Epub 2021 Sep 7. mBio. 2021. PMID: 34488454 Free PMC article.
-
Bacterial RNA Degradosomes: Molecular Machines under Tight Control.Trends Biochem Sci. 2020 Jan;45(1):42-57. doi: 10.1016/j.tibs.2019.10.002. Epub 2019 Nov 1. Trends Biochem Sci. 2020. PMID: 31679841 Free PMC article. Review.
-
Compartmentalization of RNA Degradosomes in Bacteria Controls Accessibility to Substrates and Ensures Concerted Degradation of mRNA to Nucleotides.Annu Rev Microbiol. 2022 Sep 8;76:533-552. doi: 10.1146/annurev-micro-041020-113308. Epub 2022 Jun 7. Annu Rev Microbiol. 2022. PMID: 35671533 Review.
Cited by
-
Reorganization of Cell Compartmentalization Induced by Stress.Biomolecules. 2022 Oct 8;12(10):1441. doi: 10.3390/biom12101441. Biomolecules. 2022. PMID: 36291650 Free PMC article. Review.
-
Proteomic composition of eukaryotic and bacterial RNA decay condensates suggests convergent evolution.Curr Opin Microbiol. 2024 Jun;79:102467. doi: 10.1016/j.mib.2024.102467. Epub 2024 Apr 3. Curr Opin Microbiol. 2024. PMID: 38569418 Free PMC article. Review.
-
Caulobacter crescentus RNase E condensation contributes to autoregulation and fitness.Mol Biol Cell. 2024 Aug 1;35(8):ar104. doi: 10.1091/mbc.E23-12-0493. Epub 2024 Jun 12. Mol Biol Cell. 2024. PMID: 38865176 Free PMC article.
-
Stress-Induced Membraneless Organelles in Eukaryotes and Prokaryotes: Bird's-Eye View.Int J Mol Sci. 2022 Apr 30;23(9):5010. doi: 10.3390/ijms23095010. Int J Mol Sci. 2022. PMID: 35563401 Free PMC article. Review.
-
RNase Y mediates posttranscriptional control of the virulence-associated CncR1 small-RNA in Helicobacter pylori.iScience. 2025 Jan 16;28(2):111815. doi: 10.1016/j.isci.2025.111815. eCollection 2025 Feb 21. iScience. 2025. PMID: 39949958 Free PMC article.
References
-
- Płociński P, Macios M, Houghton J, Niemiec E, Płocińska R, Brzostek A, Słomka M, Dziadek J, Young D, Dziembowski A. 2019. Proteomic and transcriptomic experiments reveal an essential role of RNA degradosome complexes in shaping the transcriptome of Mycobacterium tuberculosis. Nucleic Acids Res 47:5892–5905. doi:10.1093/nar/gkz251. - DOI - PMC - PubMed
Publication types
MeSH terms
Substances
LinkOut - more resources
Full Text Sources
