. 2020 Sep 29;117(39):24110-24116.
doi: 10.1073/pnas.2003337117. Epub 2020 Sep 15.

Emergence of anomalous dynamics in soft matter probed at the European XFEL

Affiliations

Emergence of anomalous dynamics in soft matter probed at the European XFEL

Felix Lehmkühler et al. Proc Natl Acad Sci U S A. .

Abstract

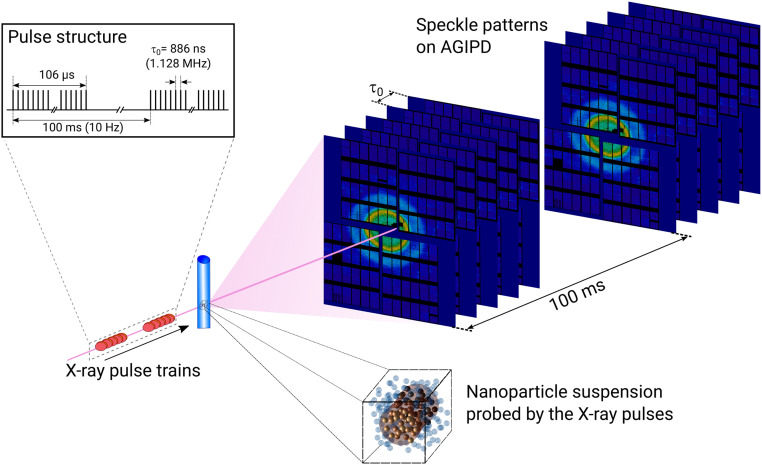
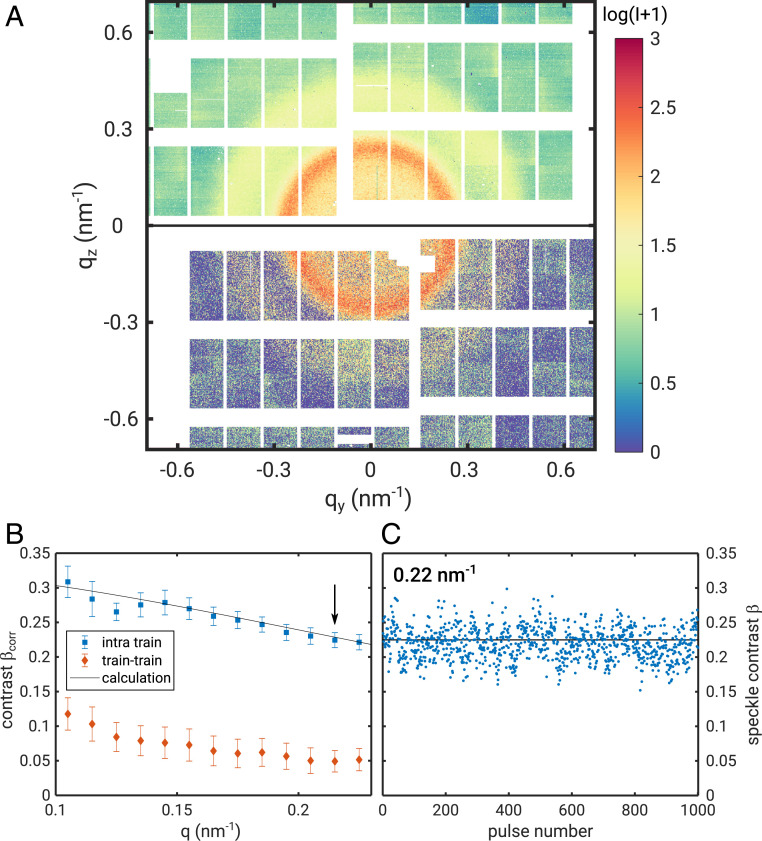
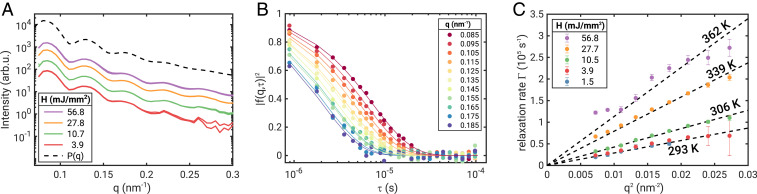
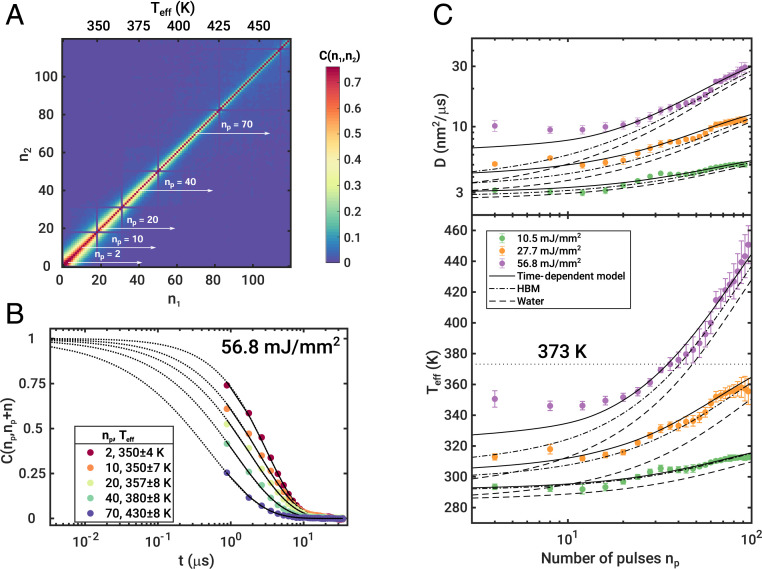
Dynamics and kinetics in soft matter physics, biology, and nanoscience frequently occur on fast (sub)microsecond but not ultrafast timescales which are difficult to probe experimentally. The European X-ray Free-Electron Laser (European XFEL), a megahertz hard X-ray Free-Electron Laser source, enables such experiments via taking series of diffraction patterns at repetition rates of up to 4.5 MHz. Here, we demonstrate X-ray photon correlation spectroscopy (XPCS) with submicrosecond time resolution of soft matter samples at the European XFEL. We show that the XFEL driven by a superconducting accelerator provides unprecedented beam stability within a pulse train. We performed microsecond sequential XPCS experiments probing equilibrium and nonequilibrium diffusion dynamics in water. We find nonlinear heating on microsecond timescales with dynamics beyond hot Brownian motion and superheated water states persisting up to 100 μs at high fluences. At short times up to 20 μs we observe that the dynamics do not obey the Stokes-Einstein predictions.

Keywords: Free-Electron Laser; X-ray photon correlation spectroscopy; diffusion; soft matter.


Conflict of interest statement

The authors declare no competing interest.

Figures

Fig. 1.
Fig. 1.
Sketch of the experiment at the SPB instrument of the European XFEL. The X-ray pulse trains scatter from the sample filled in quartz capillaries. The speckle patterns are recorded in small-angle scattering geometry 5.5 m downstream of the sample by the AGIPD detector. Each pulse train with 120 pulses was generated at 10-Hz repetition rate. Within the train, consecutive pulses were separated by τ0=886 ns (1.128 MHz). For clarity, only 5 instead of 120 speckle patterns per train are shown. The sample volume exposed to the X-ray pulses is schematically highlighted by the darker color.
Fig. 2.
Fig. 2.
AGIPD images after dark and baseline correction and extracted speckle contrast from the static sample. (A) Scattering pattern averaged over 500 trains (Top) and single-shot speckle pattern (Bottom) from the static sample. White parts indicate masked pixels and blind regions between the AGIPD modules. The intensity scale is given in analog-to-digital unit (ADU) values (SI Appendix). One photon corresponds to 65 ADU. (B) Contrast βcorr from correlation function g2 as a function of q calculated within the train (intratrain) and between pulse trains (train–train). The solid line represents the calculated contrast (43). (C) Single-shot speckle contrast from 1,000 successive single pulses at q=0.22nm1 (arrow in B). The black line marks the average contrast of 0.225.
Fig. 3.
Fig. 3.
Structure and dynamics of dilute nanoparticle dispersion. (A) Intensity as a function of wavevector transfer q for different fluences H. The vertical offset indicates the intensity variation with fluence. For each H several runs were performed at different sample spots whose I(q) match each other within the statistical accuracy. The dashed line shows the calculated form factor of spherical particles with R=69 nm and ΔR/R=0.045. (B) Square modulus of the intermediate scattering function obtained from the correlation function g2 via Eq. 2 for different q values. The data were measured at H=27.7 mJ/mm2 with a single-pulse train. (C) Relaxation rates for different fluences H as a function of q2. The dashed lines are fits of Eq. 4 to the data with the temperature as the only free parameter.
Fig. 4.
Fig. 4.
Steady sample heating. (A) Instantaneous correlation function C(n1,n2)=C(np,np+n) at q=0.125nm1 and H=56.8 mJ/mm2 averaged over 500 pulse trains. (B) Correlation functions C(np,np+n) for np as indicated. The sequences are marked in A by white arrows. Teff was calculated from the extracted diffusion constants. (C) Diffusion coefficient D (Top) and temperature Teff (Bottom) as function of pulse number in the pulse train np for different H. The oscillating features for np>30 stem from the modulation of pulse intensities in the pulse train (SI Appendix). The black lines represent the time-dependent heating model, the dashed-dotted lines the HBM model, and the dashed lines the heating of water as solvent only. The boiling temperature of water at p=1 bar is given by the horizontal dotted line.

References

    1. Emma P., et al. , First lasing and operation of an ångstrom-wavelength free-electron laser. Nat. Photonics 4, 641–647 (2010).
    1. Ishikawa T., et al. , A compact x-ray free-electron laser emitting in the sub-ångström region. Nat. Photon. 6, 540–544 (2012).
    1. Altarelli M., The European X-ray free-electron laser facility in Hamburg. Nucl. Instrum. Methods Phys. Res. Sect. B 269, 2845–2849 (2011).
    1. Yang H., Kim G., Kang H. S., First saturation of 14.5 keV free electron laser at PAL-XFEL. Nucl. Instrum. Methods Phys. Res. Sect. A 911, 51–54 (2018).
    1. Bostedt C., et al. , Linac coherent light source: The first five years. Rev. Mod. Phys. 88, 015007 (2016).

Publication types

LinkOut - more resources