. 2020 Sep 15;11(9):755.
doi: 10.1038/s41419-020-02956-2.

Overactivated sonic hedgehog signaling aggravates intrauterine adhesion via inhibiting autophagy in endometrial stromal cells

Affiliations

Overactivated sonic hedgehog signaling aggravates intrauterine adhesion via inhibiting autophagy in endometrial stromal cells

Cheng Wei et al. Cell Death Dis. .

Erratum in

Abstract

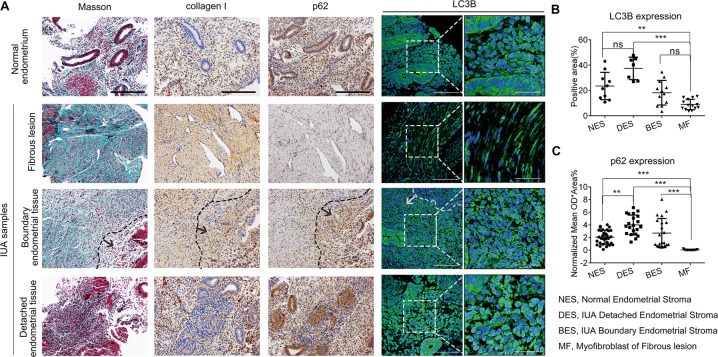
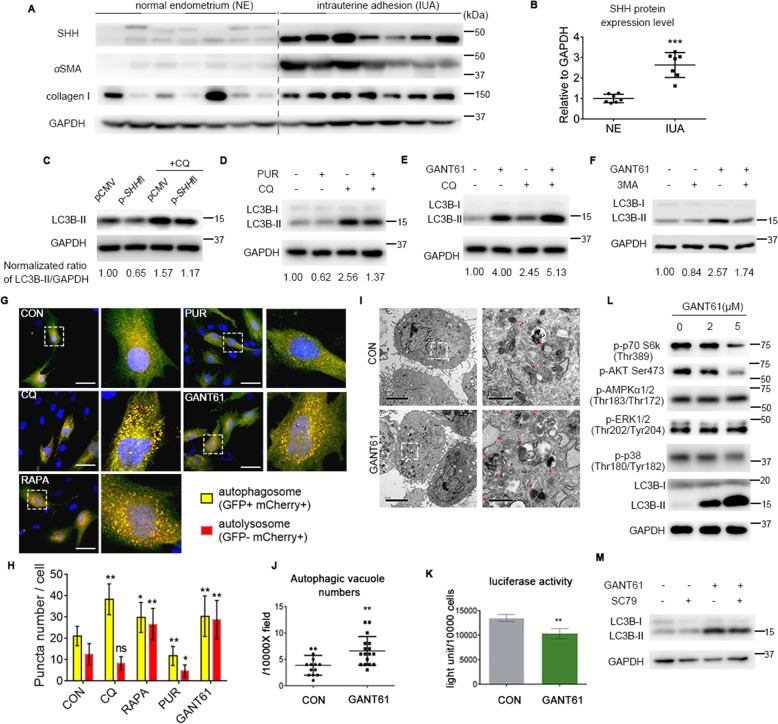
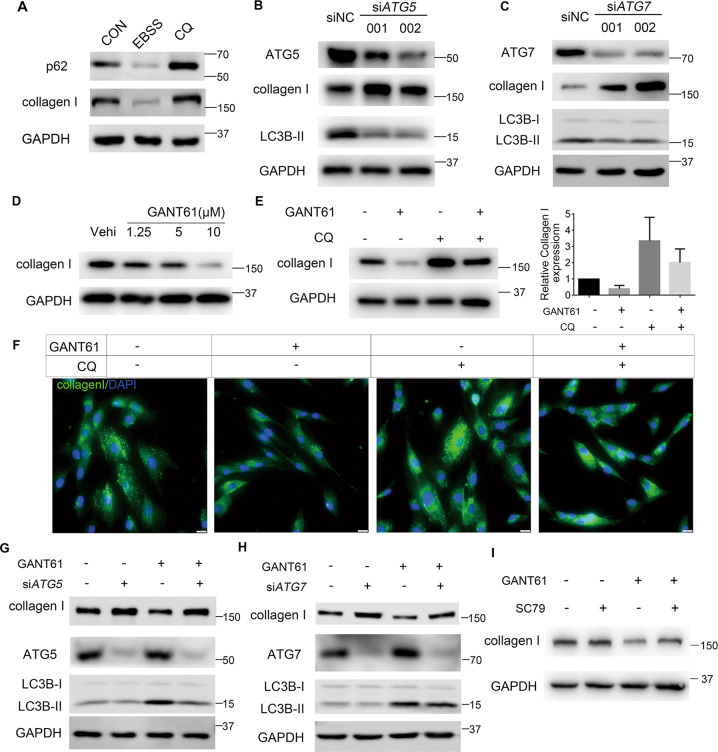
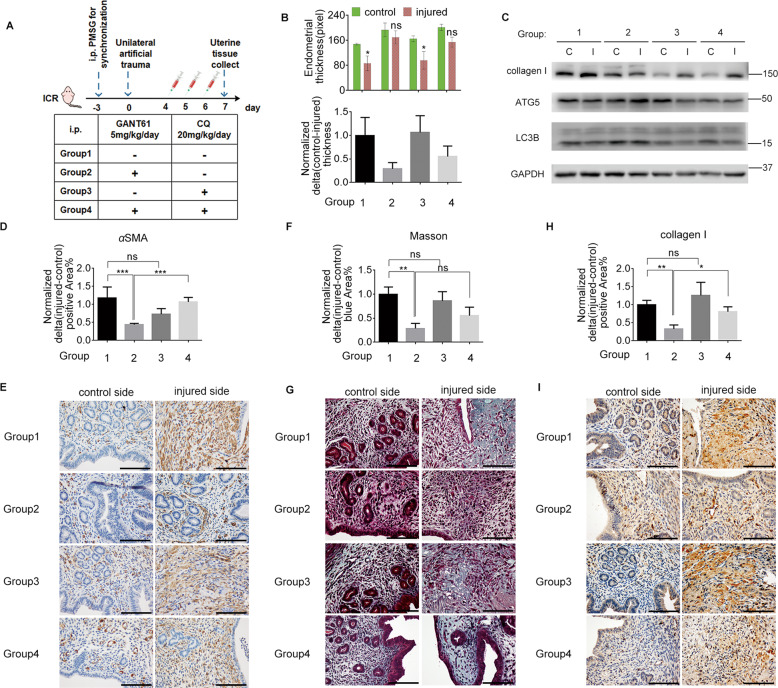
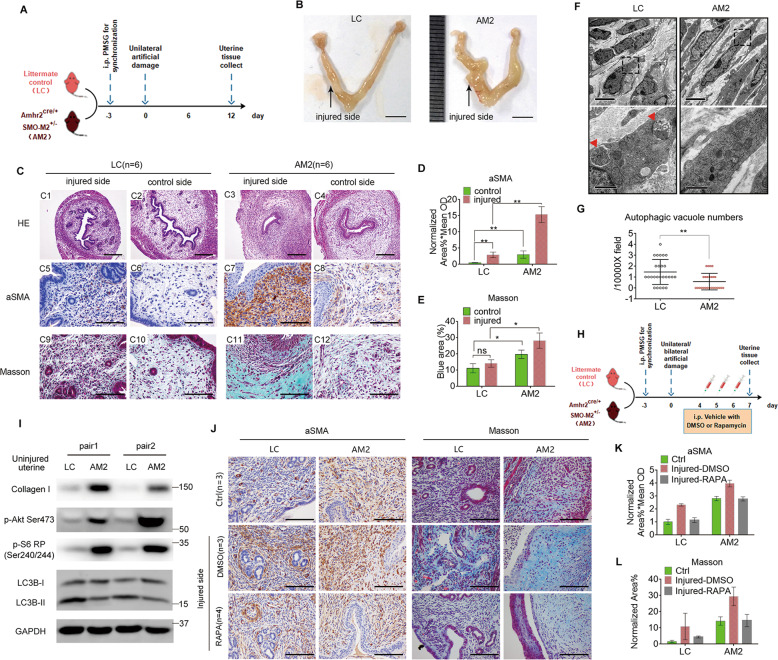
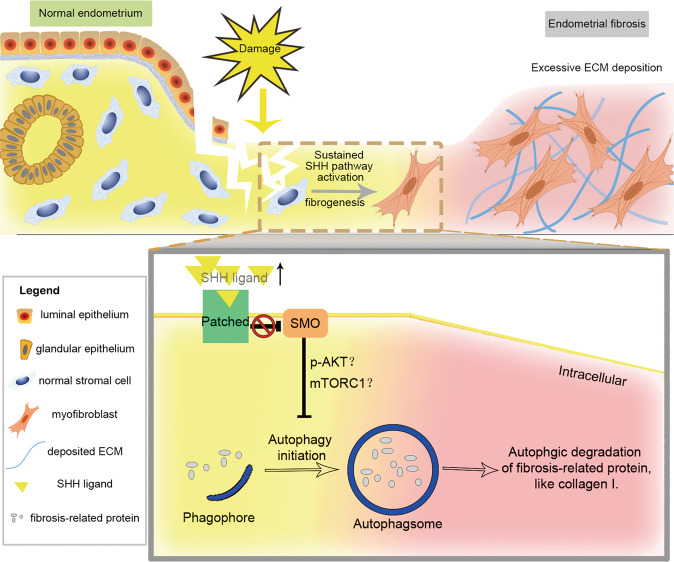
Autophagy can be dynamically induced in response to stresses and is an essential, ubiquitous intracellular recycling system that impacts the fate of damaged resident cells, thereby influencing wound healing. Endometrial fibrosis is a form of abnormal wound healing that causes intrauterine adhesion (IUA) and infertility. We previously demonstrated that overactivated sonic hedgehog (SHH) signaling exacerbated endometrial fibrosis, but the role of autophagy in this process is still unknown. Here, we report that impaired autophagy participates in SHH pathway-induced endometrial fibrosis. Endometrial stroma-myofibroblast transition accompanied by autophagy dysfunction was present in both endometrial biopsies of IUA patients and Amhr2cre/+ R26-SmoM2+/- (AM2) transgenic mouse. Mechanistically, SHH pathway negatively regulated autophagy through pAKT-mTORC1 in a human endometrial stromal cell line (T-HESCs). Furthermore, SHH pathway-mediated fibrosis was partly counteracted by autophagy modulation in both T-HESCs and the murine IUA model. Specifically, the impact of SHH pathway inhibition (GANT61) was reversed by the pharmacological autophagy inhibitor chloroquine (CQ) or RNA interference of autophagy-related gene ATG5 or ATG7. Similar results were obtained from the murine IUA model treated with GANT61 and CQ. Moreover, promoting autophagy with rapamycin reduced fibrosis in the AM2 IUA model to baseline levels. In summary, defective autophagy is involved in SHH pathway-driven endometrial fibrosis, suggesting a potential novel molecular target for IUA treatment.


Conflict of interest statement

The authors declare that they have no conflict of interest.

Figures

Fig. 1
Fig. 1. Autophagy levels varied in different regional endometrial stroma among endometrial fibrosis.
a Representative images of Masson, collagen I, and p62 IHC staining and LC3B immunofluorescence staining in normal endometrium and different locations in IUA samples (including fibrous lesions, boundary endometrial tissue, and detached endometrial tissue). Scale bars, 200 μm (1st–3rd), 50 μm (4th), 20 μm (5th), and 1 μm (6th column). Dotted lines indicate the boundary of the fibrous lesion, and arrowheads point to boundary endometrial tissue. b, c Quantitative analyses of the %area of LC3B puncta (b) and mean ODx the % positive area of p62 (c) in different endometrial stroma. Each scatter plot represents data from a high magnification field. All data were obtained from five normal endometrial patients and nine IUA patients. The data represent the mean ± S.D. NES normal endometrial stroma, BES IUA boundary endometrial stroma, DES IUA-detached endometrial stroma, MF myofibroblast of fibrous lesion. Statistical analyses were performed by Kruskal–Wallis test (nonparametric method) plus Dunn’s multiple comparisons test (b, c). ***p < 0.001; **p < 0.01; *p < 0.05; ns not significant.
Fig. 2
Fig. 2. SHH signaling negatively regulates autophagy initiation.
a Representative immunoblot images of SHH (full length) and fibrotic markers (αSMA and collagen I) in normal endometrium (NE) and intrauterine adhesion (IUA) sample lysates. b Semiquantitative plot showing SHH expression relative to GAPDH and normalized to the normal endometrium group. c T-HESCs were transfected with pCMV (vector) or pSHHfl plasmid and then treated with CQ (20 μM) for the last 4 h before being collected for western blot analysis. d, e T-HESCs were treated with the SMO agonist purmorphamine (d, PUR) or the GLI inhibitor (e, GANT61) for 24 h, followed by treatment with or without CQ (20 μM) for 4 h before being collected for western blot analysis. f T-HESCs were treated with GANT61 with or without 5 mM 3-MA for 6 h. LC3B-II levels were quantified by densitometric analysis, were normalized to GAPDH, and are shown under the indicated bands. g After being infected with Ad-mCherry-GFP-LC3B, T-HESCs were treated with SHH drugs (PUR 5 μM and GANT61 5 μM) for 24 h, the autophagy drug CQ 20 μM for 4 h or RAPA 0.1 μM for 2 h before confocal fluorescence analysis. Scale bars, 50 µm. h Relative quantifications of yellow vesicles (GFP+mCherry+ puncta and autophagosomes) and red vesicles (GFPmCherry+ puncta and autolysosomes) per cell by ImageJ software; cells were treated as described in g. Pictures were taken from three independent experiments. Each group had a cell number >15. The data represent the mean ± S.D. i TEM images of T-HESCs with or without GANT61 treatment for 24 h. Right-side images are relative enlargements of the dotted box on the left. Red triangles indicate autophagic vacuoles. Scale bars, 5 μm and 1 μm (left and right, respectively). j Quantification of autophagic vacuoles per 10,000X field of three independent experiments; cells were treated as described in h. The data represent the mean ± S.D. k T-HESCs were transfected with the p-Luc2p-p62 vector, and 24 h later, the cells were treated with vehicle or GANT61 (5 µM) for 24 h before cell extracts were prepared for firefly luciferase activity. The light unit was normalized by relative cell number (10000 cells). Data represent the mean ± S.D. of three independent experiments. l Western blot analysis of p-p70 S6k (a substrate of mTORC1) and known mTOR upstream modulators (p-AKT Ser473, p-AMPKα, p-ERK1/2, and p-p38) in protein lysates of T-HESCs after GANT61 treatment for 24 h. m T-HESCs were treated with GANT61 (5 µM) with or without SC79 (10 μM) for 24 h before western blot analysis of LC3B expression. Statistical analyses were performed by two-sided Mann–Whitney U-test (b, j) and two-way ANOVA plus Bonferroni’s multiple comparisons test (h) comparing to group control. **p < 0.01; *p < 0.05; ns not significant.
Fig. 3
Fig. 3. Autophagy reversed the effect of the SHH pathway on collagen I in T-HESCs.
a Representative immunoblot images of p62 and collagen I in T-HESCs treated with an autophagy stimulator (EBSS) for 4 h or a lysosomal inhibitor (CQ 20 μM) for 8 h. b, c T-HESCs were transfected with control (siNC), siATG5 (b), or siATG7 (c) for 48 h before being collected for immunoblot analysis to measure collagen I, LC3B, and ATG5 (or ATG7) expression. d Representative immunoblot images of collagen I in T-HESCs treated with gradient doses of GANT61 for 24 h. e T-HESCs were treated with GANT61 for 24 h, followed by treatment with or without 20 μM CQ for 4 h before being collected for immunoblot analysis. The right bar chart is normalized relative expression of collagen I from three independent experiments, as indicated on the left side. The data represent the mean ± S.D. f Representative images showing immunostaining of collagen I (green) in T-HESCs treated as described in c. Nuclei are labeled with DAPI and are blue. Scale bar, 100 µm. g, h T-HESCs were transfected with control (siNC), siATG5 (e) or siATG7 (g) for 48 h before being collected for immunoblot analysis of collagen I, LC3B, ATG5, or ATG7. i, T-HESCs were treated with GANT61 (5 µM) with or without SC79 (10 µM) for 24 h before western blot analysis of collagen I expression.
Fig. 4
Fig. 4. Autophagy reversed the effects of the SHH pathway on murine endometrial fibrosis.
a Schematic diagram of the groupings and detailed treatments with GANT61 and CQ in a murine IUA model. b The top panel shows the thickness of the normal endometrium in both the control and injured side in the four groups (5 mice/group); statistical analyses were performed comparing the control and injured sides and are shown in this graph. The bottom panel shows the corresponding normalized changes in endometrial thickness in the top panel. c A section of uterine lysate from groups 1–4 were analyzed by immunoblotting to measure collagen I, ATG5, LC3B, and GAPDH expression levels. d, f, h Quantitative analyses of the percentage of the αSMA-positive area (d), blue area showing Masson staining (f) and the collagen I-positive area (h) via normalized changes in each group. e, g, i Representative images of αSMA IHC staining (e), Masson staining (g), and collagen I IHC staining (i) in injured and control transverse uterine sections from mice in groups 1–4. Scale bars, 100 μm. Data show mean ± S.E. Statistical analyses were performed by two-way ANOVA plus Bonferroni’s multiple comparisons test (based on matching design) (b) and Kruskal–Wallis test (nonparametric method) plus Dunn’s multiple comparisons test (df) comparing to group control. ***p < 0.001; **p < 0.01; *p < 0.05; ns not significant.
Fig. 5
Fig. 5. Constitutive activation of SMO in the endometrial stroma exacerbates fibrosis in the IUA model and was alleviated by the autophagy inducer rapamycin.
a Schematic diagram of establishing the IUA model on Amhr2cre/+R26-SmoM2+/− (AM2) mouse with endometrial stroma-specific constitutive activation of SMO and littermate control (LC) mouse. Uterine tissues were collected on the 12th day. b Representative gross uterine photographs of the AM2 and LC IUA models. Scale bars, 5 mm. c Representative H&E staining (C1–C4), αSMA IHC staining (C5–C8), and Masson staining (C9-C12) images of injured and control side uterine transverse sections from LC (n = 6) and AM2 (n = 6) mice. Scale bars, 20 μm and 100 μm (C1-C4, C5-C12, respectively). d Quantitative analysis of αSMA IHC staining as determined by the mean OD × %positive area in groups treated as described in C5-C6, by ImageJ. e Quantitative analysis of the blue area of Masson staining as determined by the %area in groups treated as described in C9–C12, by ImageJ. f Representative TEM images showing endometrial stromal cells from LC and AM2 control sides of the uterus. Pictures in the bottom panel are relative enlargements of the dotted box on the top. Scale bars, 5 μm and 1 μm (top and bottom, respectively). Red triangles indicate autophagic vacuoles. g Quantification of autophagic vacuoles per 10,000X field in f. h Schematic diagram of the detailed treatments with rapamycin (RAPA, 2 mg/kg/day, for 3 days) in a murine IUA model of AM2 and LC mice. Uterine tissues were collected on the 7th day. i A section of uterine lysate from AM2 and LC mice was collected for immunoblot analysis of collagen I, p-Akt S473, p-S6 RP Ser240/244 (a substrate of p-p70S6K), LC3B and GAPDH expression levels. j Representative αSMA IHC staining and Masson staining images of longitudinal uterine sections from LC and AM2 mice in the three groups: Ctrl represents uninjured uterus (n = 3); DMSO represents injured uterus with DMSO treatment (n = 3); and RAPA represents injured uterus with RAPA treatment (n = 4). k, l Quantitative analysis of αSMA IHC staining (k) as determined by mean OD × %area and blue area of Masson staining (l) as determined by the %area in groups treated as described in (j) by ImageJ. Data show mean ± S.E. Statistical analyses were performed by two-way ANOVA plus Bonferroni’s multiple comparisons test (based on matching design; d, e). **p < 0.01; *p < 0.05; ns not significant.
Fig. 6
Fig. 6. A model of the SHH-inhibited autophagy involved in the pathogenesis of endometrial fibrosis.
After damage, elevated SHH ligand expression activates the SHH pathway in endometrial stromal cells, which causes fibrogenesis and drives a stroma-myofibroblast transition if the activation is sustained. For the SHH-driven fibrosis, declined autophagy, which is regulated by SHH pathway and might be mediated by pAKT-mTORC1, influences the degradation of fibrosis-related proteins (like collagen I), contributing to the regulatory mechanism.

Similar articles

Cited by

References

    1. Evans J, et al. Fertile ground: human endometrial programming and lessons in health and disease. Nat. Rev. Endocrinol. 2016;12:654–667. - PubMed
    1. Strowitzki T, Germeyer A, Popovici R, von Wolff M. The human endometrium as a fertility-determining factor. Hum. Reprod. Update. 2006;12:617–630. - PubMed
    1. Yu D, Wong YM, Cheong Y, Xia E, Li TC. Asherman syndrome–one century later. Fertil. Steril. 2008;89:759–779. - PubMed
    1. Deans R, Abbott J. Review of intrauterine adhesions. J. Minim. Invasive Gynecol. 2010;17:555–569. - PubMed
    1. Hinz B, et al. Recent developments in myofibroblast biology: paradigms for connective tissue remodeling. Am. J. Pathol. 2012;180:1340–1355. - PMC - PubMed

Publication types

Substances