. 2020 Sep 15;11(1):4618.
doi: 10.1038/s41467-020-18446-0.

Age and life expectancy clocks based on machine learning analysis of mouse frailty

Affiliations

Age and life expectancy clocks based on machine learning analysis of mouse frailty

Michael B Schultz et al. Nat Commun. .

Erratum in

Abstract

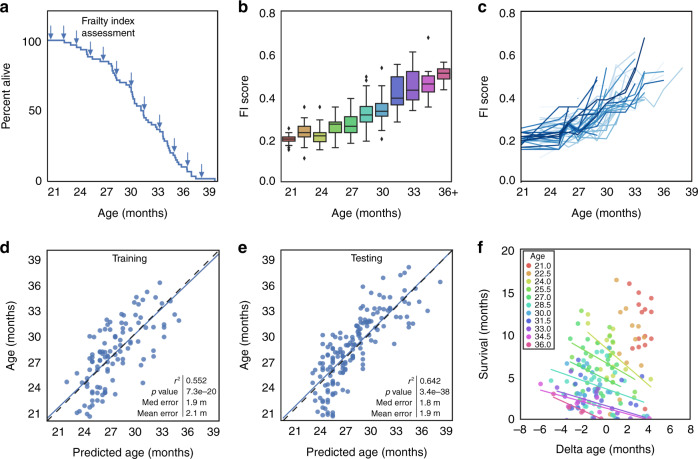
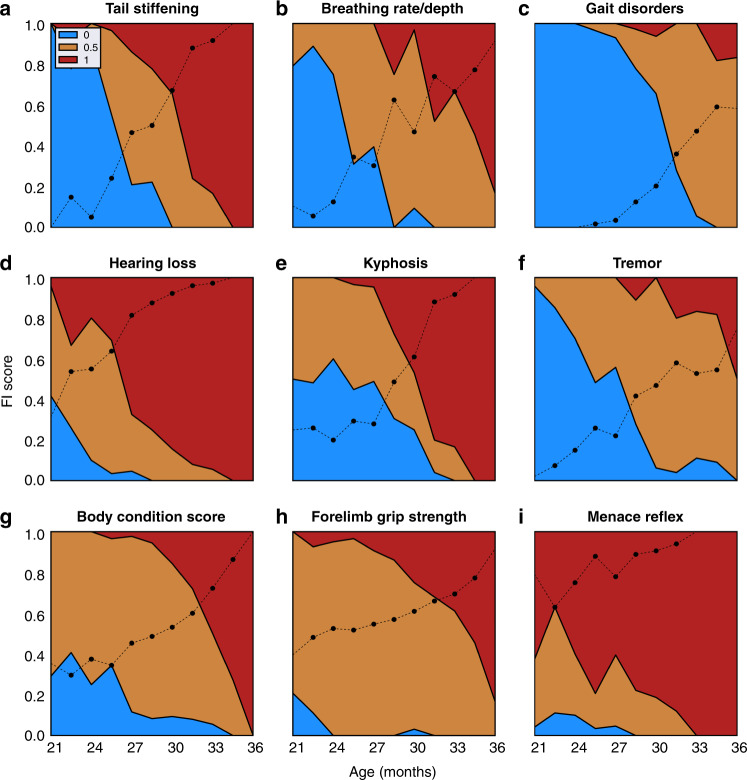
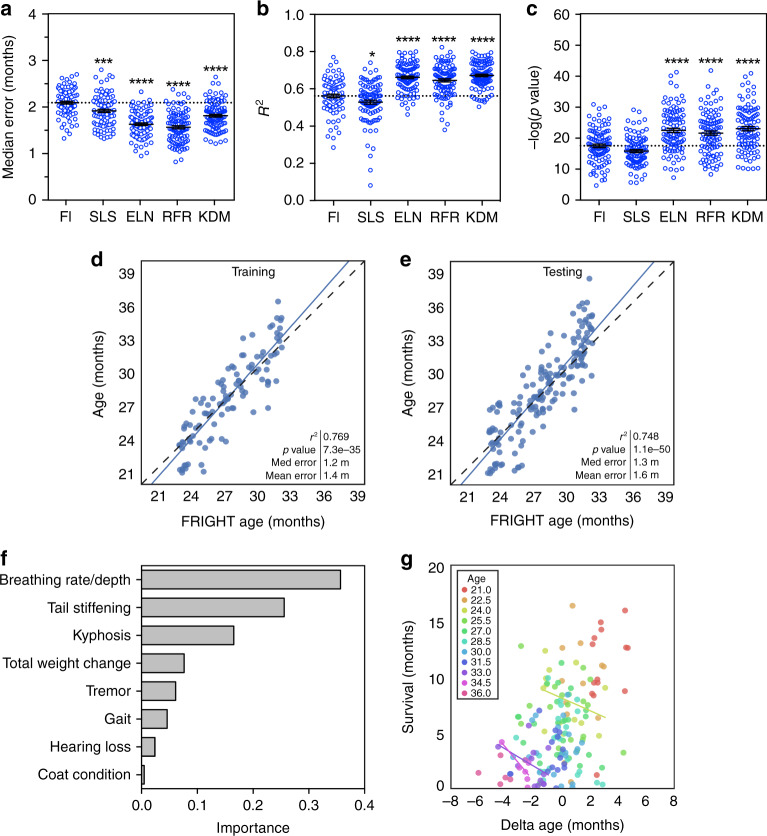
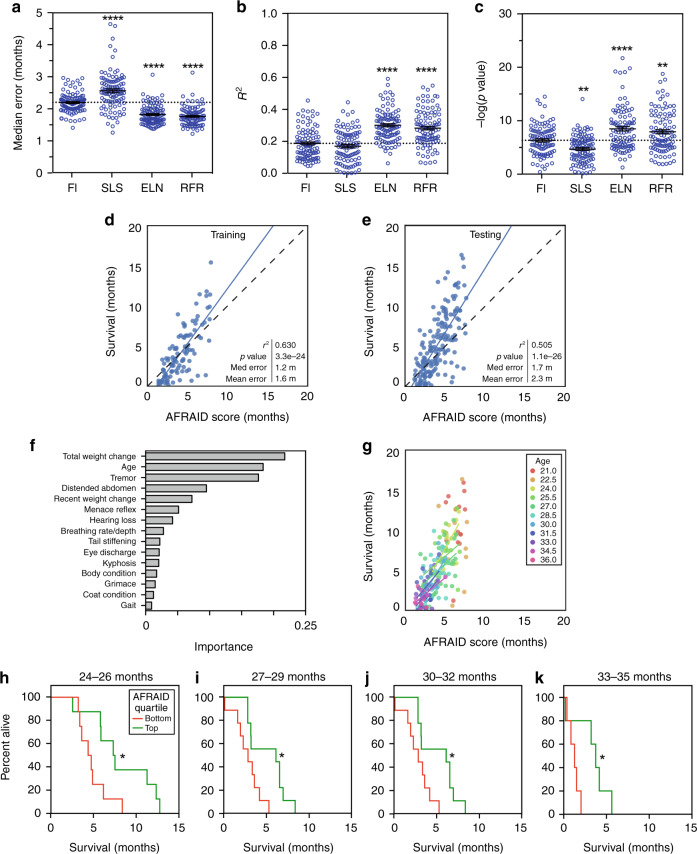
The identification of genes and interventions that slow or reverse aging is hampered by the lack of non-invasive metrics that can predict the life expectancy of pre-clinical models. Frailty Indices (FIs) in mice are composite measures of health that are cost-effective and non-invasive, but whether they can accurately predict health and lifespan is not known. Here, mouse FIs are scored longitudinally until death and machine learning is employed to develop two clocks. A random forest regression is trained on FI components for chronological age to generate the FRIGHT (Frailty Inferred Geriatric Health Timeline) clock, a strong predictor of chronological age. A second model is trained on remaining lifespan to generate the AFRAID (Analysis of Frailty and Death) clock, which accurately predicts life expectancy and the efficacy of a lifespan-extending intervention up to a year in advance. Adoption of these clocks should accelerate the identification of longevity genes and aging interventions.


Conflict of interest statement

D.A.S. is a founder, equity owner, advisor to, director of, consultant to, investor in and/or inventor on patents licensed to Vium, Jupiter Orphan Therapeutics, Cohbar, Galilei Biosciences, GlaxoSmithKline, OvaScience, EMD Millipore, Wellomics, Inside Tracker, Caudalie, Bayer Crop Science, Longwood Fund, Zymo Research, Immetas, and EdenRoc Sciences (and affiliates Arc-Bio, Dovetail Genomics, Claret Bioscience, Revere Biosensors, UpRNA and MetroBiotech, Liberty Biosecurity); Life Biosciences (and affiliates Selphagy, Senolytic Therapeutics, Spotlight Biosciences, Animal Biosciences, Iduna, Continuum Biosciences, Jumpstart Fertility (an NAD booster company), and Lua Communications); Iduna is a cellular reprogramming company, partially owned by Life Biosciences. D.S.V. sits on the board of directors of both companies. D.A.S. is an inventor on a patent application filed by Mayo Clinic and Harvard Medical School that has been licensed to Elysium Health; his personal share is directed to the Sinclair lab. For more information see https://genetics.med.harvard.edu/sinclair-test/people/sinclair-other.php. M.S.B. is a stockholder for MetroBiotech and Animal Biosciences, a division of Lifebiosciences. Other authors have no conflicts to declare.

Figures

Fig. 1
Fig. 1. Frailty correlates with and is predictive of age in mice.
a Kaplan–Meier survival curve for male C57BL/6 mice (n = 60) assessed longitudinally for Frailty Index (FI) (indicated by arrows). b Box and whisker plots displaying median FI scores for mice from 21 to 36 months of age. Colors indicate different ages (n = 24, 27, 20, 29, 43, 36, 32, 25, 18, 11, 6). Box plots represent median, lower and upper quartiles, and 95 percentile. c FI score trajectories for each individual mouse from 21 months until death. d Univariate regression of FI score for chronological age on a training dataset, and e a testing dataset. For training and testing datasets, data were randomly divided 50:50, separated by mouse rather than by assessment, n = 106 datapoints for training and n = 165 for testing. Correlation determined by Pearson correlation coefficients. f Residuals of the regression (delta age), plotted against survival for individual ages (as demonstrated by different colors). Regression lines are only graphed for ages where there is an r2 value >0.1. Source data are provided as a Source Data file.
Fig. 2
Fig. 2. Individual FI items vary in their correlation with age.
Mean scores across all mice (black line) for the top nine individual items of the Frailty Index (FI) that were correlated with chronological age. Colors indicate proportion of mice at each age with each score (0, blue; 0.5, orange, 1, red). Source data are provided as a Source Data file.
Fig. 3
Fig. 3. Multivariate regressions of individual FI items to predict age (FRIGHT age).
ac Median error, r2 values and p values for univariate regression of Frailty Index (FI) score, and multivariate regressions of the individual FI items using either simple least squares (SLS), elastic net (ELN), the Klemera–Doubal method (KDM), or random forest regression (RFR) for chronological age in the mouse training set. All models were tested with bootstrapping with replacement repeated 100 times, and each bootstrapping incidence is plotted as a separate point. ****p < 0.0001 and ***p  < 0.001 compared to FI model with one-way ANOVA. Error bars represent standard error of the mean. d, e Random forest regression of the individual FI items for chronological age on training and testing datasets (data was randomly divided 50:50, separated by mouse rather than by assessment, n = 106 datapoints for training and n = 165 for testing). This model is termed FRIGHT (Frailty Inferred Geriatric Health Timeline) age. Correlation determined by Pearson correlation coefficients. f Importances of top eight items included in the FRIGHT age model. g Residuals of the regression (delta age) plotted against survival for individual ages (as demonstrated by different colors). Regression lines are only graphed for ages where there is an r2 value >0.1. Source data are provided as a Source Data file.
Fig. 4
Fig. 4. Multivariate regressions of FI items to predict life expectancy (AFRAID clock).
a–c Median error, r2 values, and p values for univariate regression of Frailty Index (FI) score, and multivariate regressions of the individual FI items using either simple least squares (SLS), elastic net (ELN), or random forest regression (RFR) for life expectancy in the mouse training set. All models were tested with bootstrapping with replacement repeated 100 times, and each bootstrapping incidence is plotted as a separate point. ****p < 0.0001 and ***p < 0.001 compared to FI model with one-way ANOVA. Error bars represent standard error of the mean. d, e Random forest regression of the individual FI items for life expectancy on training and testing datasets (data was randomly divided 50:50, separated by mouse rather than by assessment, n = 106 datapoints for training and n = 165 for testing), plotted against actual survival. This model is termed the AFRAID (Analysis of Frailty and Death) clock. Correlation determined by Pearson correlation coefficients. f Importances of top 15 items included in the AFRAID clock. g AFRAID clock scores plotted against actual survival for individual mouse age groups (as demonstrated by different colors) in the testing dataset. Regression lines are only graphed for ages where there is an r2 value >0.1. hk Kaplan–Meier curves of the bottom (red lines) and top (green lines) quartiles of AFRAID clock scores for mice over 1–2 assessments at 24–26, 27–29, 30–32, and 33–35 months of age. *p < 0.05 compared with two-sided log-rank test. Exact p values, respectively: 0.032, 0.015, 0.026, and 0.034. Source data are provided as a Source Data file.
Fig. 5
Fig. 5. Response of FRIGHT age and AFRAID clock to interventions.
ac Frailty Index (FI) score, FRIGHT (Frailty Inferred Geriatric Health Timeline) age and AFRAID (Analysis of Frailty and Death) clock for male 23-month-old C57BL/6 mice treated with enalapril-containing food (280 mg/kg) or control diet from 16 months of age. Data reanalyzed from previously published work. Control n = 13, Enalapril n = 21. Exact p values, respectively: 0.001, 0.046, 0.29. df FI score, FRIGHT age, and AFRAID clock for male 27-month-old C57BL/6 mice treated with either a control diet (0.45% methionine) or methionine-restricted diet (0.1% methionine, MetR) from 21 months of age. *p value <0.05, **p < 0.01, and ***p < 0.001 compared with independent two-sided t-tests. Control n = 11, MetR n = 13. Exact p values, respectively, 0.001, 0.039, 0.006. Error bars represent standard error of the mean. Source data are provided as a Source Data file.

References

    1. Butler RN, et al. Aging: the reality: biomarkers of aging: from primitive organisms to humans. J. Gerontol. A Biol. Sci. Med. Sci. 2004;59:B560–B567. - PubMed
    1. Rantanen T, et al. Muscle strength and body mass index as long-term predictors of mortality in initially healthy men. J. Gerontol. A Biol. Sci. Med. Sci. 2000;55:168–173. - PubMed
    1. Bittner V, et al. Prediction of mortality and morbidity with a 6-minute walk test in patients with left ventricular dysfunction. JAMA. 1993;270:1702–1707. - PubMed
    1. Alpert, A. et al. A clinically meaningful metric of immune age derived from high-dimensional longitudinal monitoring. Nat. Med. 25, 487–495 (2019). - PMC - PubMed
    1. Martínez de Toda I, Vida C, Sanz San Miguel L, De la Fuente M. When will my mouse die? Life span prediction based on immune function, redox and behavioural parameters in female mice at the adult age. Mech. Ageing Dev. 2019;182:111125. - PubMed

Publication types