. 2020 Sep 15;11(1):4635.
doi: 10.1038/s41467-020-18476-8.

A predictive index for health status using species-level gut microbiome profiling

Affiliations

A predictive index for health status using species-level gut microbiome profiling

Vinod K Gupta et al. Nat Commun. .

Abstract

Providing insight into one's health status from a gut microbiome sample is an important clinical goal in current human microbiome research. Herein, we introduce the Gut Microbiome Health Index (GMHI), a biologically-interpretable mathematical formula for predicting the likelihood of disease independent of the clinical diagnosis. GMHI is formulated upon 50 microbial species associated with healthy gut ecosystems. These species are identified through a multi-study, integrative analysis on 4347 human stool metagenomes from 34 published studies across healthy and 12 different nonhealthy conditions, i.e., disease or abnormal bodyweight. When demonstrated on our population-scale meta-dataset, GMHI is the most robust and consistent predictor of disease presence (or absence) compared to α-diversity indices. Validation on 679 samples from 9 additional studies results in a balanced accuracy of 73.7% in distinguishing healthy from non-healthy groups. Our findings suggest that gut taxonomic signatures can predict health status, and highlight how data sharing efforts can provide broadly applicable discoveries.


Conflict of interest statement

V.K.G. and J.S. disclose that a patent application was filed relating to the materials in this manuscript. All other authors declare no competing interests.

Figures
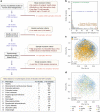
Fig. 1
Fig. 1. Multi-study integration of human stool metagenomes leads to a meta-dataset of healthy and nonhealthy gut microbiomes.
a Schematic overview. A survey was conducted in PubMed and Google Scholar to search for published studies with publicly available human stool metagenome (gut microbiome) samples from healthy and nonhealthy individuals. The initial collection of stool metagenomes consisted of 7589 samples from 55 independent studies. All samples (.fastq files) were downloaded and reprocessed uniformly using identical bioinformatics methods. After quality control of sequenced reads, species-level taxonomic profiling was then performed. Studies and metagenome samples were removed based on several exclusion criterias. Finally, a total of 4347 samples (2636 and 1711 metagenomes from healthy and nonhealthy individuals, respectively) from 34 studies ranging across healthy and 12 nonhealthy phenotypes were assembled into a meta-dataset for downstream analyses. b Distribution of microbial species’ prevalence across the 4347 stool metagenome samples in the meta-dataset. After removing viruses, unknown/unclassified species-level entities, and rarely observed species (i.e., detected <1% of all samples), 313 species remained for further analyses. c Principal coordinates analysis (PCoA) ordination plot based on Bray–Curtis distances shows that healthy (blue; n = 2636) and nonhealthy (orange; n = 1711) groups have significantly different distributions of gut microbiome profiles according to PERMANOVA (R2 = 0.017, P < 0.001) after adjusting for each sample’s study origin. Each point corresponds to a sample. Ellipses correspond to 95% confidence regions. d In an identical PCoA plot, each color represents one of the 13 different phenotypes of health or disease. Among- and within-group dissimilarities differ only weakly (ANOSIM R = 0.21, P = 0.001).
Fig. 2
Fig. 2. GMHI is associated with high-density lipoprotein cholesterol (HDLC).
a GMHI shows a moderately positive correlation with HDLC (Spearman’s ρ = 0.34, 95% CI: [0.28, 0.40], P = 7.19 × 10−24), which is a key parameter of cardiovascular health, in 841 subjects. b Significantly higher abundances of HDLC were observed in subjects with positive GMHI compared to those with negative GMHI (two-sided Mann–Whitney U test, P = 1.22 × 10−16). d Cliff’s Delta. The sample size of each group, whose subjects’ HDLC records were available in the original studies, is shown within parentheses. Standard box-and-whisker plots (e.g., center line, median; box limits, upper and lower quartiles; whiskers, 1.5× interquartile range; circles, outliers) are used to depict groups of numerical data.
Fig. 3
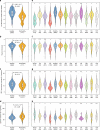
Fig. 3. Comparisons among GMHI and other ecological metrics in stratifying healthy from nonhealthy phenotypes.
ad Significantly higher distributions of GMHI (P = 5.06 × 10−212), Shannon diversity (P = 8.50 × 10−9), and 80% abundance coverage (P = 2.30 × 10−12) were observed in gut microbiomes of healthy than in those of nonhealthy individuals, whereas higher species richness (P = 2.30 × 10−46) was observed in nonhealthy gut microbiomes. The strongest effect size (Cliff’s Delta, d) was seen with GMHI. eh The healthy group was found to have a significantly higher distribution of GMHIs than all but one (SA) of the 12 nonhealthy phenotypes. For Shannon diversity and 80% abundance coverage, only three nonhealthy phenotypes (CD, OB, and T2D) were found to have significantly different distributions compared to healthy; both properties were higher in healthy than in CD, OB, and T2D. For species richness, 7 (ACVD, CA, CC, OB, OW, RA, and T2D) of the 12 nonhealthy phenotypes were observed to have significantly higher richness than healthy; in contrast, only CD showed significantly lower richness compared to healthy. All P values shown above the violin plots were found using the two-sided Mann–Whitney U test. *P < 0.001 in two-sided Mann–Whitney U test; n.s., not significant. The sample size of each group is shown within parentheses. ACVD atherosclerotic cardiovascular disease, CA colorectal adenoma, CC colorectal cancer, CD Crohn’s disease, IGT impaired glucose tolerance, OB obesity, OW overweight, RA rheumatoid arthritis, SA symptomatic atherosclerosis, T2D type 2 diabetes, UC ulcerative colitis, UW underweight. Standard box-and-whisker plots (e.g., center line, median; box limits, upper and lower quartiles; whiskers, 1.5× interquartile range; circles, outliers) are used to depict groups of numerical data.
Fig. 4
Fig. 4. Changes in group proportions and in Shannon diversity with respect to GMHI.
a All 4347 metagenomes were binned according to their GMHI values (x-axis). Each gray bar indicates the total number of samples in each bin (y-axis, right). Points indicate proportions (i.e., percentages) of samples in each bin corresponding to either healthy or nonhealthy individuals (y-axis, left). In bins with a positive range of GMHIs, the majority of samples classified as healthy; in contrast, samples in bins with a negative range of GMHIs mostly classified as nonhealthy. This trend was more pronounced towards bins on the far right and left. b GMHI stratifies healthy (n = 2636) and nonhealthy (n = 1711) groups more strongly compared to Shannon diversity. Each point in the scatter-plot corresponds to a metagenome sample (4347 in total). Histograms show the distribution of healthy (blue) and nonhealthy (orange) samples based on the parameter of each axis. In general, GMHI and Shannon diversity demonstrate a weak correlation (Spearman’s ρ = 0.17, 95% CI: [0.14, 0.19], P = 1.7 × 10−28). The P value (H0: ρ = 0) was determined by using a t-distribution with n − 2 degrees of freedom, where n is the total number of observations.
Fig. 5
Fig. 5. GMHI generally outperforms other microbiome ecological characteristics in distinguishing case and control across multiple study-specific comparisons.
In each of the 12 studies wherein at least 10 case (i.e., disease or abnormal bodyweight conditions) and at least 10 control (i.e., healthy) subjects were available, stool metagenomes were analyzed to compare a GMHI, b Shannon diversity, c 80% abundance coverage, and d species richness between healthy and nonhealthy phenotype(s). GMHI was found to have a significantly higher distribution in healthy for 11 (out of 28) case–control comparisons across nine different studies; Shannon diversity and 80% abundance coverage were found to have significantly higher distributions in healthy for two and four case–control comparisons (across two and four studies), respectively; and species richness was found to have a significantly lower distributions in healthy for three case–control comparisons across three different studies. Each study’s phenotype sample size is shown within parentheses to the right of the phenotype abbreviation. Standard box-and-whisker plots (e.g., center line, median; box limits, upper and lower quartiles; whiskers, 1.5× interquartile range; points, samples) are used to depict groups of numerical data. The same colors in boxplots were used for the same phenotypes. P values (two-sided Mann–Whitney U test) for each study-specific comparison between healthy and nonhealthy phenotypes are shown adjacent to the boxplots accordingly: * and Ψ indicates significantly different distributions consistent with, and opposite to, respectively, the previously observed results when healthy and nonhealthy groups were compared in aggregate. * or Ψ0.01 ≤ P value < 0.05; ** or ΨΨ0.001 ≤ P value < 0.01; *** or ΨΨΨ0.0001 ≤ P value < 0.001; **** or ΨΨΨΨP value < 0.0001. ACVD atherosclerotic cardiovascular disease, CA colorectal adenoma, CC colorectal cancer, CD Crohn’s disease, IGT impaired glucose tolerance, OB obesity, OW overweight, RA rheumatoid arthritis, SA symptomatic atherosclerosis, T2D type 2 diabetes, UC ulcerative colitis, UW underweight.
Fig. 6
Fig. 6. GMHI demonstrates strong reproducibility on an independent validation cohort.
The validation cohort (679 stool metagenome samples) consisted of 12 total sub-cohorts ranging across eight healthy and nonhealthy phenotypes from nine different studies. a GMHIs from stool metagenomes of the healthy group were significantly higher than those of the nonhealthy group (two-sided Mann–Whitney U test, P = 3.49 × 10−28). d Cliff’s Delta. b All three healthy sub-cohorts (H1, H2, and H3) were found to have significantly higher distributions of GMHI than seven (of nine) nonhealthy sub-cohorts (AS4, CC5-I, CC5-J, CD6, LC7, NAFLD8, and RA9). No significant differences were found among H1, H2, and H3. The number in superscript adjacent to phenotype abbreviations corresponds to a particular study used in validation (see Supplementary Table 5 for study information). Standard box-and-whisker plots (e.g., center line, median; box limits, upper and lower quartiles; whiskers, 1.5× interquartile range; points, samples) are used to depict groups of numerical data. *Significantly higher distribution in healthy sub-cohort (two-sided Mann–Whitney U test, P < 0.01). The number adjacent to * indicates the healthy sub-cohort (H1, H2, or H3) to which the respective sub-cohort was compared. The sample size of each group or cohort is shown within parentheses. AS ankylosing spondylitis, CA colorectal adenoma, CC colorectal cancer, CD Crohn’s disease, H healthy, LC liver cirrhosis, NAFLD, nonalcoholic fatty liver disease, RA rheumatoid arthritis.

Similar articles

Cited by

References

    1. Wirbel J, et al. Meta-analysis of fecal metagenomes reveals global microbial signatures that are specific for colorectal cancer. Nat. Med. 2019;25:679–689. - PMC - PubMed
    1. Thomas AM, et al. Metagenomic analysis of colorectal cancer datasets identifies cross-cohort microbial diagnostic signatures and a link with choline degradation. Nat. Med. 2019;25:667–678. - PMC - PubMed
    1. Scher JU, Abramson SB. The microbiome and rheumatoid arthritis. Nat. Rev. Rheumatol. 2011;7:569–578. - PMC - PubMed
    1. Jangi S, et al. Alterations of the human gut microbiome in multiple sclerosis. Nat. Commun. 2016;7:12015. - PMC - PubMed
    1. Lloyd-Price J, et al. Multi-omics of the gut microbial ecosystem in inflammatory bowel diseases. Nature. 2019;569:655–662. - PMC - PubMed

Publication types