. 2020 Sep 15;10(1):15062.
doi: 10.1038/s41598-020-71675-7.

Molecular mechanisms underlying AMH elevation in hyperoestrogenic states in males

Affiliations

Molecular mechanisms underlying AMH elevation in hyperoestrogenic states in males

Clara Valeri et al. Sci Rep. .

Abstract

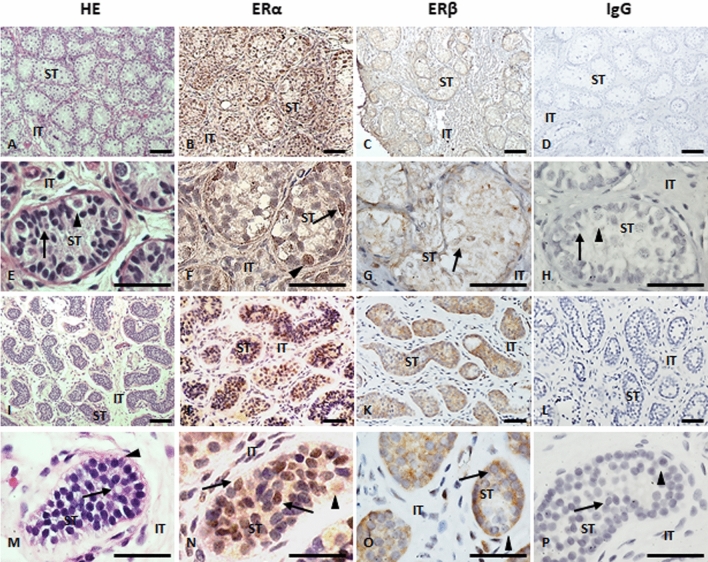
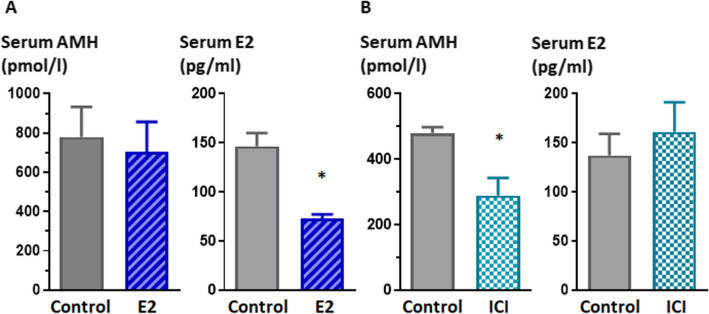
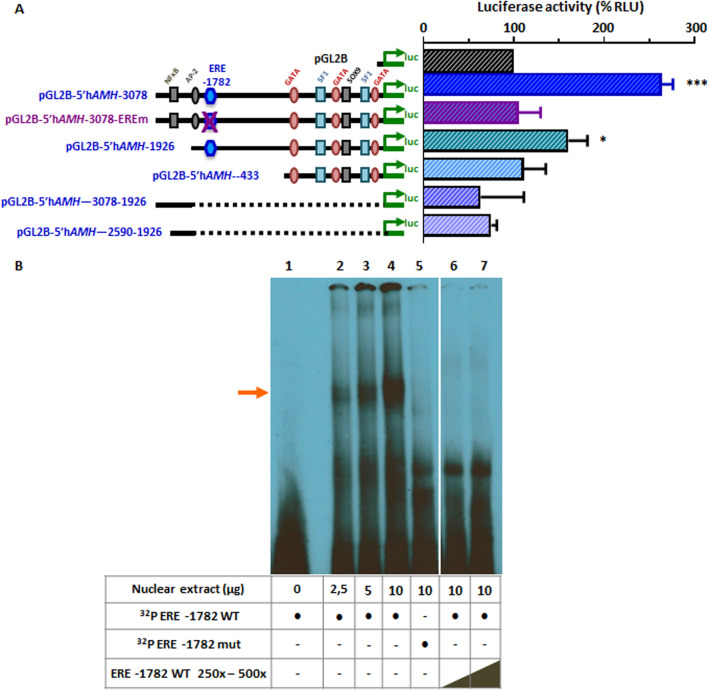
Anti-Müllerian hormone (AMH) is secreted by Sertoli cells of the testes from early fetal life until puberty, when it is downregulated by androgens. In conditions like complete androgen insensitivity syndrome (CAIS), AMH downregulation does not occur and AMH increases at puberty, due in part to follicle-stimulating hormone (FSH) effect. However, other conditions like Peutz-Jeghers syndrome (PJS), characterised by low FSH, also have increased AMH. Because both CAIS and PJS may present as hyperoestrogenic states, we tested the hypothesis that oestradiol (E2) upregulates AMH expression in peripubertal Sertoli cells and explored the molecular mechanisms potentially involved. The results showed that E2 is capable of inducing an upregulation of endogenous AMH and of the AMH promoter activity in the prepubertal Sertoli cell line SMAT1, signalling through ERα binding to a specific ERE sequence present on the hAMH promoter. A modest action was also mediated through the membrane oestrogen receptor GPER. Additionally, the existence of ERα expression in Sertoli cells in patients with CAIS was confirmed by immunohistochemistry. The evidence presented here provides biological plausibility to the hypothesis that testicular AMH production increases in clinical conditions in response to elevated oestrogen levels.


Conflict of interest statement

The authors declare no competing interests.

Figures

Figure 1
Figure 1
Immunohistochemistry for ERα and ERβ. A-H: Normal prepubertal human testis (biopsy showing unaffected tissue from a 7-year-old boy with acute lymphoblastic leukaemia). I-P: Testis from a 6-year-old patient with complete androgen insensitivity syndrome (CAIS). HE haematoxylin–eosin, IgG primary antibody was replaced by IgG from nonimmune serum (negative control), IT interstitial tissue, ST seminiferous tubule; arrows: Sertoli cells (ovoid or elongated nuclei); arrowheads: germ cells (spermatogonia, round nuclei and abundant pale cytoplasm). Detection was performed using HC-20 antibody for human ERα, and Ab1531 for human ERβ. The bars represent 60 µm.
Figure 2
Figure 2
Serum AMH and E2 levels in mice. (A) Serum levels of AMH and E2 in 9-day-old male mice treated sc with E2 (20 µg/day) or vehicle from postnatal day 4 to day 8. (B) Serum levels of AMH and E2 in 9-day-old male mice treated sc with ICI 182780 0.8 mg (single dose) or vehicle on postnatal day 4. * P < 0.05, Student's t-test for unpaired samples, n = 8.
Figure 3
Figure 3
Luciferase assays to assess human AMH promoter (3,078 bp) activity in SMAT1 cells. (A) Western blot for ERα (left) and ERβ (right) in SMAT1 cells, non-transfected or transfected with pSG5-ERα or pSG5-ERβ, in MCF-7 cell line and uterus—that endogenously express ERα—and in KGN cell line endogenously expressing ERβ. Detection was performed using the following antibodies: HC-20 (human ERα), MC-20 (murine ERα), 1531 (human ERβ) and Y-19 (murine ERβ). Representative of 3 experiments. (B) Cells transfected with pGL2B or pGL2B-5′hAMH-3078, but not transfected with ER expression vectors were exposed to E2 10–9 M or basal medium. % RLU: relative luciferase units, considering the baseline condition (pGL2B without E2) as 100%. Student's t-test for paired data, n = 4. (C) Cells transfected with pGL2B-5′hAMH-3078, and co-transfected with pSG5-ERα, pSG5-ERβ or both, were exposed to E2 from 0 to 10–7 M. The grey curve repeated in all figures corresponds to SMAT1 cells not transfected with ER vectors. % RLU: relative luciferase units, considering the baseline condition (without ER and without E2) as 100%. * P < 0.05 ERα or ERβ or ERα + ERβ vs no ER, Student's t-test for paired data, n = 4. (D) Cells transfected with pGL2B-5′hAMH-3078, and co-transfected with pSG5, pSG5-ERα, pSG5-ERβ or both, were exposed to E2 10–9 M or basal medium. % RLU: relative luciferase units, considering the baseline condition (without ER and without E2) as 100%. *** P < 0.001 ERα or ERβ or ERα + ERβ vs no ER, analysis of variance (ANOVA), followed by Tukey's multiple comparison test, n = 8. (E) Endogenous expression of AMH protein in SMAT1 cells transfected with ERα and exposed to E2 10-9 M. The intensity of AMH immunofluorescence (green) was compared between SMAT1 cells effectively transfected with pSG5-ERα (red) and neighbouring non-transfected cells. Quantifications are shown on the right panel; * P < 0.05, Student's t-test for paired data, n = 7.
Figure 4
Figure 4
Effect of ER agonists and antagonists on hAMH promoter activity in SMAT1 cells. (A) Activity of pGL2B-5′hAMH-3078 in cells transfected with pSG5 or pSG5-ERα in basal conditions (considered as 100% of relative luciferase, RLU) and after incubation with E2 10–9 M and/or the selective antagonist ICI 182780 10–6 M. *** P < 0.001, analysis of variance (ANOVA), followed by Tukey's multiple comparison test, n = 8. (B) Activity of pGL2B-5′hAMH-3078 in ERα-transfected cells in basal conditions (considered as 100% of RLU) and after incubation with E2 10–9 M, the selective ERα agonist 10–6 M PPT or the selective ERα antagonist MPP 10–8 M. * P < 0.05, t-test for one sample compared to theoretical value of 100% (basal), n = 3.
Figure 5
Figure 5
Relevance of the ERE site for E2 regulation of the hAMH promoter. (A) Luciferase activity of various pGL2B-5´hAMH constructs in SMAT1 Sertoli cells co-transfected with pSG5-ERα and incubated in basal conditions (considered as 100% of the relative luciferase units, RLU) or with E2 10–9 M. The percentage value reflects the response (E2/basal × 100). ERE: half-oestrogen response element present at position −1,782 of the human AMH promoter. * P < 0.05, *** P < 0.001, t-test for one sample compared to theoretical value of 100% (basal), n = 3. (B) Electro-mobility shift assay (EMSA) to test ERα binding to the hemi-ERE present at – 1,782 of hAMH promoter. Nuclear extracts from SMAT1 cells (between 0 and 10 µg) were incubated with a 32P-labeled DNA probe spanning the sequence of the wild-type (WT) or mutated (mut) hemi-ERE site and an excess (250 × or 500 ×) of ERE unlabelled WT probe. The arrow indicates the band corresponding to the WT ERE probe. Lane 1 does not contain nuclear extract. Lanes between 6 and 7, with irrelevant or duplicated experimental conditions, were cropped (for full-length blot, please see Supplementary material).
Figure 6
Figure 6
Relevance of GPER signalling in E2 regulation of the hAMH promoter. (A–C) Characterisation of GPER expression in SMAT1 cells: (A) electrophoresis after RT-PCR for GPER. L: 100-bp ladder, C + : positive control from human kidney cells, I: non- transfected SMAT1, II-IV: SMAT1 transfected with pcDNA3-GPR30-GFP (II: without RT enzyme, III: without cDNA): a ~ 540-bp band indicating GPER expression is observed in the transfected cells as well as in the positive control; (B) immunofluorescence in non-transfected SMAT1 cells; (C) immunofluorescence in SMAT1 transfected with pcDNA3-GPR30-GFP (arrows indicate positive cells, with higher magnification in the bottom figure). (D) SMAT1 cells transfected with pGL2B-5′hAMH-3078, and co-transfected with pcDNA3-GPR30-GFP were exposed to E2 from 0 to 10–8 M. The grey curve corresponds to SMAT1 cells not transfected with GPER. % RLU: relative luciferase units, considering the baseline condition (without GPER and without E2) as 100%. (E) Activity of pGL2B-5′hAMH-3078 in SMAT cells transfected or not with pcDNA3-GPR30-GFP in basal conditions (B, considered as 100% of relative luciferase, RLU) and after incubation with E2 10–9 M, the selective GPER agonist G-1 (100 nM) and the selective antagonist G-15 (100 nM). * P < 0.05, analysis of variance (ANOVA), followed by Sidak's multiple comparison test-all versus B (basal) for each set (non-transfected or GPER-transfected), n = 10.
Figure 7
Figure 7
Proposed model for oestradiol (E2) regulation of the testicular AMH production in Sertoli cells. E2 upregulates AMH transcription mainly through nuclear oestrogen receptor α (ERα) binding to a specific oestrogen response element (ERE) on the AMH promoter, located 1,782 bp upstream of the translational start site. More modestly, GPER activation also upregulates AMH expression. The increased AMH expression results in a higher testicular AMH production. Another potential mechanism, not studied in this work, which could increase testicular AMH production is the increase in Sertoli cell proliferation induced by membrane-bound ERα, signalling through the PI3K/Akt pathway, and/or GPER, through MAPK signalling (dotted lines).

References

    1. Picard JY, Goulut C, Bourrillon R, Josso N. Biochemical analysis of bovine testicular anti-Müllerian hormone. FEBS Lett. 1986;195:73–76. doi: 10.1016/0014-5793(86)80133-8. - DOI - PubMed
    1. Cate RL, et al. Isolation of the bovine and human genes for Müllerian inhibiting substance and expression of the human gene in animal cells. Cell. 1986;45:685–698. doi: 10.1016/0092-8674(86)90783-x. - DOI - PubMed
    1. Picard JY, Benarous R, Guerrier D, Josso N, Kahn A. Cloning and expression of cDNA for anti-Müllerian hormone. Proc. Natl. Acad. Sci. USA. 1986;83:5464–5468. doi: 10.1073/pnas.83.15.5464. - DOI - PMC - PubMed
    1. Cohen-Haguenauer O, et al. Mapping of the gene for anti-mullerian hormone to the short arm of human chromosome 19. Cytogenet. Cell Genet. 1987;44:2–6. doi: 10.1159/000132332. - DOI - PubMed
    1. Tran D, Meusy-Dessolle N, Josso N. Anti-Müllerian hormone is a functional marker of foetal Sertoli cells. Nature. 1977;269:411–412. doi: 10.1038/269411a0. - DOI - PubMed

Publication types