. 2020 Sep 15;10(1):15101.
doi: 10.1038/s41598-020-72011-9.

Influence of host genetics in shaping the rumen bacterial community in beef cattle

Affiliations

Influence of host genetics in shaping the rumen bacterial community in beef cattle

Waseem Abbas et al. Sci Rep. .

Abstract

In light of recent host-microbial association studies, a consensus is evolving that species composition of the gastrointestinal microbiota is a polygenic trait governed by interactions between host genetic factors and the environment. Here, we investigated the effect of host genetic factors in shaping the bacterial species composition in the rumen by performing a genome-wide association study. Using a common set of 61,974 single-nucleotide polymorphisms found in cattle genomes (n = 586) and corresponding rumen bacterial community composition, we identified operational taxonomic units (OTUs), Families and Phyla with high heritability. The top associations (1-Mb windows) were located on 7 chromosomes. These regions were associated with the rumen microbiota in multiple ways; some (chromosome 19; position 3.0-4.0 Mb) are associated with closely related taxa (Prevotellaceae, Paraprevotellaceae, and RF16), some (chromosome 27; position 3.0-4.0 Mb) are associated with distantly related taxa (Prevotellaceae, Fibrobacteraceae, RF16, RFP12, S24-7, Lentisphaerae, and Tenericutes) and others (chromosome 23; position 0.0-1.0) associated with both related and unrelated taxa. The annotated genes associated with identified genomic regions suggest the associations observed are directed toward selective absorption of volatile fatty acids from the rumen to increase energy availability to the host. This study demonstrates that host genetics affects rumen bacterial community composition.


Conflict of interest statement

Samodha C. Fernando, author of this publication has disclosed a significant financial interest in NuGUT LLC. In accordance with its Conflict of Interest policy, the University of Nebraska-Lincoln’s Conflict of Interest in Research Committee has determined that this must be disclosed. The rest of the authors have nothing to disclose.

Figures

Figure 1
Figure 1
Distribution of taxa across all cohorts. The heatmap above displays the abundance and distribution of all taxa identified in at least 1% of the total animals (n = 586). The relative abundances of 237 families present within the CMM is shown above. The columns represent the samples and rows represents the relative abundance of each family. Top 17 families which accounts for nearly 90% abundance of all the families are labeled in the heatmap.
Figure 2
Figure 2
First and Second principle components of the genomic relationship matrix for USMARC and UNL animals demonstrating limited genomic variation in the two locations. A genomic relationship matrix was constructed for all the animals sampled from USMARC and UNL using the SNP information. The principal component analysis (PCA) was run on genomic relationship matrix and first two principal components (PC1 and PC2) were plotted. USMARC refers to animals that were fed at either the U.S. Meat Animal Research Center and UNL refers to animals fed at the University of Nebraska-Lincoln.
Figure 3
Figure 3
Posterior heritability estimates and summary statistics across taxa for phylum, family and operational taxonomic unit (OTU) categories. The relative abundances of Phyla, Families and OTUs were used to estimate the posterior heritability by using the GBLUP model (see “Methods”). The histograms represent the number of Phyla, Families and OTUs that fall into a specific range of posterior heritability. The table shows the mean, median, standard deviation and the minimum and maximum posterior heritability for different taxonomy levels.
Figure 4
Figure 4
SNP mapping of the rumen gut microbiota. The circular diagram depicts the 29 bovine autosomes drawn to scale. Each black line represents 3 Mb region of the chromosome that includes the position of the SNPs used for Genome Wide Association Study. Red lines represent 1 Mb regions (Table 1) that have associations with different bacterial taxa in the rumen. The list of identified genes when annotated in the 1 Mb window are listed close to the region. A representative phylogenetic tree was generated from the rumen bacterial reads using the Interactive tree of life (iTOL). Major phyla are color-coded and associated chromosome(s) are listed with each phyla. The roman numerals represent families as follows; I—Prevotellaceae, II—Paraprevotellaceae, III—S24-7, IV—RF16, V—BS11, VI—RFP12, VII—Succinivibrionaceae, VIII—Lachnospiraceae, IX—Ruminococcaceae, X—Clostridiaceae, XI—Veillonellaceae. The complete list of annotated genes and their position on each chromosome is listed in supplementary Table S1.
Figure 5
Figure 5
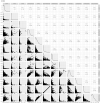
Correlations between OTU, Phyla and Family abundance associated with chromosome 9 (A) and chromosome 27 (B). A matrix was generated using log (1 + x) transformed relative abundances for OTUs, Phyla and Families associated with each chromosome and pairwise Pearson correlations were calculated and scatter plots and density plots were generated for each chromosome. The pairwise correlations among all the identified taxa on all chromosomes are shown in supplementary figure S3 and further taxonomic information of all identified OTUs can be found in Supplementary Table S1.
Figure 5
Figure 5
Correlations between OTU, Phyla and Family abundance associated with chromosome 9 (A) and chromosome 27 (B). A matrix was generated using log (1 + x) transformed relative abundances for OTUs, Phyla and Families associated with each chromosome and pairwise Pearson correlations were calculated and scatter plots and density plots were generated for each chromosome. The pairwise correlations among all the identified taxa on all chromosomes are shown in supplementary figure S3 and further taxonomic information of all identified OTUs can be found in Supplementary Table S1.

References

    1. Anderson CL, Schneider CJ, Erickson GE, MacDonald JC, Fernando SC. Rumen bacterial communities can be acclimated faster to high concentrate diets than currently implemented feedlot programs. J. Appl. Microbiol. 2016;120:588–599. doi: 10.1111/jam.13039. - DOI - PMC - PubMed
    1. Church DC. The Ruminant Animal Digestive Physiology and Nutrition. Long Grove: Waveland Press Inc; 1993.
    1. Hobson PN. The Rumen Microbial Ecosystem. London: Elsevier Applied Science; 1988.
    1. Hungate RE. The Rumen and Its Microbes. London: Academic Press Inc; 1966.
    1. Li F, et al. Host genetics influence the rumen microbiota and heritable rumen microbial features associate with feed efficiency in cattle. Microbiome. 2019;7:92. doi: 10.1186/s40168-019-0699-1. - DOI - PMC - PubMed

Publication types

Substances