. 2020 Sep 15;10(1):15065.
doi: 10.1038/s41598-020-72137-w.

The role of geography in the complex diffusion of innovations

Affiliations

The role of geography in the complex diffusion of innovations

Balázs Lengyel et al. Sci Rep. .

Abstract

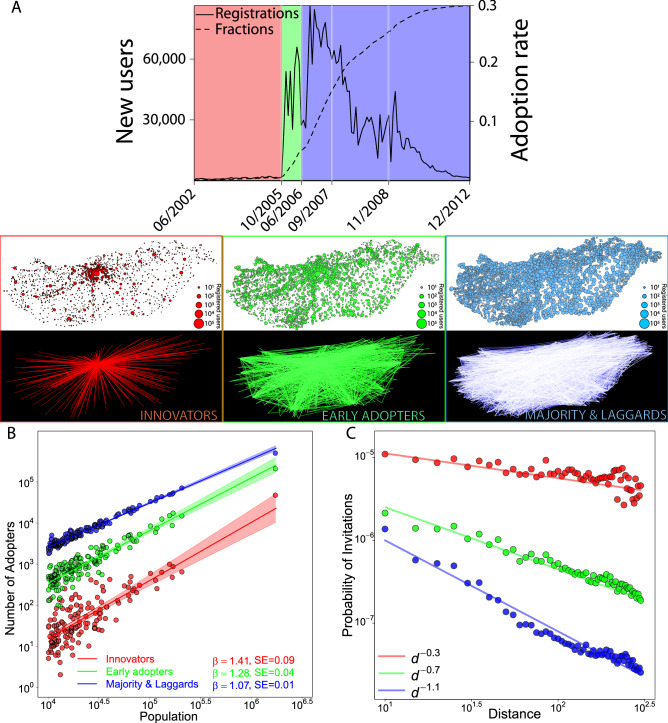
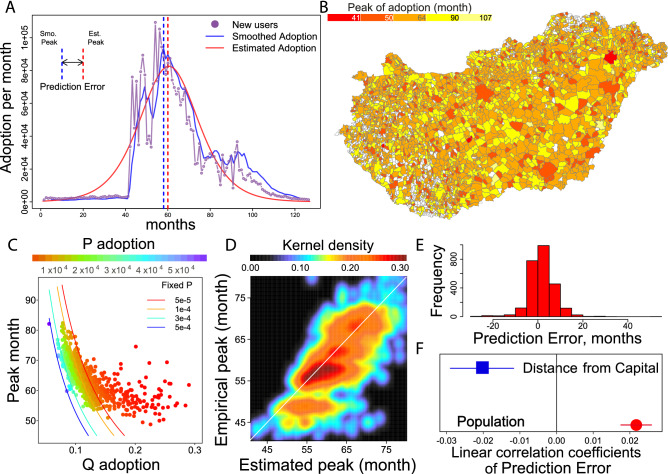
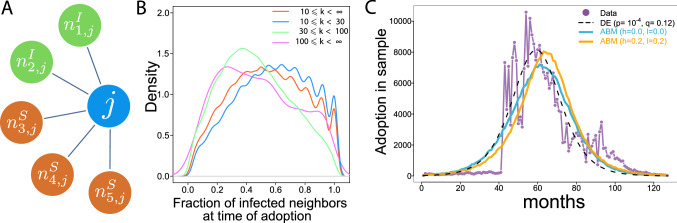
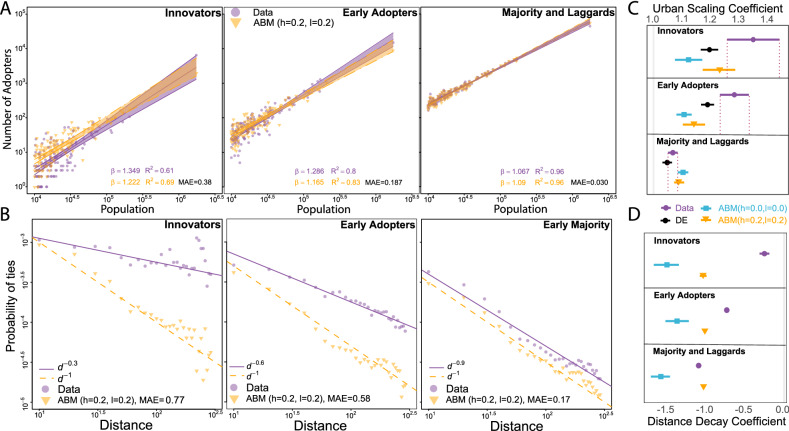
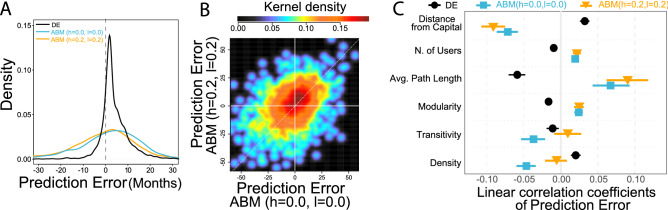
The urban-rural divide is increasing in modern societies calling for geographical extensions of social influence modelling. Improved understanding of innovation diffusion across locations and through social connections can provide us with new insights into the spread of information, technological progress and economic development. In this work, we analyze the spatial adoption dynamics of iWiW, an Online Social Network (OSN) in Hungary and uncover empirical features about the spatial adoption in social networks. During its entire life cycle from 2002 to 2012, iWiW reached up to 300 million friendship ties of 3 million users. We find that the number of adopters as a function of town population follows a scaling law that reveals a strongly concentrated early adoption in large towns and a less concentrated late adoption. We also discover a strengthening distance decay of spread over the life-cycle indicating high fraction of distant diffusion in early stages but the dominance of local diffusion in late stages. The spreading process is modelled within the Bass diffusion framework that enables us to compare the differential equation version with an agent-based version of the model run on the empirical network. Although both model versions can capture the macro trend of adoption, they have limited capacity to describe the observed trends of urban scaling and distance decay. We find, however that incorporating adoption thresholds, defined by the fraction of social connections that adopt a technology before the individual adopts, improves the network model fit to the urban scaling of early adopters. Controlling for the threshold distribution enables us to eliminate the bias induced by local network structure on predicting local adoption peaks. Finally, we show that geographical features such as distance from the innovation origin and town size influence prediction of adoption peak at local scales in all model specifications.


Conflict of interest statement

The authors declare no competing interests.

Figures

Figure 1
Figure 1
Spatial diffusion over the OSN life-cycle. (A) Top: Number of new users and the cumulative fraction of registered individuals among total population over the OSN life-cycle. Users are categorized by the time of their registration into Rogers’s adopter types: (1) innovators: first 2.5%, (2) early adopters: next 13.5%, (3) early and late majority and laggards. White background maps: coloured dots depict towns; their size represent the number of adopters over the corresponding period. Black background maps: links depict the number of invitations sent between towns over the corresponding periods. (B) Adoption scales super-linearly with town population. The β coefficient of urban scaling denotes very strong concentration of adoption in the Innovator stage and decreases gradually in later stages. Fitted lines explain the variation in Number of Adopters (log) by R2=0.63 (red), R2=0.83 (green), R2=0.97 (blue). (C) The Probability of Invitations to distant locations is relatively high in the Inventors stage but decreased over the product life-cycle while diffusion became more local. Exponent fits explain the variation of Probability of Invitations (log) with R2=0.24 (red line), R2=0.85 (green line), R2=0.92 (blue line).
Figure 2
Figure 2
Adoption peak prediction on local scales with the Bass model. (A) The Bass DE model estimates on the monthly adoption trend and a smoothed empirical adoption trend (3-month moving average) are compared. We investigate the difference between estimated peak month and the peak of the smoothed trend. (B) Times of adoption peaks vary across towns. (C) Estimated pi and qi result in same adoption peak with fixed pi, except in early adoption cases when qi is high. (D) Estimated peaks of adoption correlate with empirical peaks of adoption (p=0.74). (E) Prediction Error in town i is the predicted month of adoption peak by Equation 2 minus the empirical month of smoothed adoption peak. (F) Dots are point estimates of linear univariate regressions and bars depict standard errors. Dependent variable is scaled with its maximum value and independent variables are log-transformed with base 10.
Figure 3
Figure 3
Model of complex contagion. (A) Network topology and peers influence in the Bass ABM. A sample individual j has two infected neighbors njI who have already adopted the innovation and three susceptible neighbors who have not adopted yet njS. (B) The distribution of adoption thresholds. Fraction of infected neighbors at time of adoption illustrate that most individuals adopt when half of their neighbors have already adopted. This fraction is smaller for high degree (k>30) individuals. (C) ABM adoption curves assuming linear (h=0.0,l=0.0 in blue) and non-linear (h=0.2,l=0.2 in orange) functions of infected neighbor ratio predict slower adoption than Bass DE.
Figure 4
Figure 4
Urban scaling and distance decay in the ABM. (A) Urban scaling of adoption in the ABM (h = 0.2, l = 0.2) and in the empirical data across the product life-cycle. Solid lines denote linear regression estimation and shaded areas are 95% confidence intervals. The ABM (h = 0.2, l = 0.2) significantly over-predicts the number of Innovators in small towns. Urban scaling β in the Early Adopters phase is still smaller in the ABM (h = 0.2, l = 0.2) than in the empirical data. (B) The distance decay of social ties of Innovators and Early Adopters is larger in the ABM (h = 0.2, l = 0.2) than in reality and only becomes similar in the Early Majority phase. (C) Empirical urban scaling coefficients are declining over the life-cycle that is best captured by the ABM (h = 0.2, l = 0.2) prediction. Markers denote point estimates and horizontal lines denote standard errors. (D) Empirical distance decay coefficients are declining over the life-cycle that are not captured by the models. Markers denote point estimates and horizontal lines denote standard errors.
Figure 5
Figure 5
ABM in predicting adoption peaks in towns. (A) Prediction Error in town i is the peak month predicted by the ABM minus the month of empirical peak. Negative Prediction Error denotes early prediction and positive means late prediction. (B) Correlation of Prediction Error of ABM (h = 0.0, l = 0.0) and ABM (h = 0.2, l = 0.2) (ρ=0.39, CI [0.36; 0.43]). (C) Estimation of town-level Prediction Error of ABM versions via a simple linear regression. Independent variables are characteristics from networks within towns and geographical characteristics of towns. Symbols represent point estimates and horizontal lines denote standard errors.

References

    1. Centola D, Macy M. Complex contagions and the weakness of long ties. Am. J. Sociol. 2007;113:702–734. doi: 10.1086/521848. - DOI
    1. Bass FM. A new product growth for model consumer durables. Manag. Sci. 1969;15:215–227. doi: 10.1287/mnsc.15.5.215. - DOI
    1. Rogers EM. Diffusion of Innovations. New York: Simon and Schuster; 2010.
    1. Mahajan V, Muller E, Bass FM. New product diffusion models in marketing: A review and directions for research. J. Market. 1990;54(1):1–26. doi: 10.1177/002224299005400101. - DOI
    1. Centola D. How Behavior Spreads: The Science of Complex Contagions. Princeton: Princeton University Press; 2018.

Publication types